
A note on lower timeframe confirming price action…
Waiting for lower timeframe confirmation is our main tool to confirm strength within higher timeframe zones, and has really been the key to our trading success. It takes a little time to understand the subtle nuances, however, as each trade is never the same, but once you master the rhythm so to speak, you will be saved from countless unnecessary losing trades. The following is a list of what we look for:
- A break/retest of supply or demand dependent on which way you’re trading.
- A trendline break/retest.
- Buying/selling tails/wicks – essentially we look for a cluster of very obvious spikes off of lower timeframe support and resistance levels within the higher timeframe zone.
- Candlestick patterns. We tend to only stick with pin bars and engulfing bars as these have proven to be the most effective.
We search for lower timeframe confirmation between the M15 and H1 timeframes, since most of our higher-timeframe areas begin with the H4. Stops are usually placed 5-10 pips beyond confirming structures.
EUR/USD:
For those who’ve been following our recent reports on the EUR you may recall that our team took a short position from 1.1362 last Thursday. 50% of this position was banked just ahead of the 1.13 handle on Friday, with a final take-profit objective set around the 1.1250/1.1237 range (H4 mid-way support/H4 support). As can be seen from the H4 chart, this was achieved going into yesterday’s US open so well done to anyone who remained alongside us throughout this trade!
With the above trade ‘done and dusted’ where do we go from here? Well, despite weekly action currently occupying a major weekly resistance zone at 1.1533-1.1278, there’s a chance we may see the single currency bounce north today/tomorrow. Not only is price now trading around the above said H4 mid-way support/H4 support region at the moment (bolstered by a H4 AB=CD bullish completion point just above it around the 1.1262ish range), there also the nearby daily support area at 1.1224-1.1104 to consider. These supports were, as we mentioned prior to closing the above short position, the fundamental reasons for taking profit where we did.
Our suggestions: Although our team took profit we’re not going to be looking to buy just yet, due to the monstrous weekly resistance area currently in play, which has capped upside since May 2015! With this, one may ask: ‘well why close your short trade then?’ Quite frankly, the reason is simply because we’re just not sure how the market will respond here and did not really fancy going through another phase of drawdown.
Therefore, given our uncertainty, stepping aside here and reassessing going into to tomorrow’s sessions is the route we’re taking.

Levels to watch/live orders:
- Buys: Flat (Stop loss: N/A).
- Sells: Flat (Stop loss: N/A).
GBP/USD:
Cable rallied for a third consecutive day yesterday, resulting in price shaking hands with the underside of the H4 harmonic Gartley reversal zone seen between 1.3346/1.3263 (green zone). The response seen from this area clearly implies that there’s selling interest around this reversal point. With that being said, however, we are looking to sell a little higher up on the curve from the 1.33ish region with stops placed above the X point of the H4 harmonic pattern, mainly due to the smaller stop loss required.
By waiting for 1.33 though, there’s a chance that we could have ‘missed the boat’ here as the pair may continue to depreciate for the remainder of the week, since daily supply at 1.3371-1.3279 has now been brought into play.
Our suggestions: Quite simply, we’re in a ‘wait and see’ mode right now. If price tags 1.33 either today or tomorrow, (dependent on the time of day and H4 approach) we will sell, targeting the nearest H4 demand formed on approach as our immediate take-profit area.

Levels to watch/live orders:
- Buys: Flat (Stop loss: N/A).
- Sells: 1.33 region (Stop loss: 1.3374).
AUD/USD:
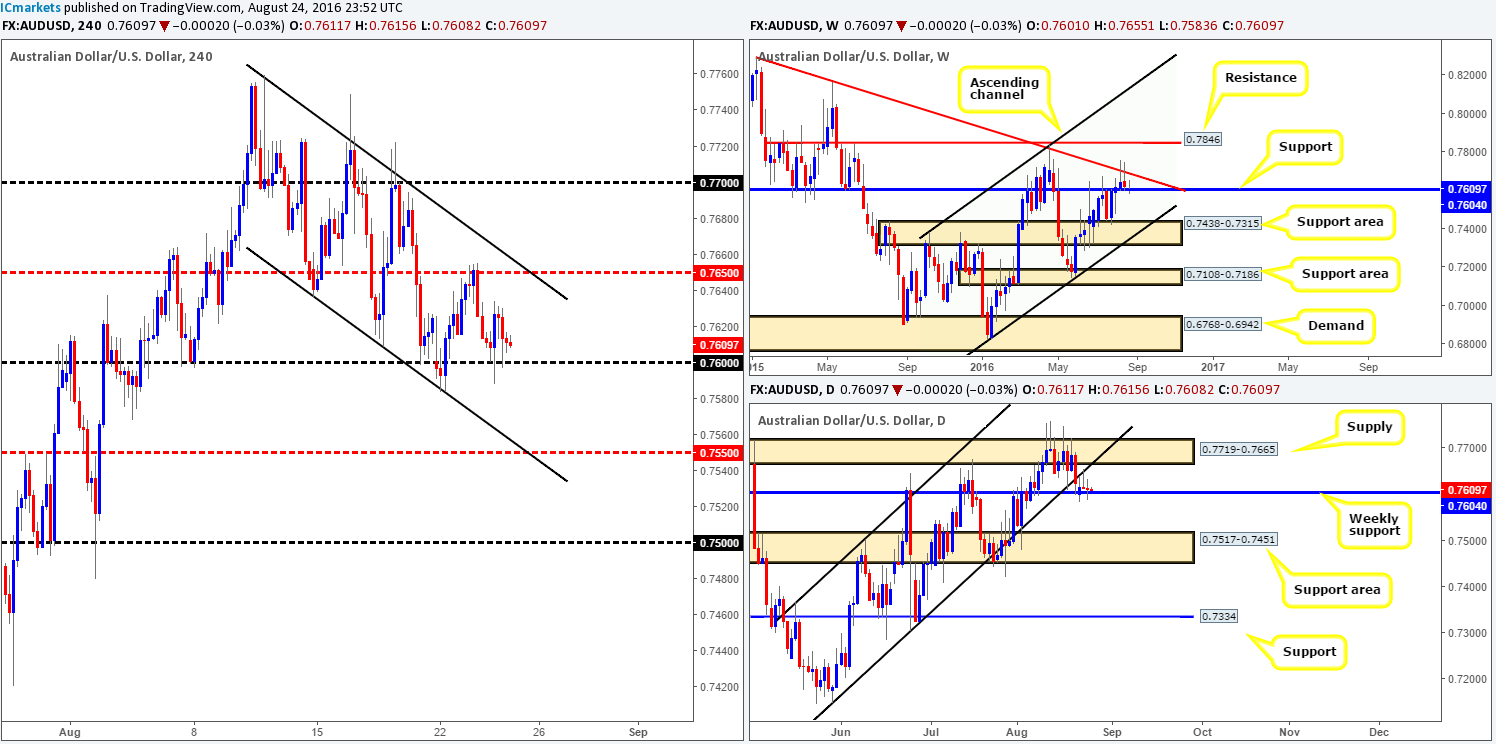
Beginning with a look at the weekly chart this morning, the technical story here remains the same: weekly buyers appear sluggish around the current weekly support level drawn from 0.7604. Any sustained move below this barrier would likely place the weekly support area at 0.7438-0.7315 (merges with a weekly channel support line taken from the low 0.6827) on the hit list.
Sliding down to the daily chart, our desk has noted the formation of an indecision candle yesterday based off the top of the above said weekly support line. Beyond this weekly support level, the next downside target on the daily scale can be seen at 0.7517-0.7451: a support area (positioned just above the aforementioned weekly support area).
Over on the H4 chart, the 0.76 handle remained on a firm footing during the course of yesterday’s sessions. It should not really come as much of a surprise to see this number hold, given its connection to the weekly support level sitting four pips above at 0.7604.
Our suggestions: Buying this pair, given the higher-timeframe’s response to the current weekly support (see above in bold), is not something we’d stamp high probability. In regard to selling, however, with both the weekly support and the 0.76 handle in play, selling this market is also not something we’d feel comfortable participating in UNTIL we see at least a daily close beyond the weekly support barrier. Therefore, until this comes into view, opting to stand on the sidelines here may very well be the best path to take today.
Levels to watch/live orders:
- Buys: Flat (Stop loss: N/A).
- Sells: Flat (Stop loss: N/A).
USD/JPY:
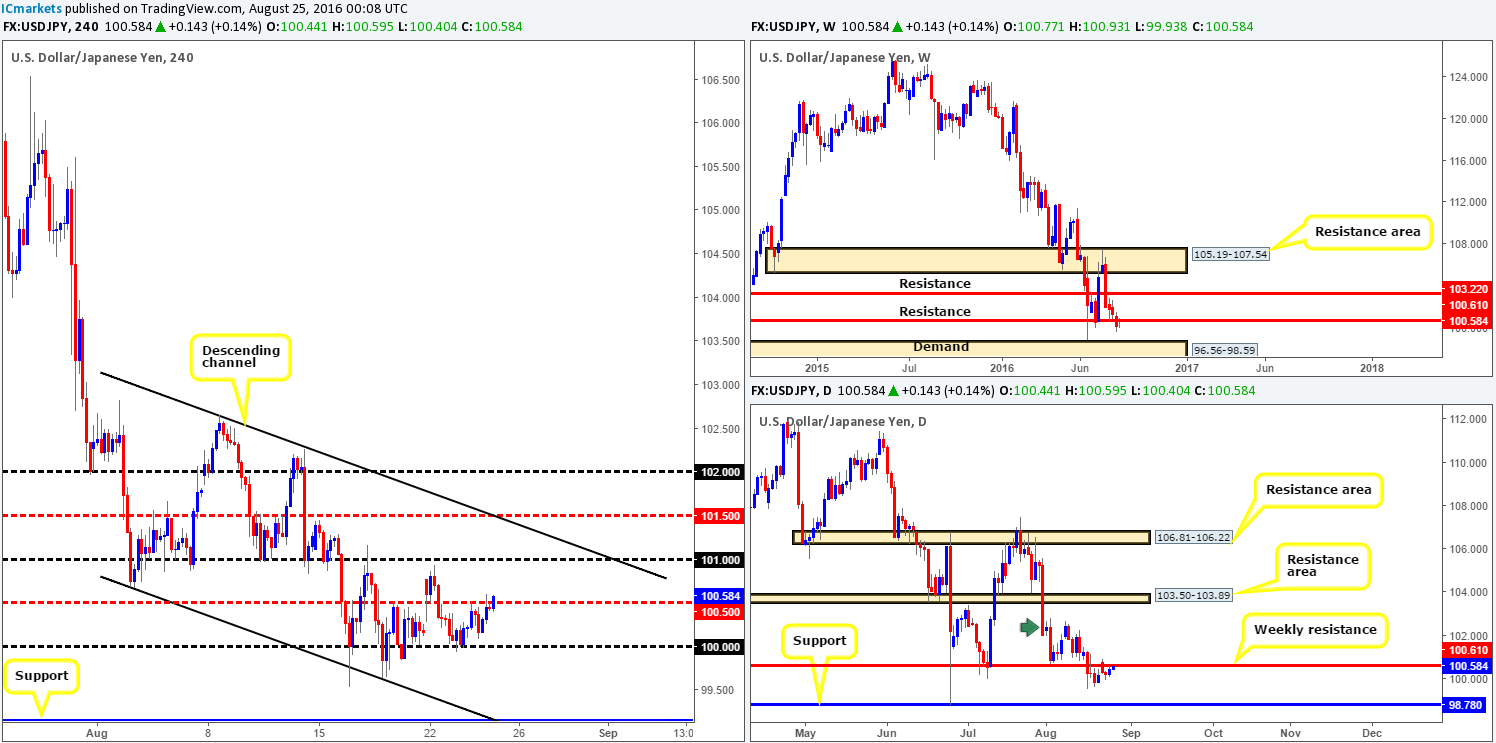
Recent action shows that the USD/JPY extended its bounce from the key figure 100 yesterday, consequently reaching the H4 mid-way resistance 100.50 by the day’s end. Owing to this mid-way number merging so closely with a weekly resistance level seen at 100.61, the bears could potentially make an appearance here today! This – coupled with the strong downtrend in play right now, shorts from the 100.50 range, targeting the 100 number is, in our opinion, a reasonable possibility. However, due to the fact that 100.50 is a fixed level in the market, a fakeout will likely take place. That being the case, we would strongly suggest waiting for lower timeframe confirmation prior to pulling the trigger. This could be either of the following:
- An engulf of demand followed by a subsequent retest as supply.
- A trendline break/retest.
- A collection of well-defined selling wicks around the 100.50 range.
Levels to watch/live orders:
- Buys: Flat (Stop loss: N/A).
- Sells: 100.50 region [Tentative – confirmation required] (Stop loss: dependent on where one confirms this area).
USD/CAD:
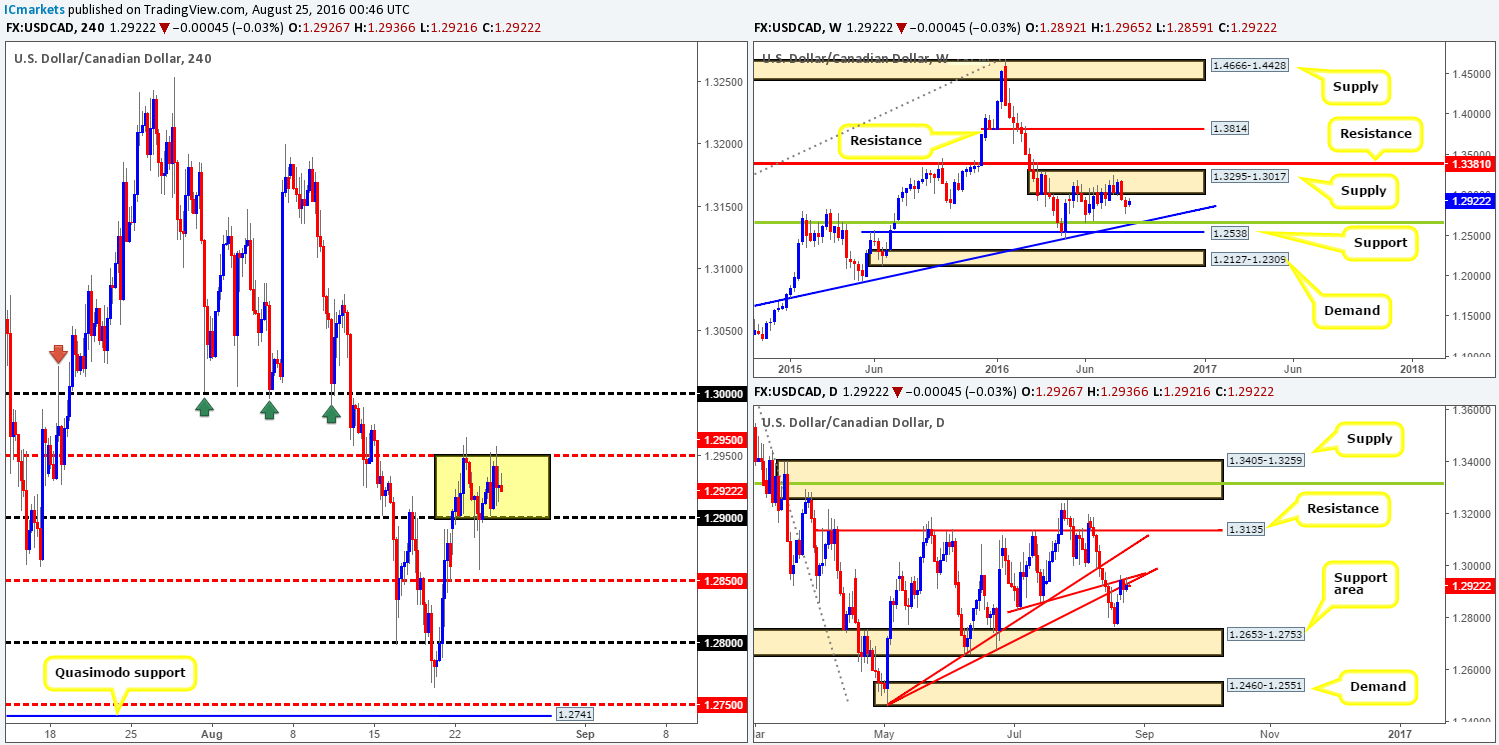
As can be seen from the H4 chart, the USD/CAD has recently entered into a phase of consolidation between the 1.29 handle and the mid-way resistance 1.2950 (yellow box). As things stand, our team has no interest in trading the edges of this newly-formed range. We’re more focused on trading the breakout/retest.
In light of daily action currently seen flirting with two daily trendline resistances (1.2460/1.2831) at the moment, this could potentially push the pair down to a support area coming in at 1.2653-1.2753. On top of this, a weekly supply area seen at 1.3295-1.3017 continues to cap upside, with the next downside target seen around a 38.2% Fib support at 1.2658 (located within the lower edge of the above said daily support area and also merges with a weekly trendline support extended from the high 1.1278).
Our suggestions: In that the higher-timeframe technicals suggest lower prices may be on the cards, we’re going to be watching for a close beyond 1.29. To enter short below this number, however, we’d need to see price retest this level as resistance alongside a lower timeframe sell signal (see the top of this report). Assuming that we manage to pin down an entry here, we’d look to trail price using the 1.2850 and 1.28 numbers to hide stops, targeting the 1.2750ish range. Why 1.2750? Well, this is simply because this number represents the top edge of the daily support area at 1.2653-1.2753.
Levels to watch/live orders
- Buys: Flat (Stop loss: N/A).
- Sells: Watch for price to close below the 1.29 handle and then look to trade any retest seen thereafter (lower timeframe confirmation required).
USD/CHF:
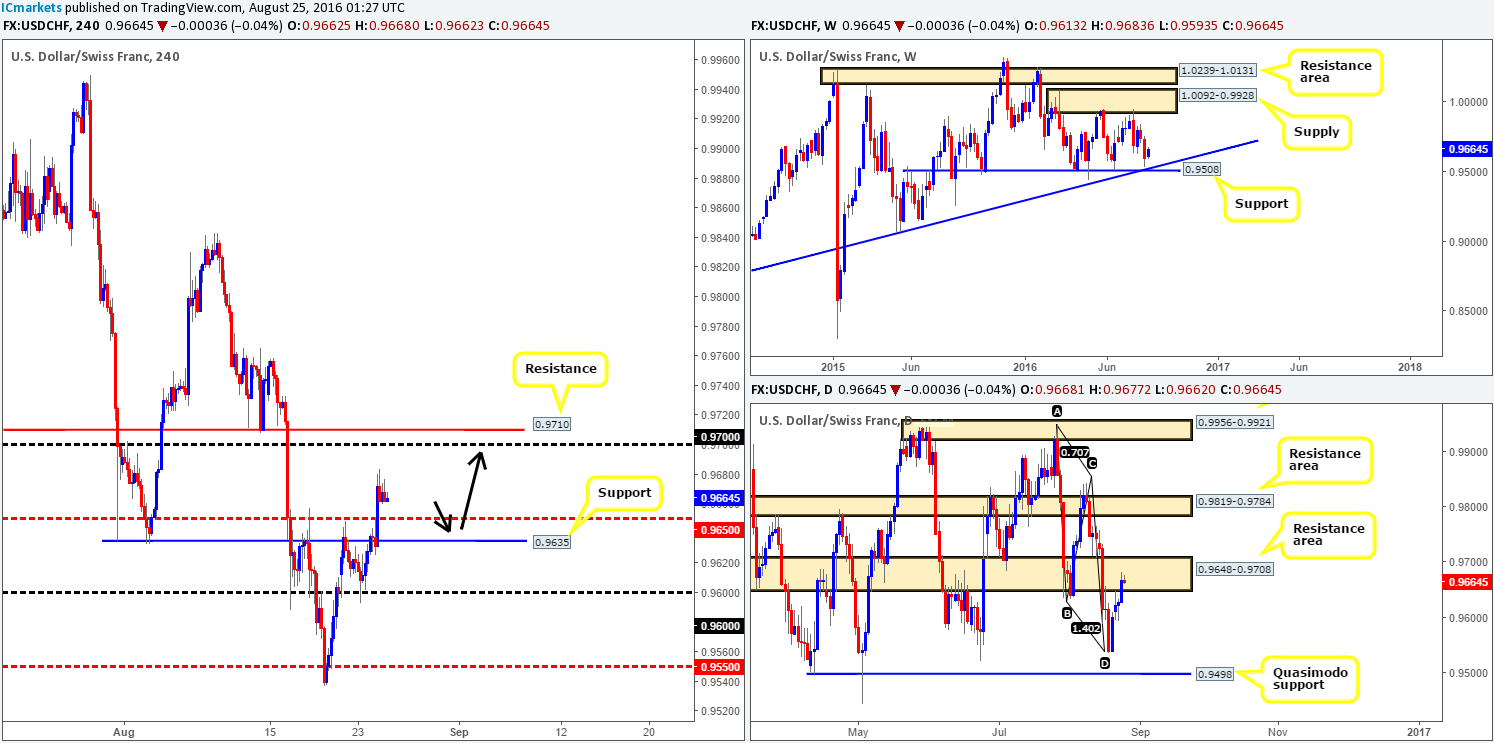
Although weekly action never actually connected with the weekly support level at 0.9508 (fuses nicely with a trendline support extended from the low 0.8703), price is currently in the process of rallying higher. However, when we step down into the daily chart, the Swissy is now seen trading within the confines of a daily resistance area drawn from 0.9648-0.9708. This, at least from a higher-timeframe perspective, leaves traders in a rather precarious position: buy into the daily resistance area or sell into the weekly support level? Over on the H4 chart, nevertheless, the recent bout of buying pulled price above the resistance at 0.9635/mid-way resistance line 0.9650, and potentially opened the doors for a continuation move north toward the 0.97 handle/0.9710 resistance.
Our suggestions: Assuming that price does not tag 0.97 (a take-profit target) before retesting the 0.9635/0.9650 region, we could have a potential intraday buy setup on our hands (see black arrows). Of course, by entering long from this area you’d effectively be buying into a daily supply area, but to offset this, you’ll have weekly flow by your side (see above). Just to be on the safe side here though guys, we would recommend waiting for lower timeframe action to prove that buyers are willing here. This could be either an engulf of supply followed by a subsequent retest as demand, a trendline break/retest or simply a collection of well-defined buying tails around the H4 buy zone.
Levels to watch/live orders:
- Buys: 0.9635/0.9650 [Tentative – confirmation required] (Stop loss: dependent on where one confirms this area).
- Sells: Flat (Stop loss: N/A).
DOW 30:
Based on recent trading, US stocks dropped to lows of 18450 yesterday, but managed to recover relatively quickly, closing the day around the lower edge of the current H4 consolidation fixed between 18591/18482. As we mentioned in yesterday’s report, although the index recently came under pressure, we do not consider this to be a bearish move until a decisive daily close is seen beyond the minor daily support at 18480. By and of itself, this would likely lead to a continuation move south down to test daily support seen at 18279 (lodged within a weekly support area coming in at 18365-18158).
Our suggestions: Keep a close eye on the lower edge of the current H4 range today. This barrier has managed to withstand three bearish attacks (see green arrows) and could, given the overall trend the US stock market is in right now, very well hold firm for a fourth time. With that in mind, should we manage to lock down a lower timeframe buy signal (see the top of this report) from here, we’ll look to enter long, targeting the upper edge of the H4 range (18591) as the first take-profit zone.
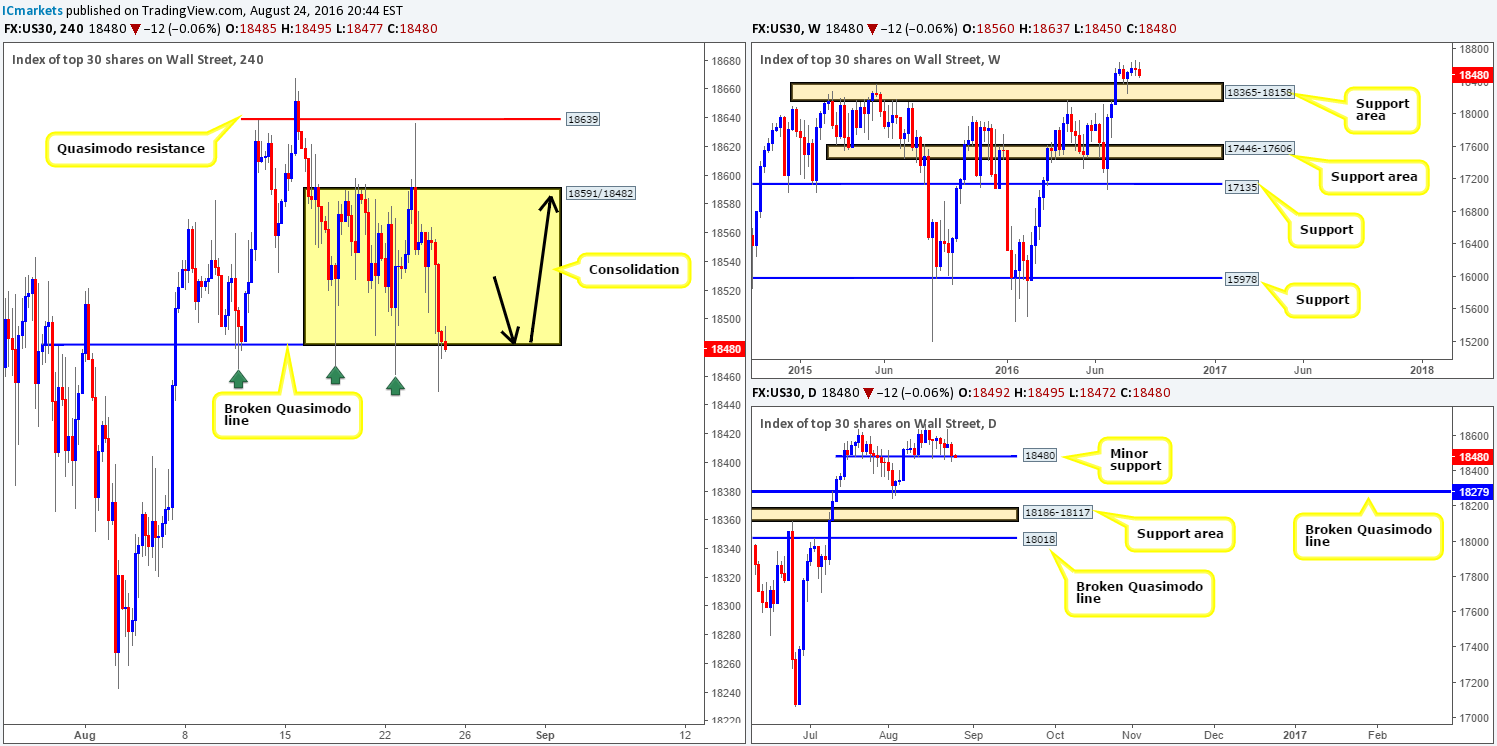
Levels to watch/live orders:
- Buys: 18482 region [Tentative – confirmation required] (Stop loss: dependent on where one confirms this area).
- Sells: Flat (Stop loss: N/A).
GOLD:
With the US dollar index seen appreciating yesterday, the gold market tumbled lower. H4 support at 1332.3 was taken out during this onslaught with price ending the day tagging the 78.6% H4 Fib support at 1322.8. This Fibonacci level represents the top edge of a H4 harmonic Gartley reversal zone (X point comes in at 1310.7), and given that it unites with the top-side of a daily demand barrier at 1305.3-1322.8 (which sits on top of a weekly support area at 1307.4-1280.0), we’re not surprised bullion stabilized around this region going into yesterday’s close.
However, for those who have already entered long here, there is a possibility that the yellow metal could drive down to the H4 demand zone at 1315.6-1319.6 before serious buyers step in. Given that this H4 demand base also merges with the above said daily demand zone, as well as being lodged within the aforementioned H4 harmonic Gartley reversal area, we have set a pending buy order at 1319.8 with a stop placed below the X point of the harmonic pattern at 1309.1.The reason as to why we did not enter long at the 78.6% Fib line was simply down to the size of the stop loss required and nothing more.
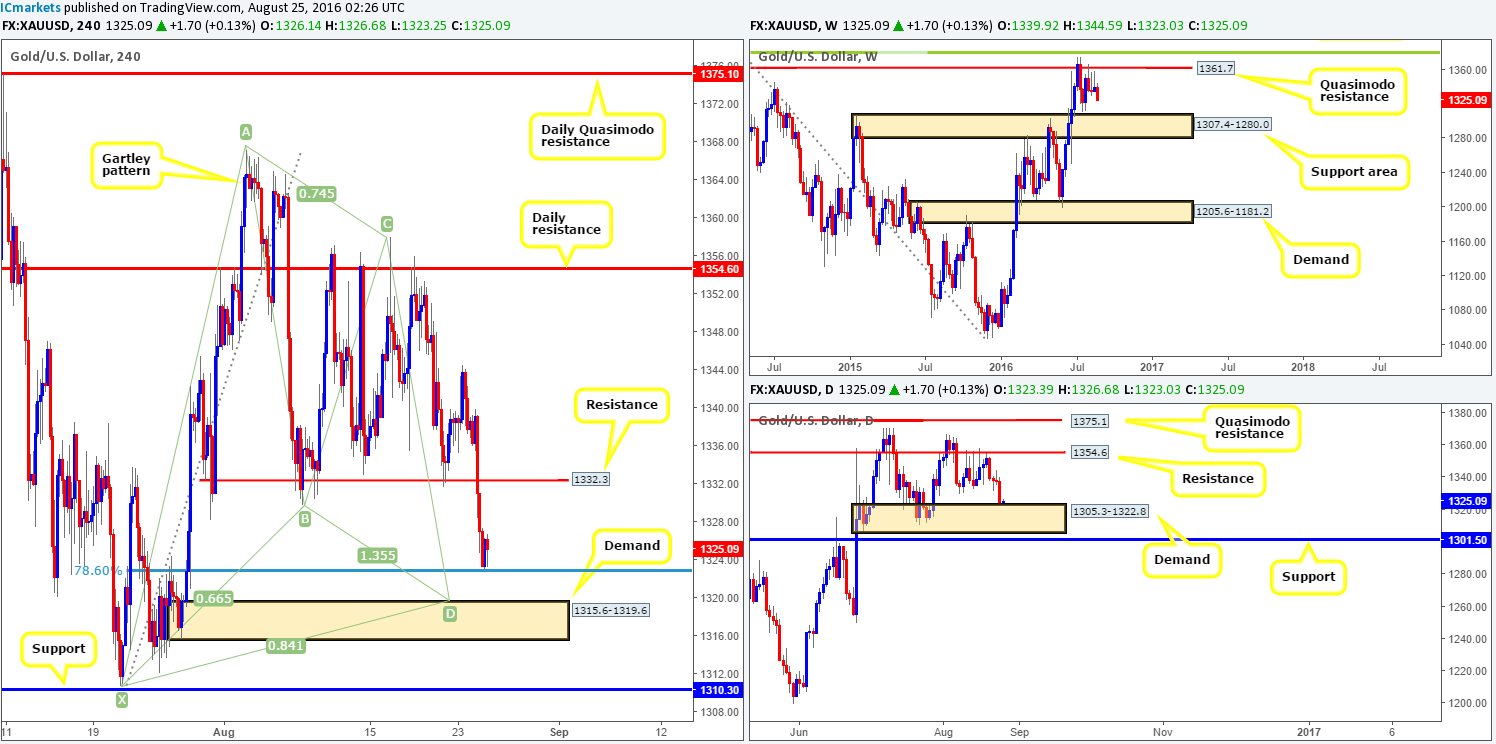
Levels to watch/live orders:
- Buys: 1319.8 [Pending order] (Stop loss: below the X point of the H4 harmonic formation: 1309.1, which is, as you can see, set just beyond the H4 support at 1310.3).
- Sells: Flat (Stop loss: N/A).


