
Key risk events today:
EUR Main Refinancing Rate, Monetary Policy Statement and ECB Press Conference; Crude Oil Inventories; New Zealand CPI q/q.
(Italics represents previous analysis and outside sources)
EUR/USD:
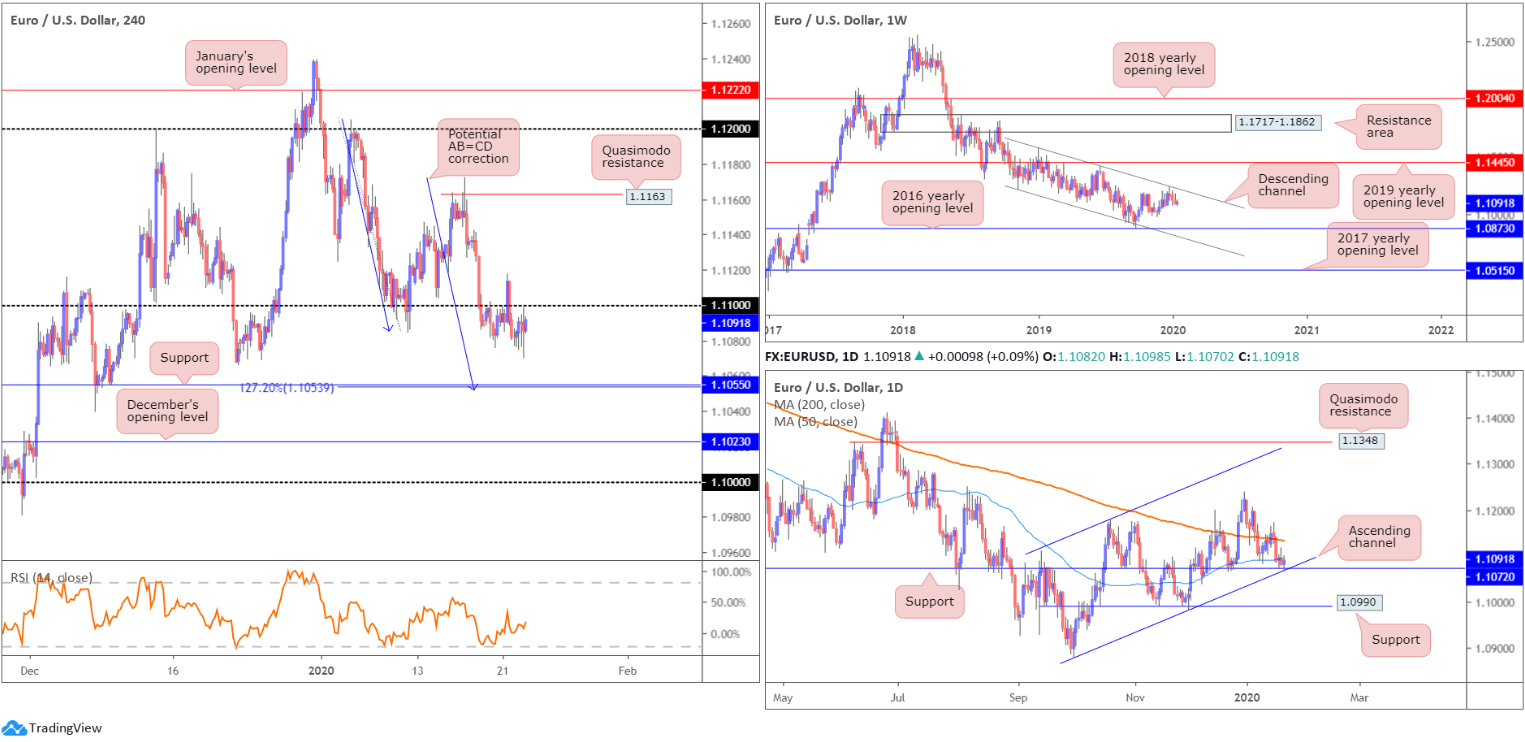
Europe’s shared currency finished mostly unmoved against the US dollar Wednesday, lingering south of the 1.11 handle. Technically, the main highlight on the H4 chart was the retest at 1.11, unlocking the door to a potential 127.2% AB=CD correction (blue arrows) to support at 1.1055. Beyond there, traders likely have their crosshairs fixed on December’s opening level at 1.1023.
Interestingly, daily movement also shook hands with support priced in at 1.1072 yesterday, which happens to converge with channel support, drawn from the low 1.0879. A violation of 1.1072, however, has support priced in at 1.0990 in sight. Also worthy of note is the 50-day SMA (blue – 1.1095) perhaps serving as resistance today, closely shadowed by the 200-day SMA (orange – 1.1133).
Action on the weekly timeframe continues to reflect a bearish tone beneath channel resistance, drawn from the high 1.1569. The next downside objective on this timeframe falls in around the 2016 yearly opening level at 1.0873 followed by channel support, taken from the low 1.1109. To the upside, assuming a break of the said channel resistance, price has the 2019 yearly opening level at 1.1445 to target. In terms of the primary trend, price has been trading lower since topping in early 2018, at 1.2555.
Areas of consideration:
For those who read Wednesday’s technical briefing you may recall the following piece:
A potential bullish scenario worthy of consideration today, one that goes against weekly direction (see above), is a reaction off daily support at 1.1072, given it converges with a daily channel support. Entry based on a H4 close back above 1.11 on the H4 timeframe (considered a bullish indicator) could, therefore, be an idea. Traders are also urged to pencil in the possibility of a fakeout occurring through the said daily level to H4 support highlighted above at 1.1055 to complete the H4 AB=CD formation, before turning higher.
Continued rejection off 1.11 implies a possible retest of H4 support 1.1055 for possible long opportunities. A H4 close above 1.11, on the other hand, also underlines a possible bullish theme (see above in bold). Upside targets north of 1.11 fall in around the 200-day SMA at 1.1133 and H4 Quasimodo resistance coming in at 1.1163.
GBP/USD:
In recent sessions, GBP/USD climbed more than 85 points, or 0.67%, following the latest Confederation of British Industry (CBI) report revealing the UK manufacturing sector began the year strong. The CBI noted the survey of 300 manufacturing firms reported that business optimism improved significantly in the quarter to January, at the fastest pace since April 2014.
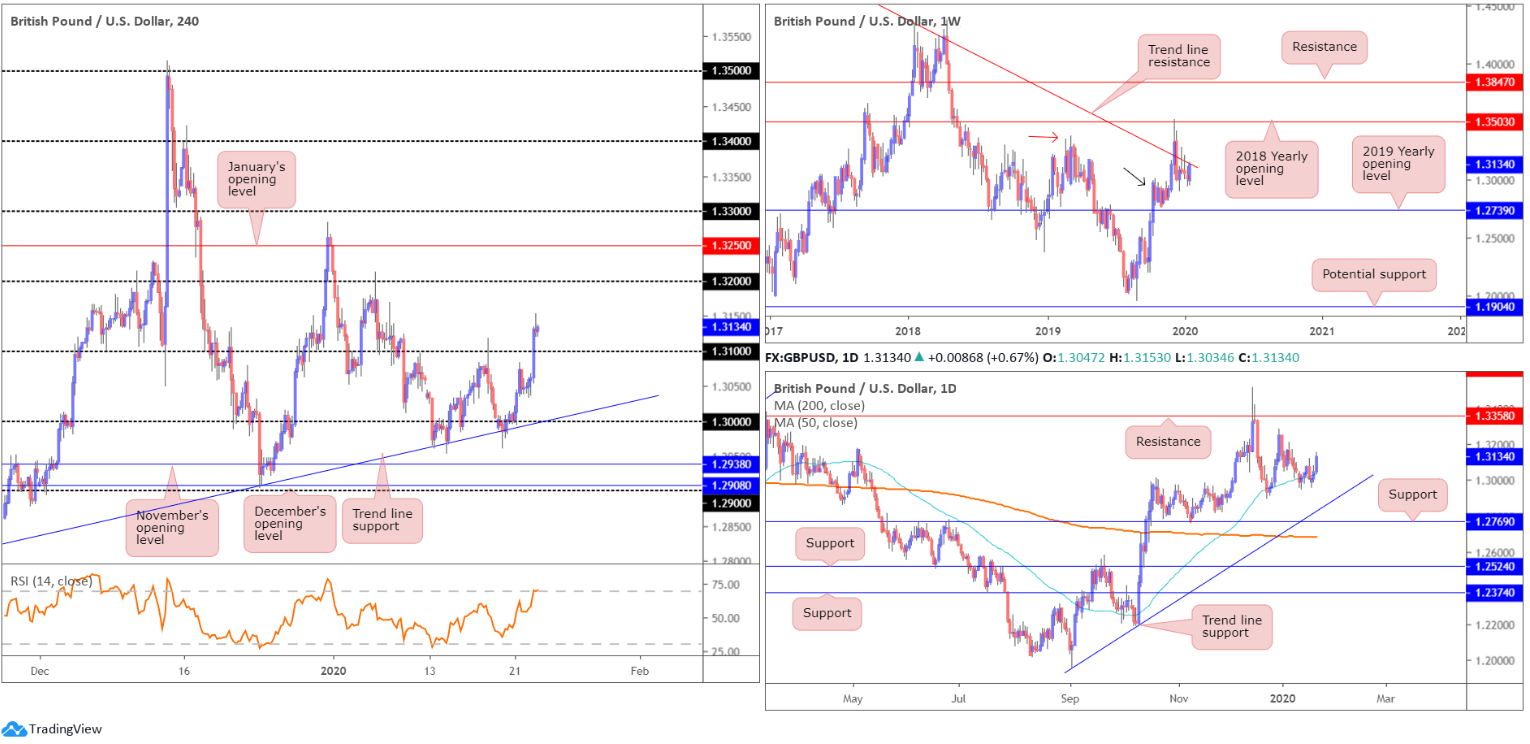
In addition to this, technical buying on the break of 1.31 added to the recent advance, perhaps clearing upside to as far north as 1.32 on the H4 timeframe, as limited supply is evident to the left of current price. While upside is likely on this scale, a retest at 1.31 is certainly not out of the question before we turn north. Indicator-based traders may also wish to note the relative strength index (RSI) is seen testing overbought conditions.
Against the backdrop of shorter-term flows, price on the weekly timeframe remains trading beneath long-standing trend line resistance (pencilled in from the high 1.5930). Buyers are also seen attempting to defend nearby demand around the 1.2939 region (black arrow), likely seduced by the recent break of the notable high at 1.3380 (red arrow).
A closer reading on the daily timeframe shows the unit gaining ground above the 50-day SMA (blue – 1.3034). With respect to resistance, the only level of interest right now sits at the 1.3284 December 31st high and 1.3358, which capped upside since mid-June 2019.
Areas of consideration:
Technically, the pair appears to be at a crossroads right now. Weekly flow is testing the underside of trend line resistance, while daily and H4 flow exhibits scope to navigate higher ground, targeting at least the 1.32 region.
A retest at 1.31, followed up with a H4 bullish candlestick signal (entry and risk can be calculated based on this pattern), may encourage buying, despite the unit trading at weekly trend line resistance. Still, traders are urged to adopt firm risk management.
AUD/USD:
Despite ranging more than 25 points between 0.6856/0.6827, AUD/USD wrapped up Wednesday unmoved.
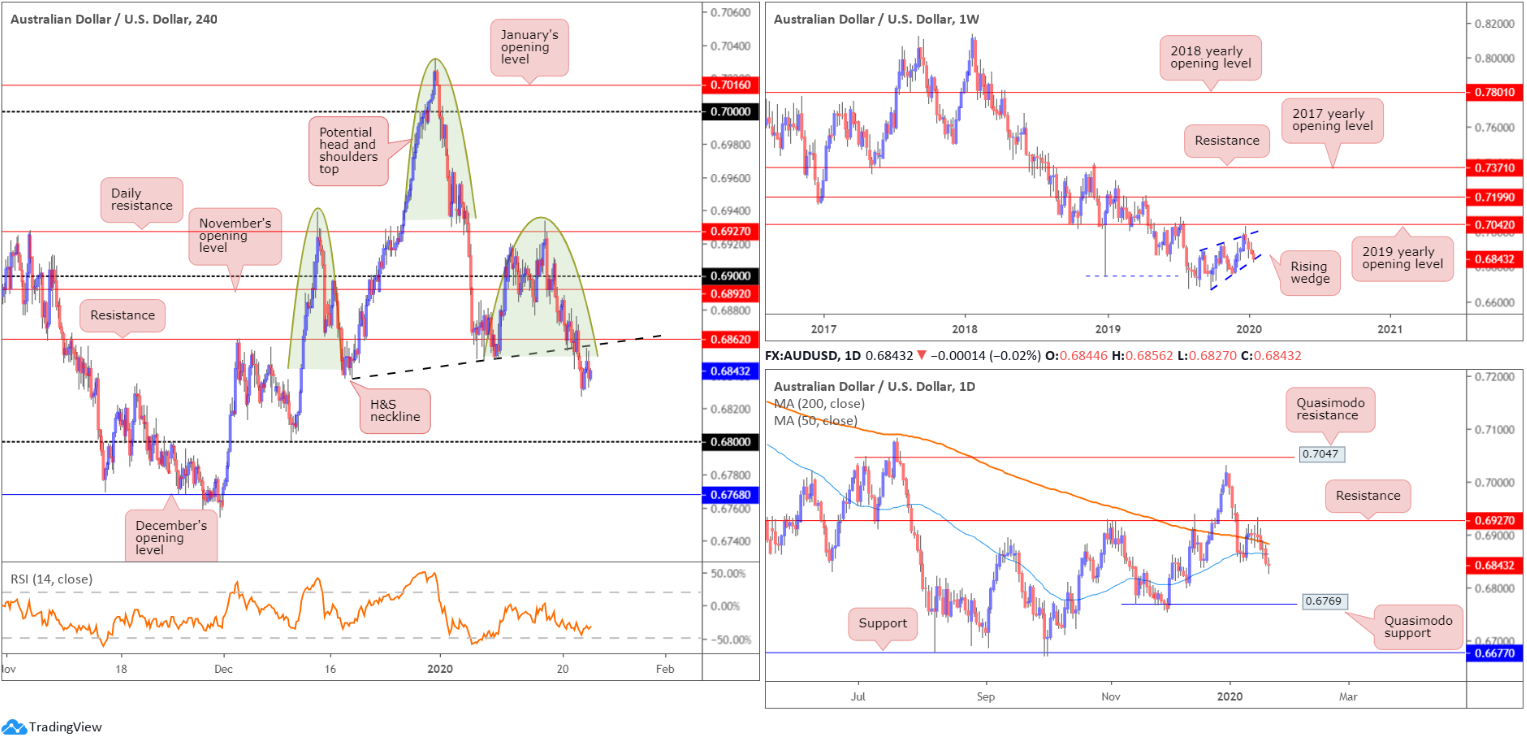
As underlined in Monday’s technical briefing, H4 price has also been chalking up a potential head and shoulders top pattern since mid-December 2019 (left shoulder sports a top at 0.6938, right shoulder at 0.6933 and the head at 0.7031 – green). The neckline is drawn from the 0.6838 December 18 low and the 0.6850 January 9 low (black line). Traditionally, traders wait for a close beneath the neckline to trigger shorts; others, however, may attempt a short at the right shoulder or even at the formation of the head.
As evident from the H4 timeframe, price closed beneath support at 0.6862 (now a serving resistance) and the H&S neckline on Tuesday and remained south of the said levels Wednesday. Although an initial (structure) target can be seen at 0.68, H&S traders will be looking for much lower levels.
On a wider perspective, weekly action, since registering a bottom in late September at 0.6670, has been carving out what appears to be a rising wedge formation, typically considered a continuation pattern. Over the past three weeks, and also so far this week, price declined back into the rising wedge, following a minor whipsaw through the top edge of the said wedge, missing the 2019 yearly opening level at 0.7042 by a mere ten points. With the primary downtrend having been in full force since topping at 0.8135, in early 2018, a break lower beyond the lower edge of the noted wedge formation could be seen. This would trigger weighty sell stops, both from lower-timeframe traders entering long the correction and longer-term traders’ breakout sell orders.
Price action on the daily timeframe is stationed beneath both the 200-day SMA (orange – 0.6883) and 50-day SMA (blue – 0.6864), underscoring a potential move towards Quasimodo support at 0.6769.
Areas of consideration:
Outlook remains unchanged due to lacklustre movement.
An ideal entry scenario, for most conservative H&S traders, would be for a H4 retest at 0.6862 (and the H&S neckline), in the form of a notable H4 bearish candlestick pattern (entry and risk can be determined according to the candlestick’s structure).
In terms of Australian jobs data, expectations are that Australia added 12.2K net jobs in December, a drop from November’s 39.9K. This could send the pair lower, hopefully not before tagging the underside of 0.6862.
USD/JPY:
Determining direction proved troublesome for USD/JPY Wednesday. US equities also finished reasonably flat as did US Treasury yields, though the US dollar index eked out marginal losses, testing 97.50.
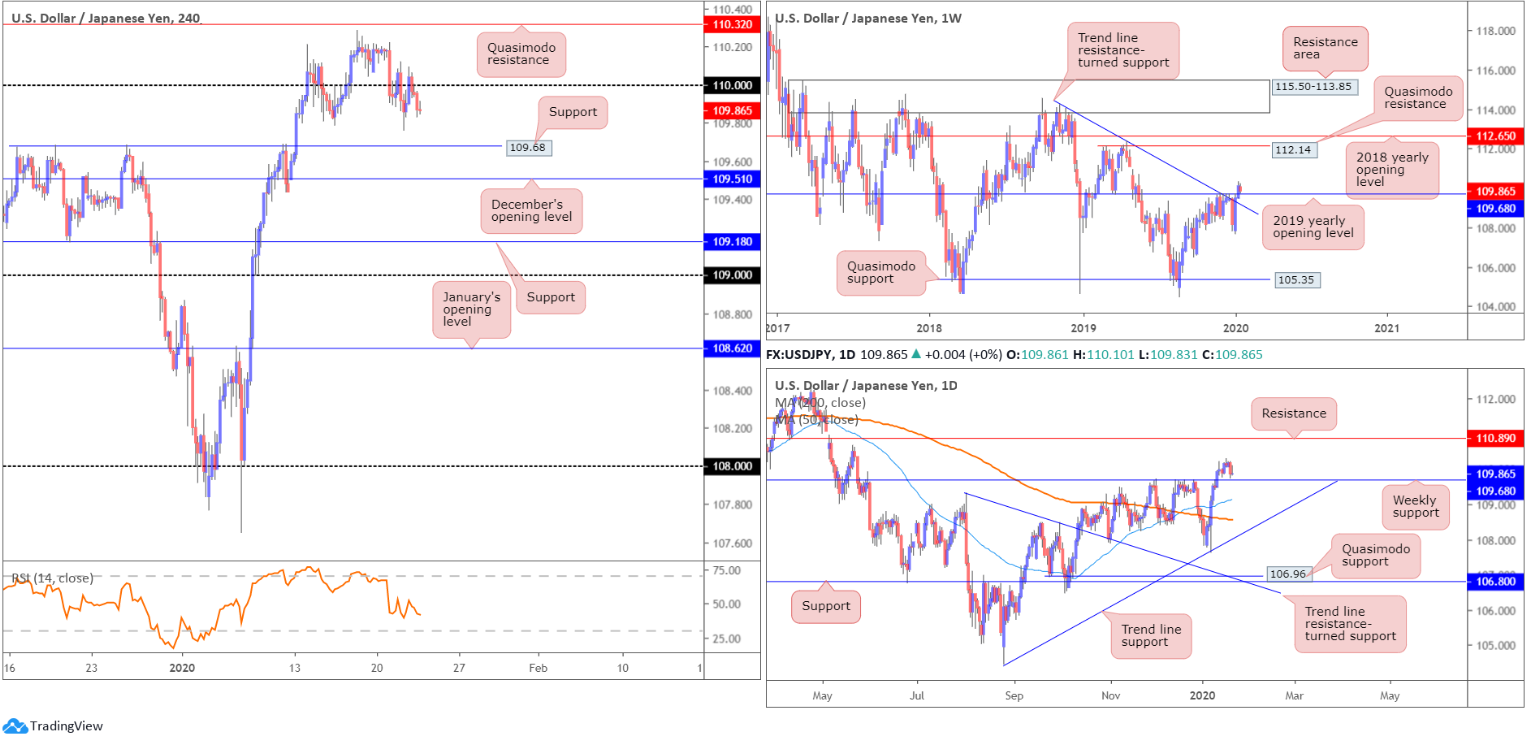
With respect to the H4 timeframe, price action failed to sustain gains above 110 and ended the session closing not too far off prior-day lows at 109.76. Aside from the 109.79 January 15 low, limited support is visible beneath 110 until reaching 109.68, closely followed by December’s opening level at 109.51.
On more of a broader view, weekly resistances, comprised of the 2019 yearly opening level at 109.68 and trend line resistance, extended from the high 114.23, gave way in recent trading, perhaps setting a long-term stage for a run to Quasimodo resistance at 112.14 and the 2018 yearly opening level at 112.65. Prior to further buying, however, the possibility of a retest at 109.68 is certainly there. In terms of market trend, immediate flows point north.
In similar fashion, daily price remains above the recently broken weekly resistance at 109.68. According to the daily timeframe, additional upside is also a possibility, though resistance is seen around the 110.89 region on this scale.
Areas of consideration:
Outlook remains unchanged due to lacklustre movement.
The combined H4 support and weekly support at 109.68 remains in focus today, offering a potential bullish scenario. As for protective stop-loss orders, beneath December’s opening level at 109.51 is an option, though conservative traders will likely want to witness a H4 bullish candlestick formation emerge from 109.68 before pulling the trigger. This not only helps identify buyer intent, it provides entry and risk levels to work with.
The initial take-profit target can be sited around the 110 region.
USD/CAD:
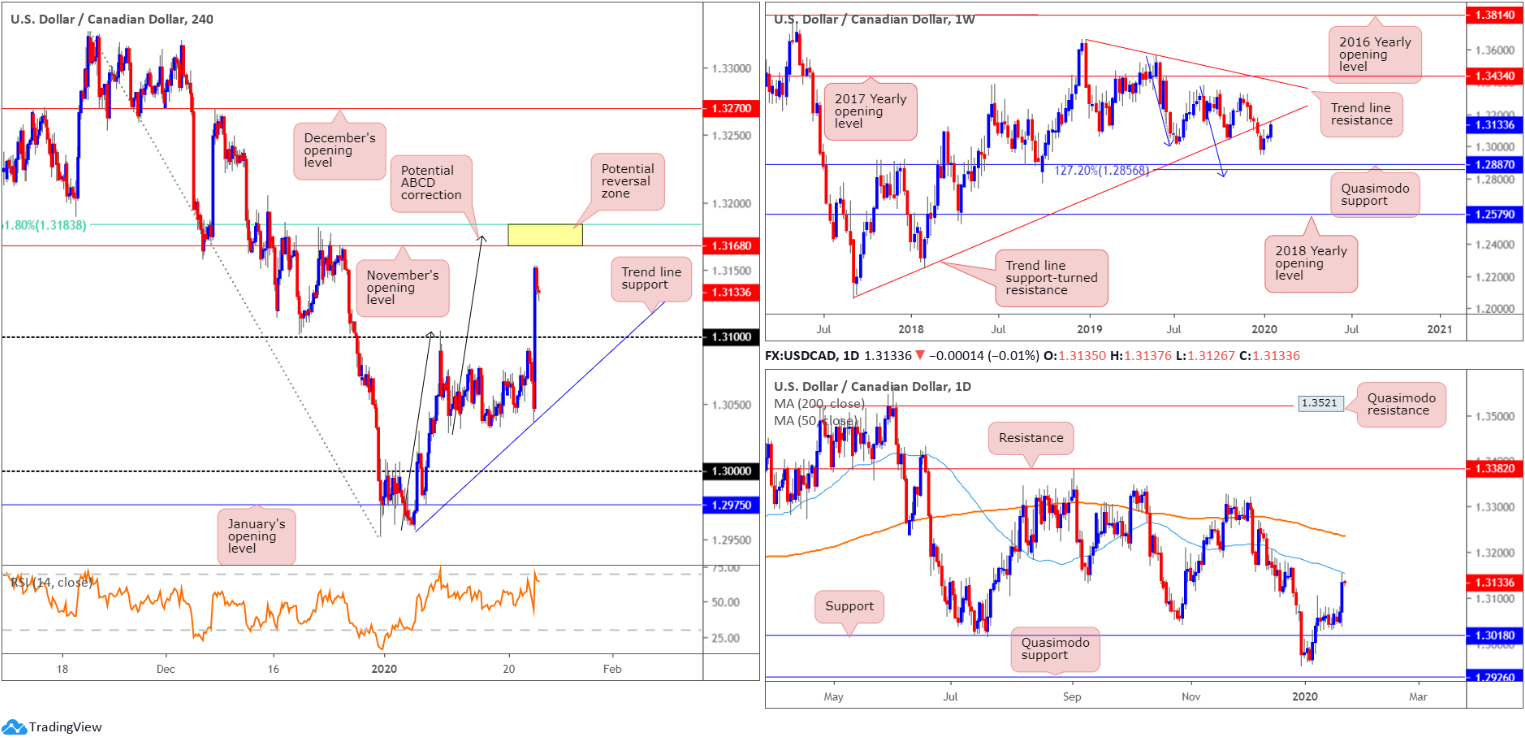
Canada consumer prices were unchanged in December, against an expected rise of 0.1%. The year-over-year rate was at 2.2%, in line with expectations. Excluding gasoline, the CPI rose 2.0%, the smallest gain since November 2018.
The losses in oil markets extended on Wednesday amid supply-glut concerns out of Libya, position unwinding and the ongoing coronavirus epidemic. The Bank of Canada (BoC) also left rates unchanged at 1.75%, as expected, with the Canadian dollar trading lower following a dovish message from the BoC. The RBC highlight:
‘With the economy no longer seen as operating close to full capacity, the bank’s tolerance for sub-trend growth is likely to be limited.’
Dethroning 1.31, USD/CAD traded to highs of 1.3152 Wednesday, before mildly paring gains into the close. H4 structure also has November’s opening level in view as possible resistance at 1.3168, which aligns closely with a potential ABCD (black arrows) correction at 1.3175 and a 61.8% Fibonacci retracement ratio at 1.3183.
Higher-timeframe structure, however, has daily price crossing swords with the 50-day SMA (blue – 1.3153), and weekly movement testing trend line support-turned resistance, extended from the low 1.2061.
Areas of consideration:
With weekly price testing trend line resistance, daily price testing its 50-day SMA and H4 price hovering just south of a reasonably attractive resistance zone between 1.3183/1.3168, a sell from this area, should we test the zone, could be something to consider today, targeting 1.31 as the initial take-profit zone.
As 1.3183/1.3168 is a relatively small zone, some traders may opt to enter on the back of additional candlestick confirmation, in order to avoid being whipsawed out of the trade.
USD/CHF:
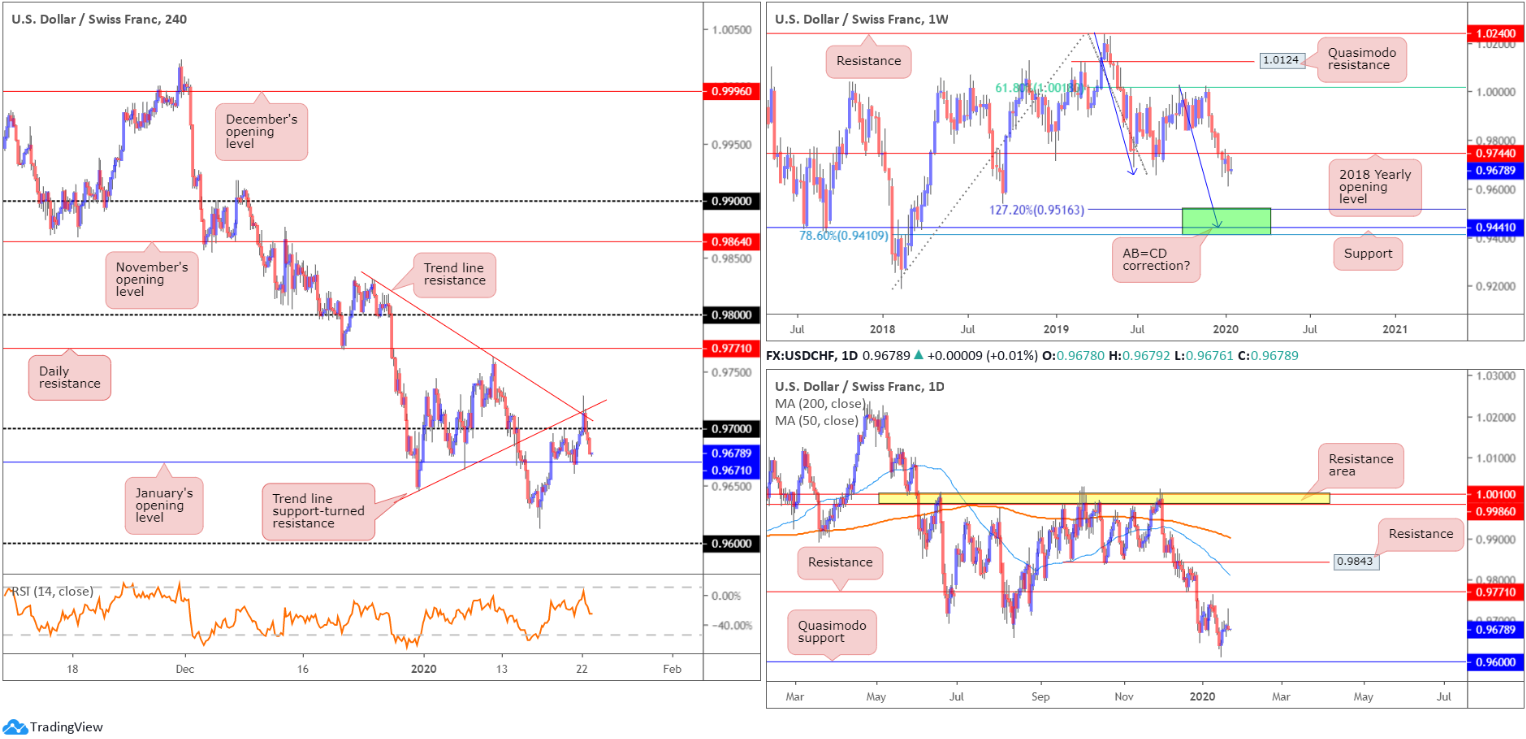
Snapping a four-day winning streak, USD/CHF rotated lower Wednesday after scoring a fresh weekly peak of 0.9729. Technical research based on the H4 timeframe reveals price action met strong supply in the shape of two converging trend line resistances, and proceeded to tunnel through the 0.97 handle and close just north of January’s opening level at 0.9671. Beyond this monthly level, we do not see much stopping the pair from reaching the 0.96 handle.
The situation on the weekly timeframe remains pretty much unchanged:
Following a brief pause, one that snapped a five-week losing streak and retested the underside of the 2018 yearly opening level at 0.9744, USD/CHF reignited its bearish tone last week. Losing more than 45 points and clocking lows of 0.9613, levels not seen since September 2018, the next downside target sits in the range of 0.9410/0.9516 (comprised of a 78.6% Fibonacci retracement at 0.9410, support at 0.9441 and a 127.2% AB=CD bullish correction [black arrows] at 0.9516 – green]).
The story on the daily timeframe has resistance positioned at 0.9771 and support, shaped in the form of a Quasimodo formation at 0.9600. Candlestick traders may also wish to acknowledge yesterday chalked up a striking shooting star pattern, considered a bearish signal at peaks.
Areas of consideration:
Having seen 0.9671 hold as support recently, interested sellers in this market are likely looking for a H4 close to form beneath this level today. A H4 close south of 0.9671, preferably followed up with a retest by way of a H4 bearish candle formation, is likely enough to draw further selling towards the 0.9613 January 16 low, closely shadowed by the 0.96 handle (also represents daily Quasimodo support).
Dow Jones Industrial Average:
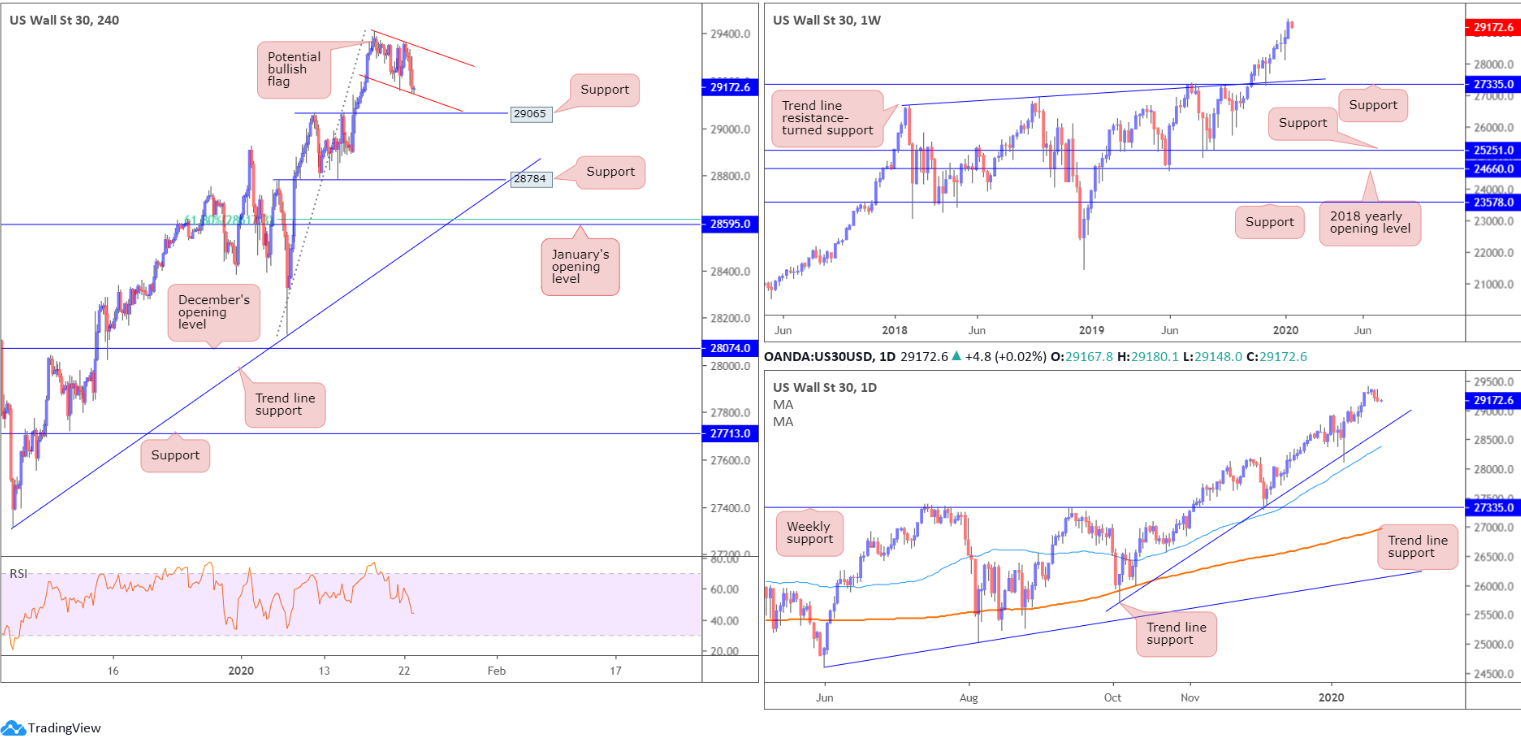
US equities finished reasonably steady Wednesday, buoyed on news Chinese authorities are taking steps to contain a possible coronavirus pandemic. The Dow Jones Industrial Average lost 9.77 points, or 0.03%; the S&P 500 added 0.96 points, or 0.03% and the tech-heavy Nasdaq 100 ended higher by 21.95 points, or 0.24%.
Technical movement on the H4 timeframe shows price to be compressing within two parallel descending lines (29409/29163), a potential bullish flag pattern. Also worthy of note is nearby support coming in at 29065, followed by another layer of support priced in at 28784 and trend line support, extended from the low 27314.
Higher-timeframe technical structure remains unchanged:
Following a weekly hammer candlestick pattern (considered a buy signal at troughs), formed seven weeks back at the retest of weekly support drawn from 27335, along with trend line support etched from the high 26670, the index has continued to advance higher since, testing fresh record peaks of 29409 last week.
Daily trend line support, extended from the low 25710, remains in motion, bolstered by additional support from the 50-day SMA (blue – 28381). Candlestick traders may also wish to acknowledge last Friday printed a near-perfect ‘gravestone doji’ at all-time highs of 29409, typically considered a bearish signal, which has held ground thus far.
Areas of consideration:
With the primary uptrend remaining strong, and daily price trading north of trend line support, traders, seeking a buy-the-dip scenario to join this seemingly everlasting trend, likely have eyes on a retest at H4 support drawn from 29065.
A H4 close out of the current H4 bull flag pattern not only confirms longs off 29065, it will likely prompt additional buying.
XAU/USD (GOLD):
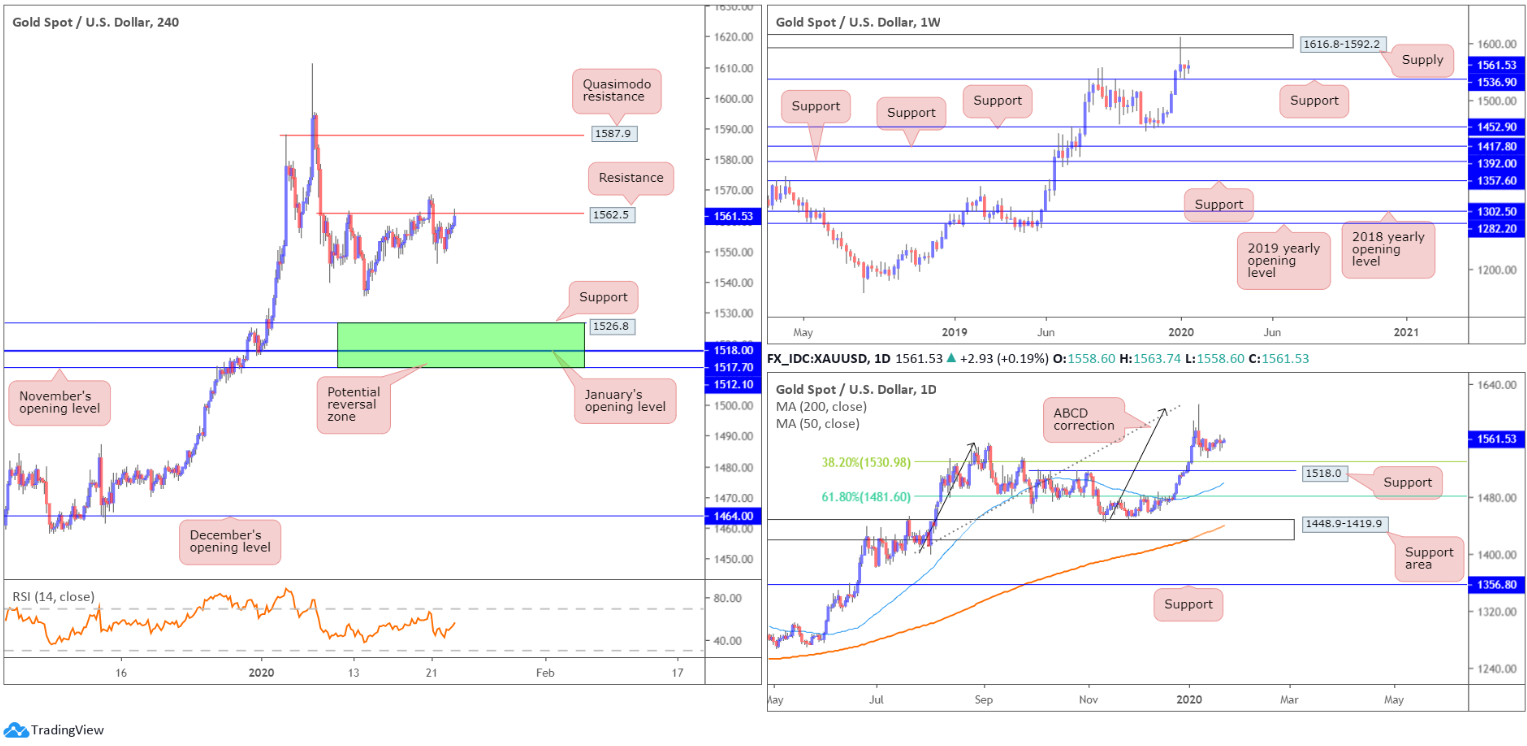
Outlook remains unchanged due to lacklustre movement since early January.
Since early January, H4 price has been capped beneath resistance at 1562.5. Tuesday witnessed a reasonably notable fakeout take shape, though lacked oomph to continue higher. As evident from the chart this morning, price is shaking hands with the said resistance once again. This – coupled with the earlier fakeout in the week – suggests further buying may be on the cards.
A move lower from 1562.5 may see the 1536.1 January 14 low make an appearance, followed by an area of support (green) between November’s opening level at 1512.1 and support at 1526.8 (daily support at 1518.0 and January’s opening level at 1517.7 seen within). A move north of H4 resistance at 1562.5, on the other hand, unlocks the door to potential bullish themes, targeting H4 Quasimodo resistance at 1587.9, closely shadowed by the lower edge of weekly supply at 1592.2.
Weekly price is seen recovering from support at 1536.9, following a dominant rejection out of the said supply at 1616.8-1592.2. A violation of the said support could prompt selling towards additional layers of support at 1452.9, 1417.8, 1392.0 and 1357.6.
Although we seem to be entering into a bottoming phase on the daily timeframe, it’s still worth bearing in mind the 38.2% Fibonacci retracement at 1530.9 as support, closely followed by 1518.0. The former offers an initial take-profit target for traders short the ABCD bearish correction (black arrows) at 1608.0.
Areas of consideration:
Should a selloff occur, 1512.1/1526.8 on the H4 timeframe is a zone worth watching for signs of buyer intent. Not only does it boast a strong mix of confluence, the support area forms in line with the primary trend.
Continued buying, along with a H4 close north of H4 resistance at 1562.5, is likely of interest to many in this market. Breakout traders will likely enter on the close of the breakout candle, and position stops beneath its respective low (lower candle shadow). The more conservative approach, though, entails waiting for a retest at 1562.5 (following the breakout) to occur and entering based on the rejection candle’s framework, either at market or using a buy stop entry.
The accuracy, completeness and timeliness of the information contained on this site cannot be guaranteed. IC Markets does not warranty, guarantee or make any representations, or assume any liability regarding financial results based on the use of the information in the site.
News, views, opinions, recommendations and other information obtained from sources outside of www.icmarkets.com.au, used in this site are believed to be reliable, but we cannot guarantee their accuracy or completeness. All such information is subject to change at any time without notice. IC Markets assumes no responsibility for the content of any linked site.
The fact that such links may exist does not indicate approval or endorsement of any material contained on any linked site. IC Markets is not liable for any harm caused by the transmission, through accessing the services or information on this site, of a computer virus, or other computer code or programming device that might be used to access, delete, damage, disable, disrupt or otherwise impede in any manner, the operation of the site or of any user’s software, hardware, data or property.


