
A note on lower timeframe confirming price action…
Waiting for lower timeframe confirmation is our main tool to confirm strength within higher timeframe zones, andhas really been the key to our trading success. It takes a little time to understand the subtle nuances, however, as each trade is never the same, but once you master the rhythm so to speak, you will be saved from countless unnecessary losing trades. The following is a list of what we look for:
- A break/retest of supply or demand dependent on which way you’re trading.
- A trendline break/retest.
- Buying/selling tails – essentially we look for a cluster of very obvious spikes off of lower timeframe support and resistance levels within the higher timeframe zone.
- Candlestick patterns. We tend to only stick with pin bars and engulfing bars as these have proven to be the most effective.
EUR/USD:
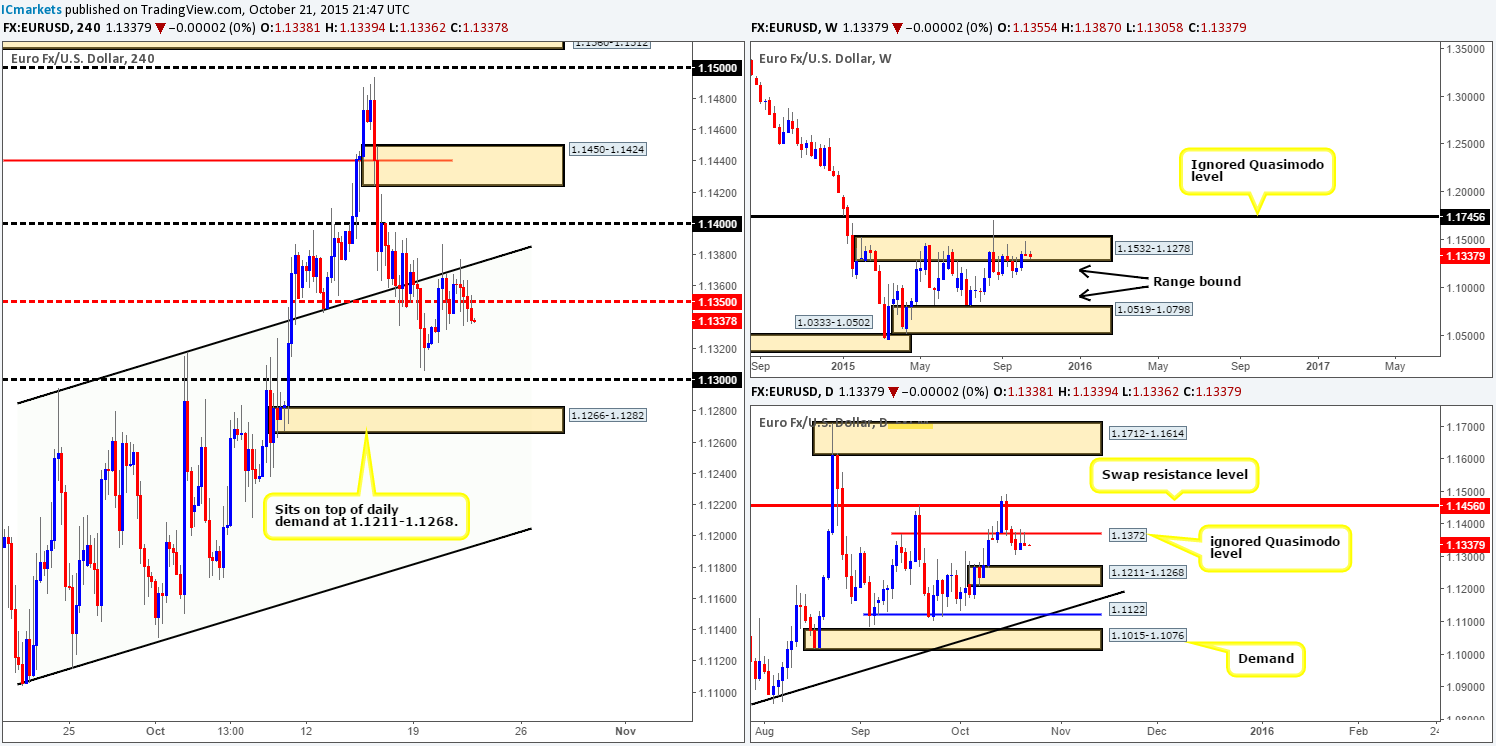
Throughout the course of yesterday’s sessions, the EUR, once again, tested the underside of the upward channel resistance (1.1104/1.1294), before sluggishly descending south and breaking below mid-level support 1.1350. Technically, the overall structure of this pair remains pretty much the same as yesterday. As such, much of the following analysis will be similar to the previous.
On the assumption that mid-level support-turned resistance 1.1350 holds firm today, we will consider a short around this region if lower timeframe confirmation is seen. Targets for this trade come in at psychological support 1.1300, followed closely by demand at 1.1266-1.1282 (positioned on top of daily demand at 1.1211-1.1268). Our reasoning for believing the 1.1350 area is a potential sell zone lies within the higher timeframe structure. Price remains loitering within supply on the weekly timeframe at 1.1532-1.1278, and a second consecutive pin wick has been seen stabbing the underside of an ignored Quasimodo barrier on the daily timeframe at 1.1372.
Levels to watch/live orders:
- Buys: Flat (Stop loss: N/A).
- Sells:1.1350 region [Tentative – confirmation required] (Stop loss: dependent on where one confirms this level).
GBP/USD:
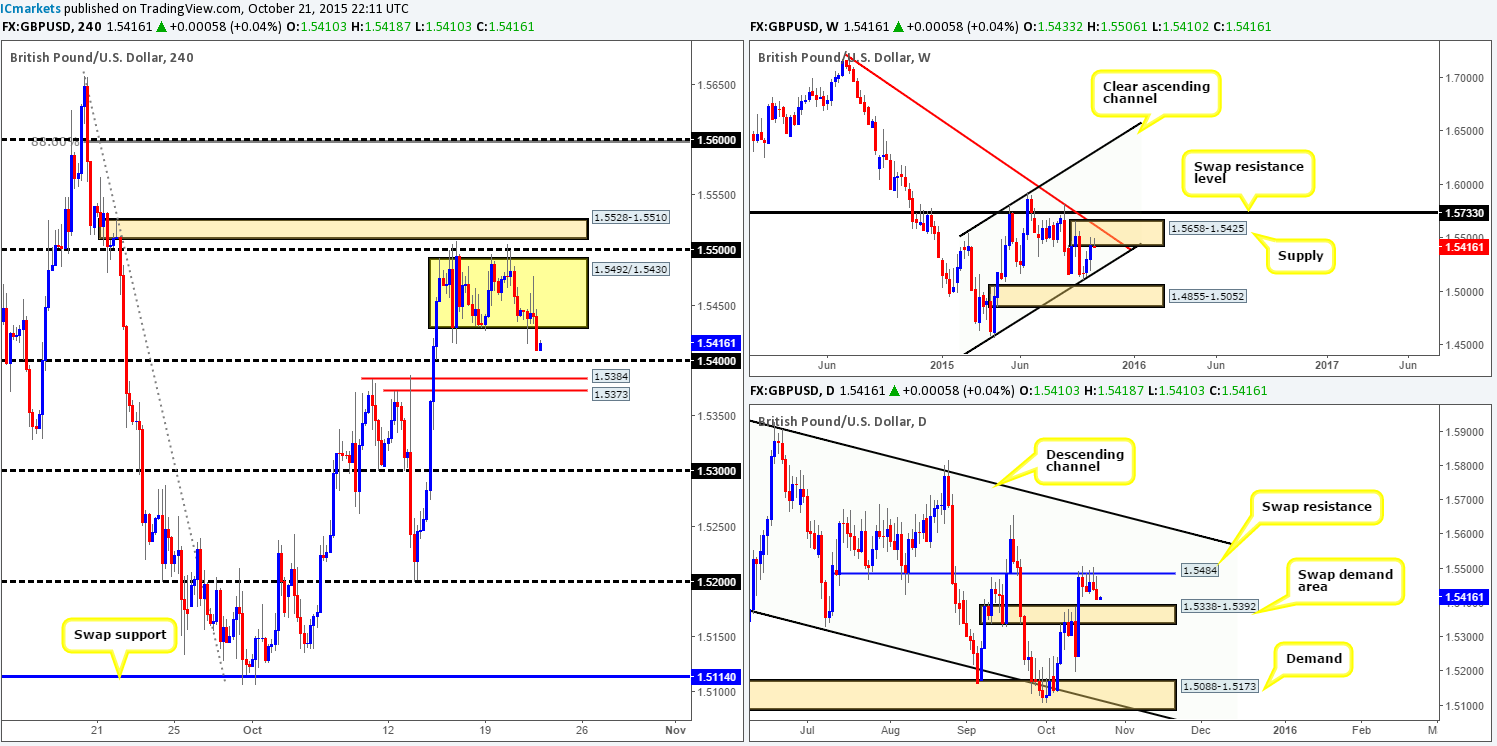
Kicking off our analysis this morning with a look at the weekly timeframe shows price is currently responding to the underside of supply right now at 1.5658-1.5425. The next downside target to keep an eye on from here is seen at channel support extended from the low 1.4564. Turning our attention to the daily timeframe, however, reveals that price has seen further selling from the swap resistance barrier at 1.5484. Despite this, there is a swap demand area located just below drawn from 1.5338-1.5392, which, if you ask us, has the potential to put a halt on any further selling.
Looking at the 4hr timeframe, we can see price only just recently closed below range support 1.5430. This – coupled with the points made above makes this a very tricky pair to read right now due to the following:
- Selling this market on the basis of the close below the 4hr range support and the recent reaction from weekly supply is difficult. Price faces almost immediate support from not only the 1.5400 figure, but also two closely-knit swap support levels at 1.5384/1.5373 just below (surrounded by a daily swap demand barrier at 1.5338-1.5392).Until the above said levels are consumed, we would not feel comfortable shorting this pair.
- Buying this market on the other hand from the 4hr supports just mentionedabove is also, in our opinion, just as problematic. For one, you’d be buying into potential weekly momentum from supply. And two, there is not much space for price to move into profit as the underside of 1.5430 is now acting resistance. Therefore, unless one finds a setup that allows a really tight stop from either of the above 4hr supports, the risk/reward would likely be unfavorable.
Taking the above into consideration, opting to stand on the sidelines here may very well be the best path to take today.
Levels to watch/ live orders:
- Buys: Flat (Stop loss: N/A).
- Sells: Flat (Stop loss: N/A).
AUD/USD:
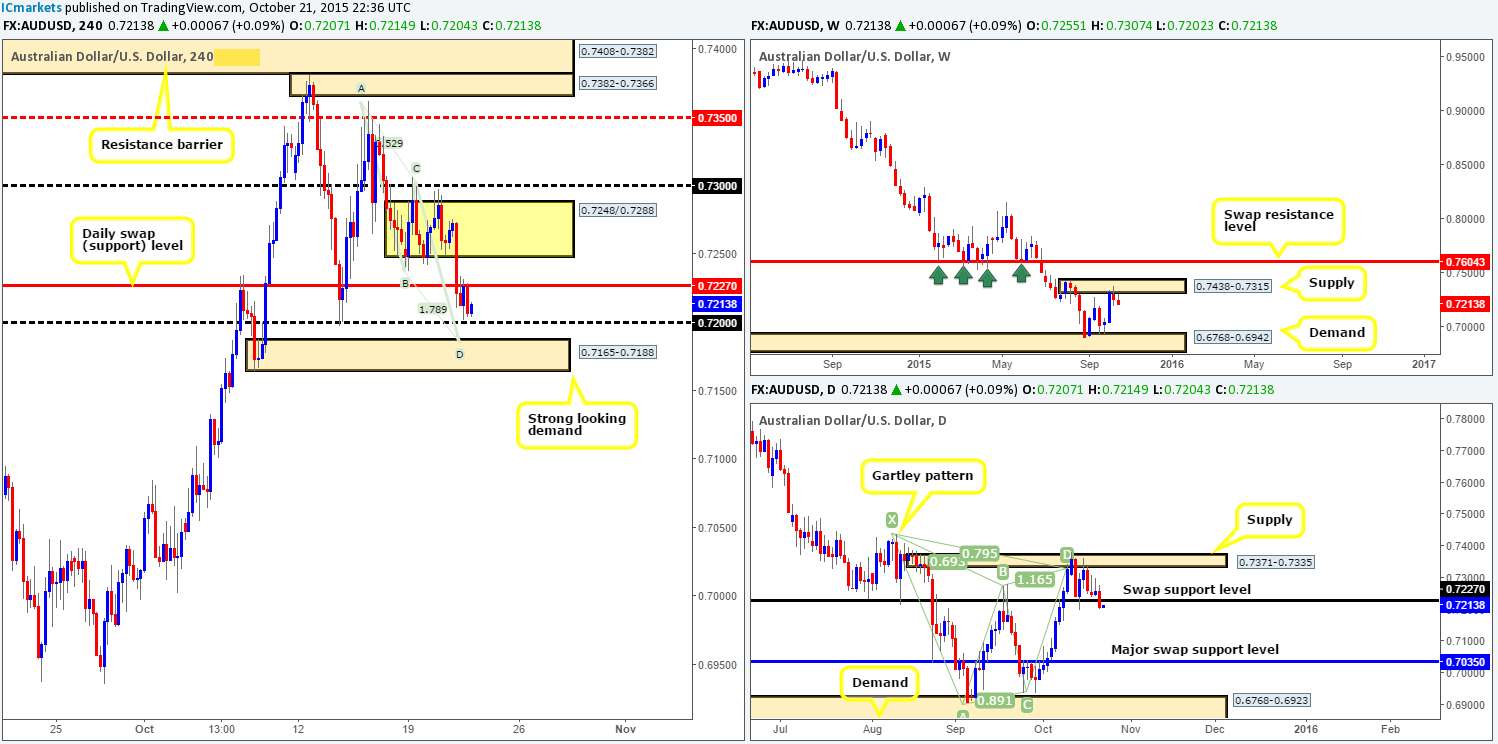
During the early hours of yesterday’s trade the AUD/USD fell sharply, consequently closing below a daily swap (support) barrier at 0.7227.Following this, price consolidated for the remainder of the day between the underside of this daily level and psychological support 0.7200.
Just looking at the 4hr chart for the time being, we can see price is trading near to a nice-looking demand zone coming in at 0.7165-0.7188. This area not only has strong momentum seen from the base, but also converges beautifully with an AB=CD bull pattern completing at 0.7184.
Looking to buy from this demand zone may very well be inviting due to its converging Harmonic structure, but we still remain wary. The reason for why comes from price trading beneath weekly supply at 0.7438-0.7315, and also daily action closing below a swap support at 0.7227 yesterday. Now, this is not to say that this 4hr demand area will not bounce price as it probably will, but, personally, we do not expect anything more than a short-term intraday move back up to the aforementioned daily level from here.
In the event that price closes below this 4hr demand, however, our team will then shift into short mode. Reason being is on the weekly we see room to move down to demand at 0.6768-0.6942, and on the daily the path also appears clear down to a major swap support at 0.7035.
Levels to watch/ live orders:
- Buys:0.7165-0.7188 [Tentative – confirmation required] (Stop loss: dependent on where one confirms this area).
- Sells: Flat (Stop loss: N/A).
USD/JPY:
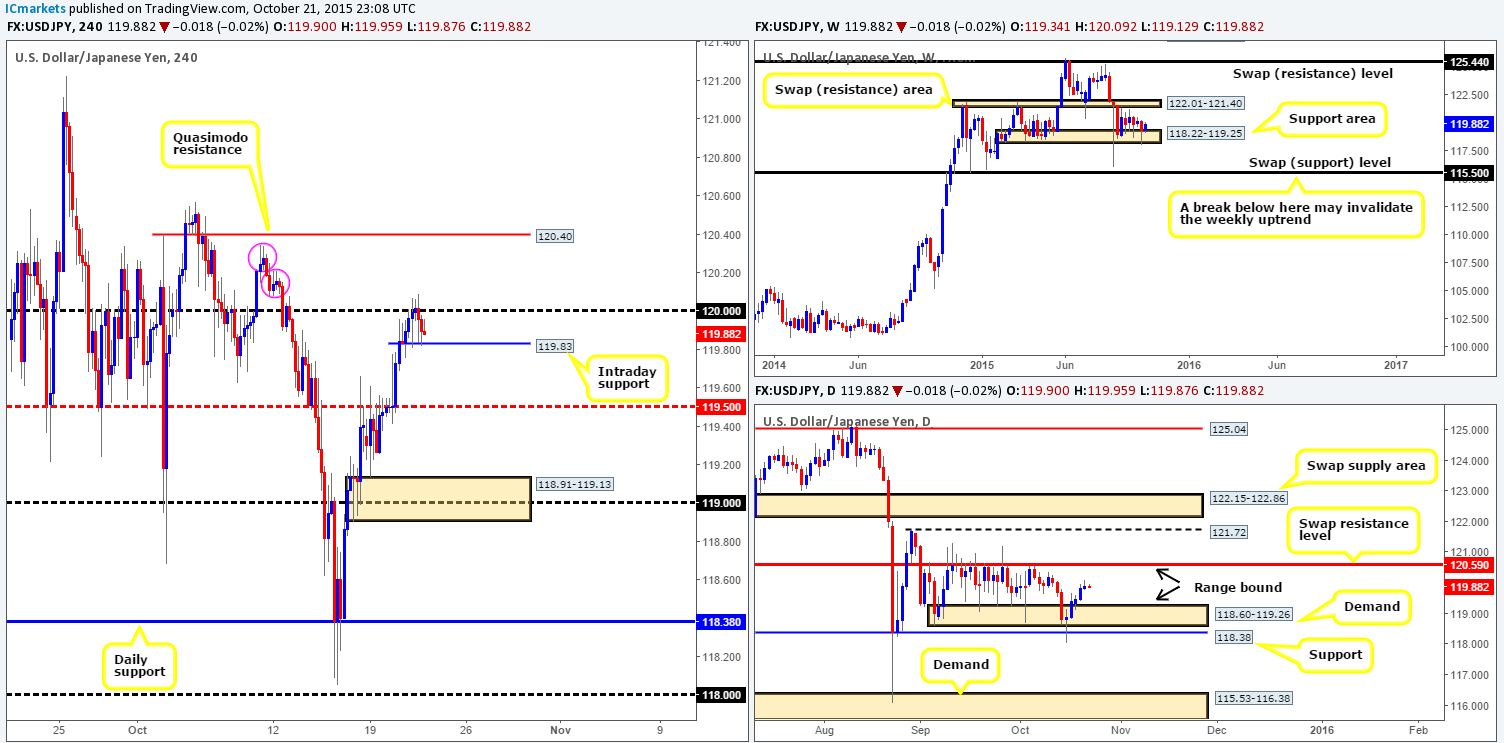
The USD/JPY put in a lackluster performance amid yesterday’s trade which barely saw this pair move thirty pips! Despite this, offers at psychological resistance 1.20 were hit and that drove price to lows of 119.83 on the day. As we write, the buyers and sellers are seen battling for position between these two numbers. A breakdown below 119.83 could prompt a downside move to mid-level support 119.50. Conversely, a close above 120.00 has the potential to push prices up to Quasimodo resistance 120.40. The reasons for ignoring the supplies marked with pink circles at 120.20-120.11/120.34-120.24 are due to the following:
- The supplies appear minor areas to us. The Quasimodo level at 120.40 above these zones is located nearer to a more significant high at 120.56 in our opinion.
- The Quasimodo lurks only nineteen pips beneath range resistance on the daily scale at 120.59.
- And finally, weekly action shows price is currently rebounding from weekly range support drawn from 118.22-119.25. Therefore, minor supplies like the ones we just mentioned above will not likely stand much chance of holding.
So, should price break below 119.83 today, we will not be shorting this market due to point three. A cut through 120.00 on the other hand will, in effect, be our cue to begin watching for price to retest this number as support. Assuming this is seen along with lower timeframe buying confirmation, we’ll look to enter long, targeting the aforementioned 4hr Quasimodo resistance level. If this occurs, we’ll then switch from longs and begin looking to short this market should lower timeframe resistances hold firm.
Levels to watch/ live orders:
- Buys:Watch for offers to be consumed around 120.00 and then look to enter on any retest seen at this level (confirmation required).
- Sells: 120.40 [Tentative – confirmation required (stop loss: dependent on where one confirms this level since a fakeout above this barrier to range resistance at 120.59 could be seen).
USD/CAD:
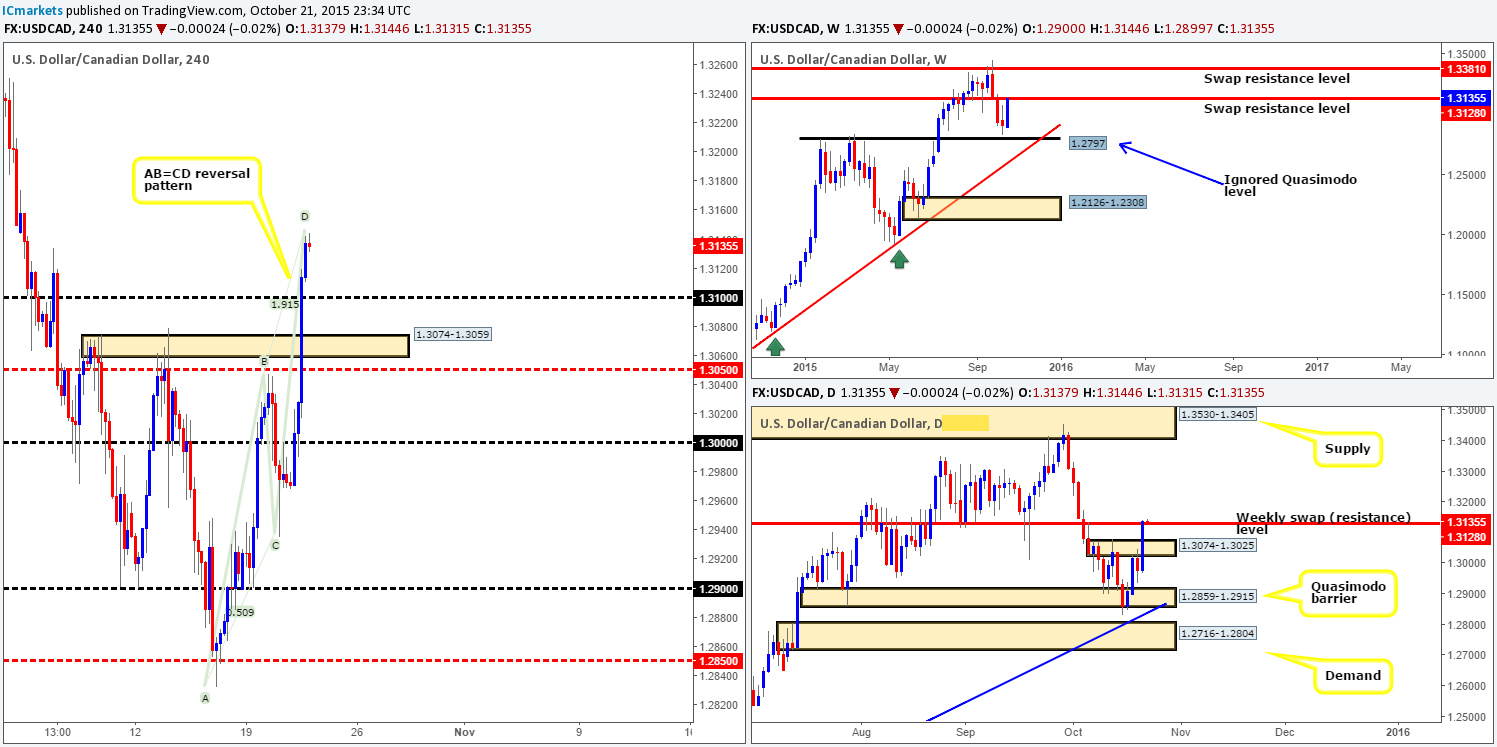
Upon opening the 4hr chart of the USD/CAD this morning, we were greeted with a sea of bull candles.The Bank of Canada held the overnight rate at 0.5 per cent, consequently sending this pair around160 pips higher. This rally took out several technical barriers and also formed a nice-looking AB=CD bearish setup completing at 1.3146. This – coupled with the higher timeframe structure trading around a weekly swap (resistance) level at 1.3128 right now, makes this AB=CD top a lovely area to look for shorts.
In fact, we’re relatively confident a bounce from here will be seen down to at least psychological support 1.3100 today, we have entered into a marketable short at 1.3135. Should price hit 1.3100, we’ll take 50% of our position off and then reassess lower timeframe price action to see if it is worth holding this position down to swap demand at 1.3074-1.3059.
Levels to watch/ live orders:
- Buys:Flat (Stop loss: N/A).
- Sells:1.3135 [LIVE] (Stop loss: 1.3149).
USD/CHF:
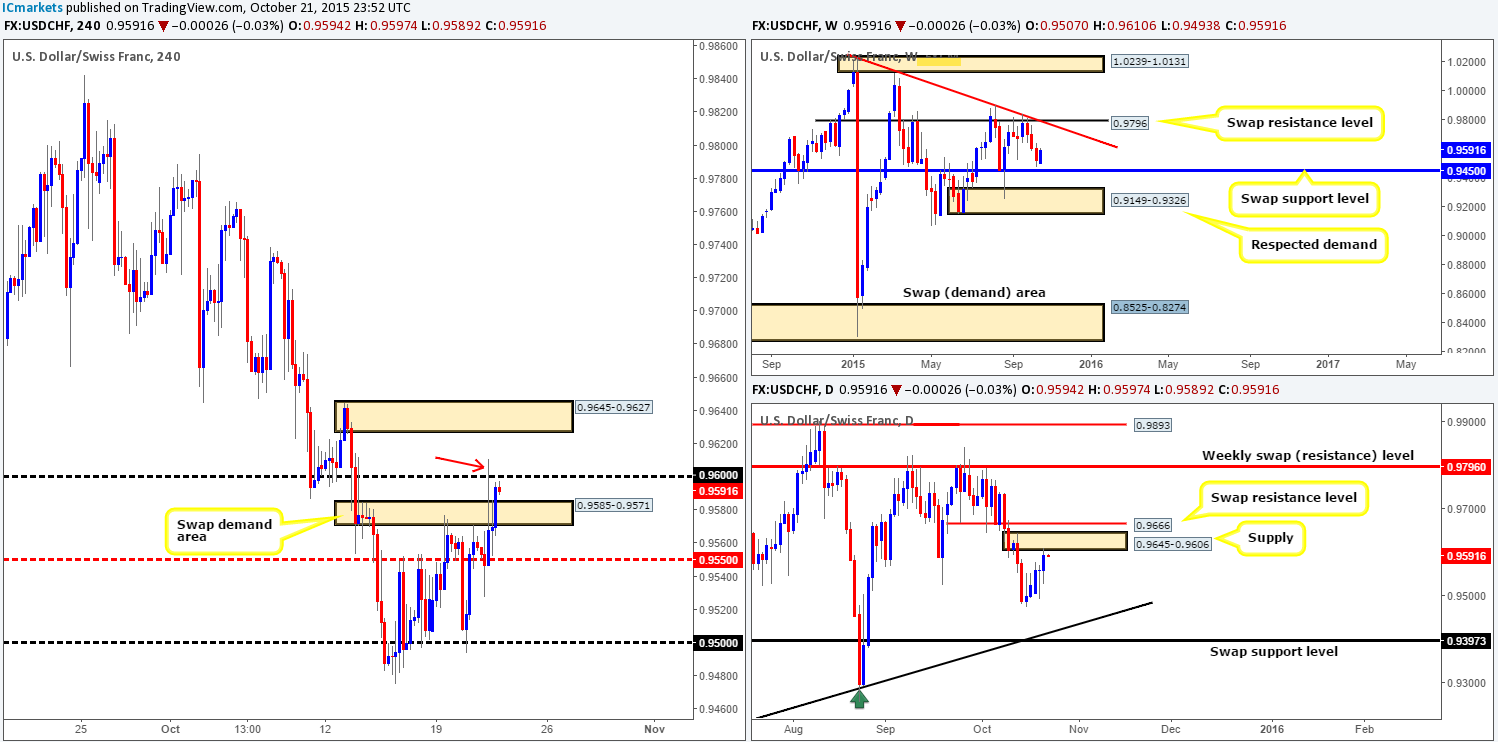
Beginning with a look at the weekly timeframe this morning shows further buying is being seen from just above a swap support level at 0.9450. Should this continue, the next upside target to keep an eye on comes in around trendline resistance taken from the high 1.0239. Meanwhile, down on the daily timeframe, price is currently touching gloves with a supply zone drawn from 0.9645-0.9606.
Turning our attention to the 4hr timeframe, we can see price is lurking just below psychological resistance 0.9600 at the moment. The wick marked with a red arrow at 0.9610 likely did a good job of clearing out a ton of offers around this number, thus potentially opening the gates for a further drive north today up to fresh supply coming in at 0.9645-0.9627. Should our analysis be correct and price connects with this area, we may, dependent on how the lower timeframes respond here, take a short. The reason for requiring confirmation even though this zone sits deep within the above said daily supply simply comes down to the recent bullish interest being seen on the weekly timeframe (see above). Getting caught on the wrong side of weekly flow will do very little for one’s account!
Levels to watch/ live orders:
- Buys: Flat (Stop loss: N/A).
- Sells:0.9645-0.9627 [Tentative – confirmation required] (Stop loss: dependent on where one confirms this area).
DOW 30:
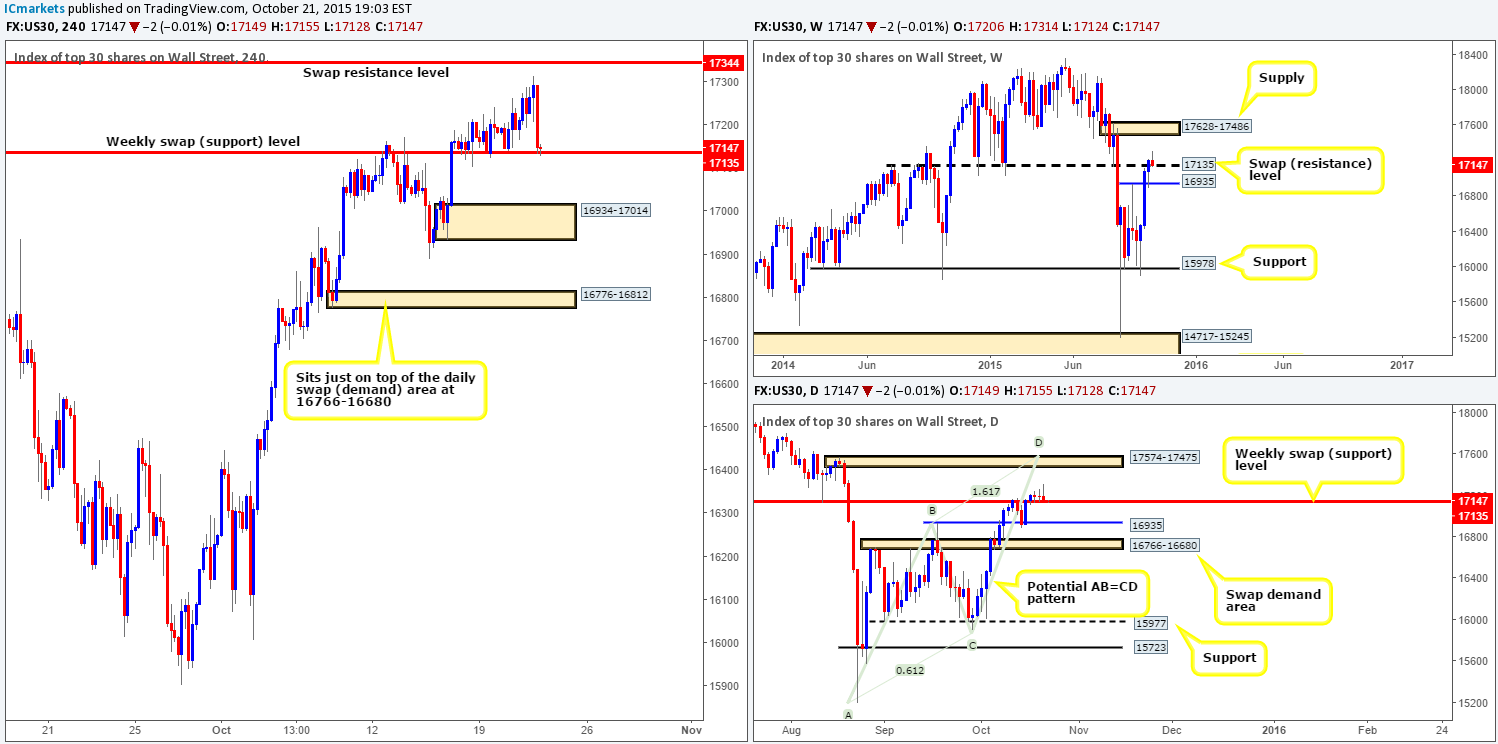
In our previous report (http://www.icmarkets.com/blog/wednesday-21st-october-daily-technical-outlook-and-review/), we mentioned that we took a long from 17153 with a stop placed below Friday’s 4hr low (17104) at 17101. Furthermore, we went on to say that our plan of attack regarding this trade is to ‘set-and-forget’ at least until price either reaches our first take-profit level at 17344, or stops us out for a loss.
As can be seen from the 4hr chart, the DOW reached highs of 17314 during trade yesterday. Once price was trading around the 17250 mark we felt comfortable enough to move our stop to breakeven, which, as you can see, has now been filled.
With market action once again trading on top of the weekly swap (resistance) level at 17135, where do we go from here? Well, seeing as there is still room to move higher on both the weekly and daily charts right now (Weekly target: 17628-17486/Daily target: 17574-17475), we see little reason not to look for confirmed longs again here today.
Levels to watch/ live orders:
- Buys: 17153 [Tentative- confirmation required] (Stop loss: dependent on where one confirms this level).
- Sells:Flat (Stop loss: N/A).
XAU/USD: (Gold)
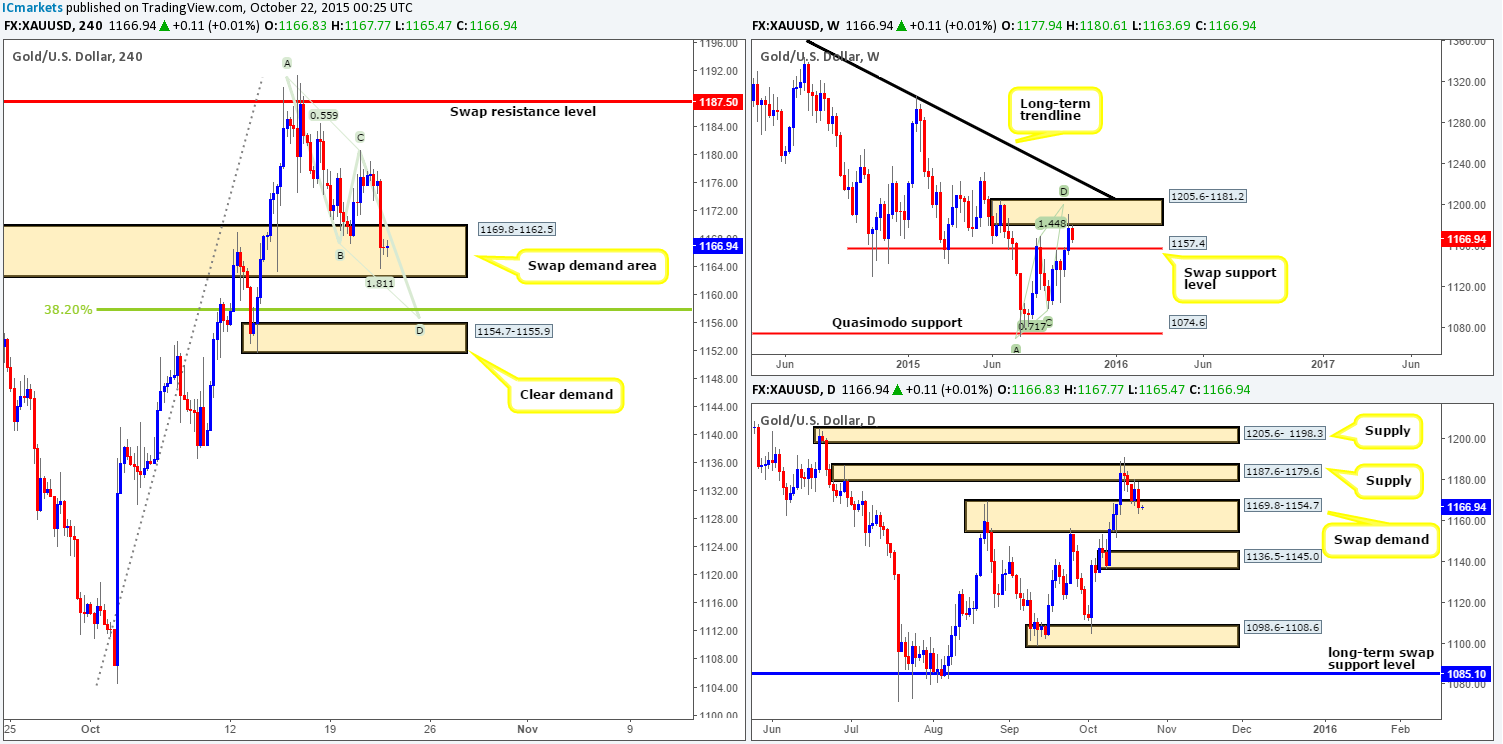
Beginning with the weekly timeframe this morning, we can see that Gold is selling-off from supply taken from 1205.6-1181.2. If this bearish momentum continues, it is likely price will shake hands with swap support coming in at 1157.4. However, scrolling down one lower, daily action shows us that price is now lodged within a swap demand base drawn from 1169.8-1154.7.
Turning our attention to the 4hr timeframe, reveals that Gold took a turn for the worst yesterday going into the American open, thus invalidating our previous AB=CD bearish pattern (see here: http://www.icmarkets.com/blog/wednesday-21st-october-daily-technical-outlook-and-review/) and driving deep into a swap demand area at 1169.8-1162.5.
Taking the above into consideration, our team has absolutely no interest in entering long from current prices. Where we are interested in buying from today, however, is the demand situated just below at 1154.7-1155.9. Here’s why:
- Strong-looking 4hr demand.
- AB=CD bullish pattern completes just above it at 1156.4.
- 38.2% Fibonacci support also seen just above 4hr zone at 1158.0.
- Located deep within the daily swap (demand) base at 1169.8-1154.7.
- Positioned just below the weekly swap (support) level at 1157.4.
Given these five points, our team has come to a general consensus that placing a pending order just above the aforementioned 4hr demand area at 1156.5 is certainly worth the risk!
Levels to watch/ live orders:
- Buys: 1156.5 (Stop loss: 1149.5).
- Sells:Flat (Stop loss: N/A).


