
A note on lower timeframe confirming price action…
Waiting for lower timeframe confirmation is our main tool to confirm strength within higher timeframe zones, and has really been the key to our trading success. It takes a little time to understand the subtle nuances, however, as each trade is never the same, but once you master the rhythm so to speak, you will be saved from countless unnecessary losing trades. The following is a list of what we look for:
- A break/retest of supply or demand dependent on which way you’re trading.
- A trendline break/retest.
- Buying/selling tails/wicks – essentially we look for a cluster of very obvious spikes off of lower timeframe support and resistance levels within the higher timeframe zone.
- Candlestick patterns. We tend to only stick with pin bars and engulfing bars as these have proven to be the most effective.
For us, lower timeframe confirmation starts on the M15 and finishes up on the H1, since most of our higher timeframe areas begin with the H4. Stops usually placed 5-10 pips beyond your confirming structures.
EUR/USD:
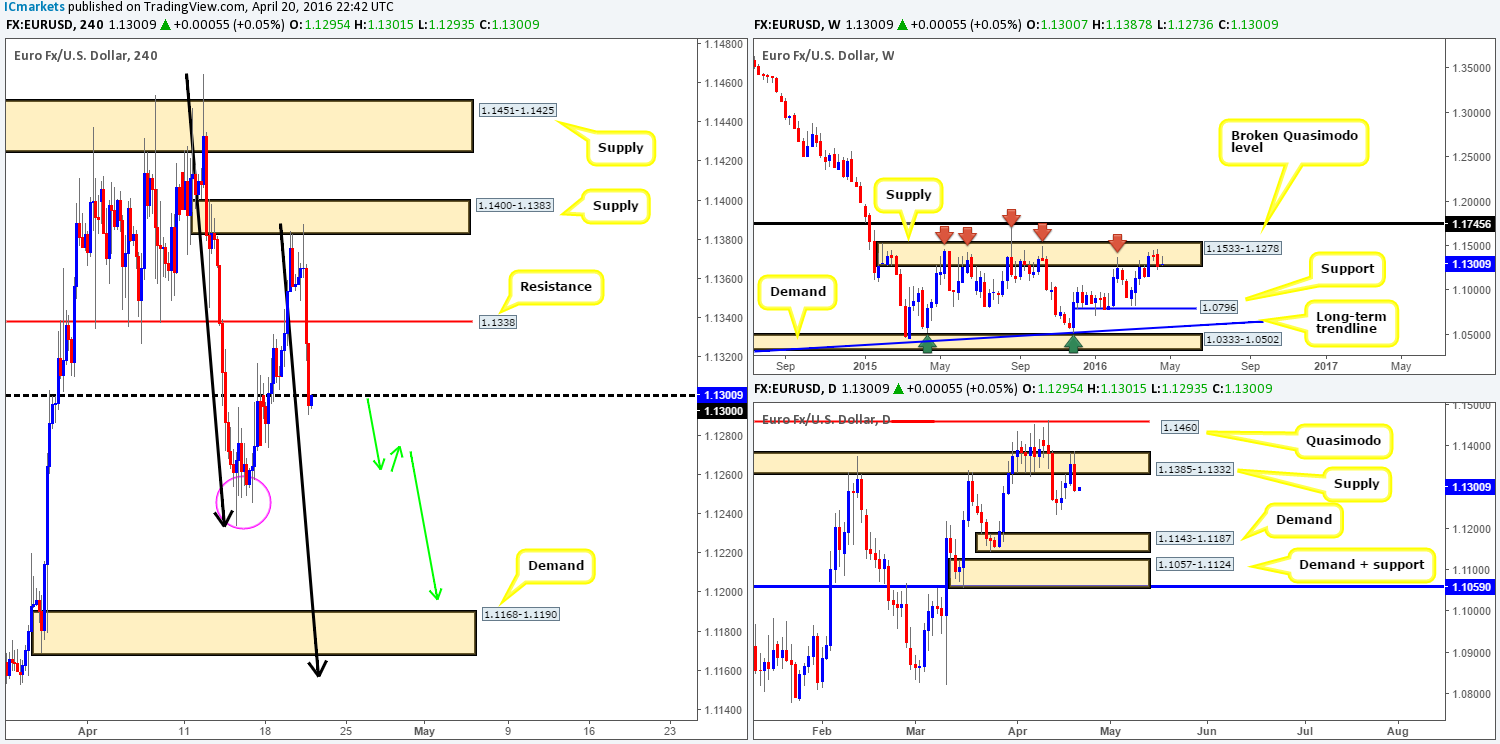
The EUR/USD pair cascaded lower from H4 supply at 1.1400-1.1383 during the course of yesterday’s sessions. Price engulfed H4 support at 1.1338 (now acting resistance) and went on to close below psychological support 1.1300 by the day’s end. Given that price is currently trading from both a major weekly supply zone at 1.1533-1.1278, and with the daily action seen holding ground amid supply at 1.1385-1.1332, yesterday’s sell-off should not come as much of a surprise from a technical standpoint.
Considering the higher-timeframe picture (see above) and that price is now lodged beneath 1.1300, we feel the single currency could make a try for at least the 1.1248 lows made on 14/15th April today (pink circle). For all that though, in order for us to be permitted a short trade here, we’d need to see the lower timeframes confirm 1.1300 before risking capital at this line. What we mean by confirm here is simply one of the following: a break/retest of demand, a trendline break/retest or simply a collection of selling wicks around some form of lower-timeframe resistance.
Assuming that this trade comes to fruition and price hits its first target; we’d then be looking down to the H4 demand drawn from 1.1168-1.1190 as our final destination (sits on top of daily demand coming in at 1.1143-1.1187), which would essentially complete a nice-looking 1:1 move (see black arrows).
Levels to watch/live orders:
- Buys: Flat (Stop loss: N/A).
- Sells: 1.1300 region [Tentative – confirmation required] (Stop loss: dependent on where one confirms this area).
GBP/USD:
(Trade update: Stopped out at breakeven – please review the previous report for details [see link below])
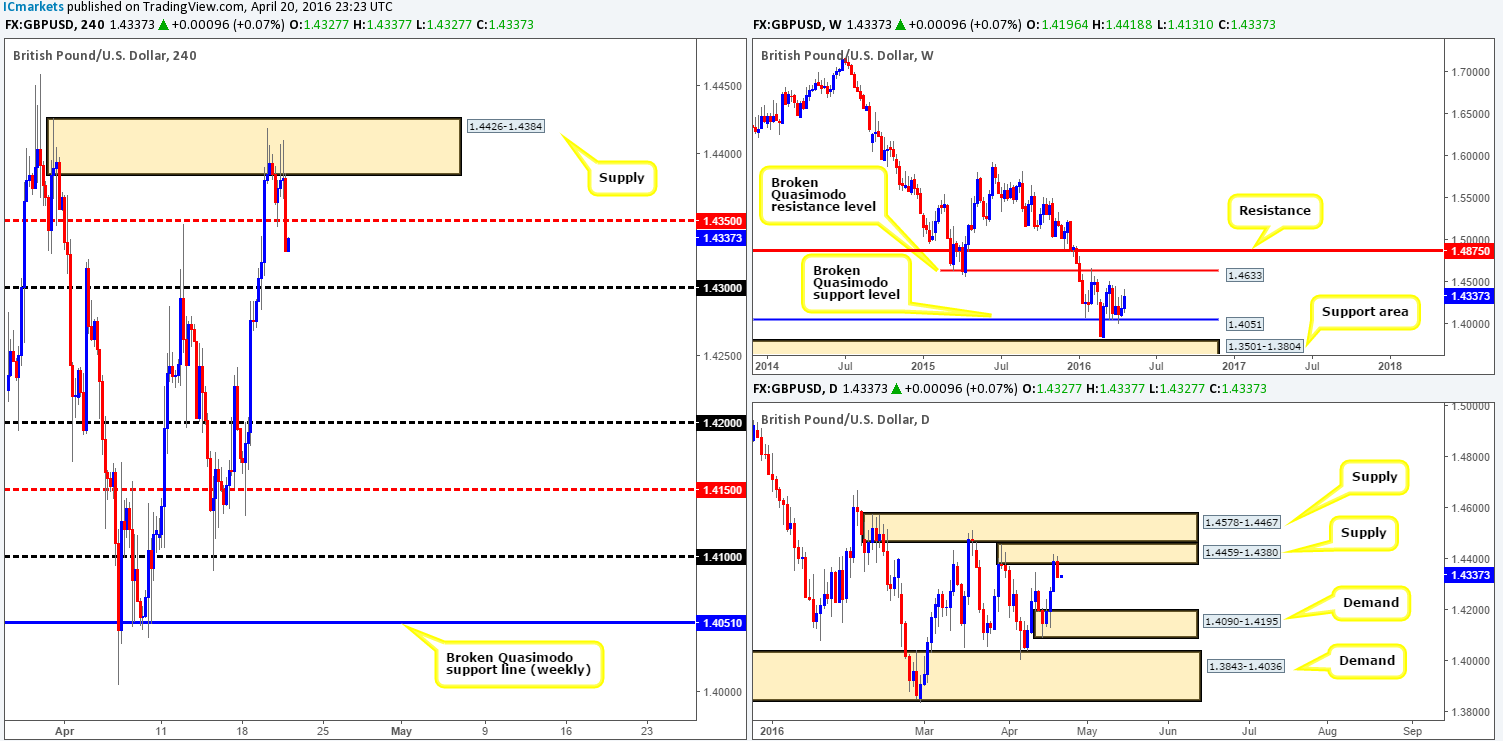
Starting from the top this morning, weekly buyers remain holding ground above the broken Quasimodo support at 1.4051. If we were solely trading this timeframe, current structure suggests that this pair could punch as high as the broken Quasimodo resistance line coming in at 1.4633. On the other side of the field, however, daily price is reacting from supply chalked up at 1.4459-1.4380, which as far as we can see, shows potential for further downside towards demand sitting at 1.4090-1.4195.
Moving across to the H4 chart, we can see that following a small show of strength from the buyers at mid-level support 1.4350 yesterday, price eventually sold off nicely from supply at 1.4426-1.4384. In order for us to be convinced that the sellers have the upper hand in this market, we’d need to see price close below the 1.4300 handle. This would not only likely confirm bearish strength from the daily supply mentioned above at 1.4459-1.4380, but also establish a solid footing for a sell on any retest seen at 1.4300 down to 1.4200 (conveniently sits just above the aforementioned daily demand). For us personally, if price were to break/retest 1.1300 and hold firm, this would be sufficient enough to short this market with a stop placed above 1.1300. We would trail this position relatively aggressively, nevertheless, since let’s not forget where price is positioned on the weekly timeframe (see above).
Levels to watch/live orders:
- Buys: Flat (Stop loss: N/A).
- Sells: Watch for price to consume 1.4300 and look to trade any retest seen thereafter (lower timeframe confirmation required).
AUD/USD:
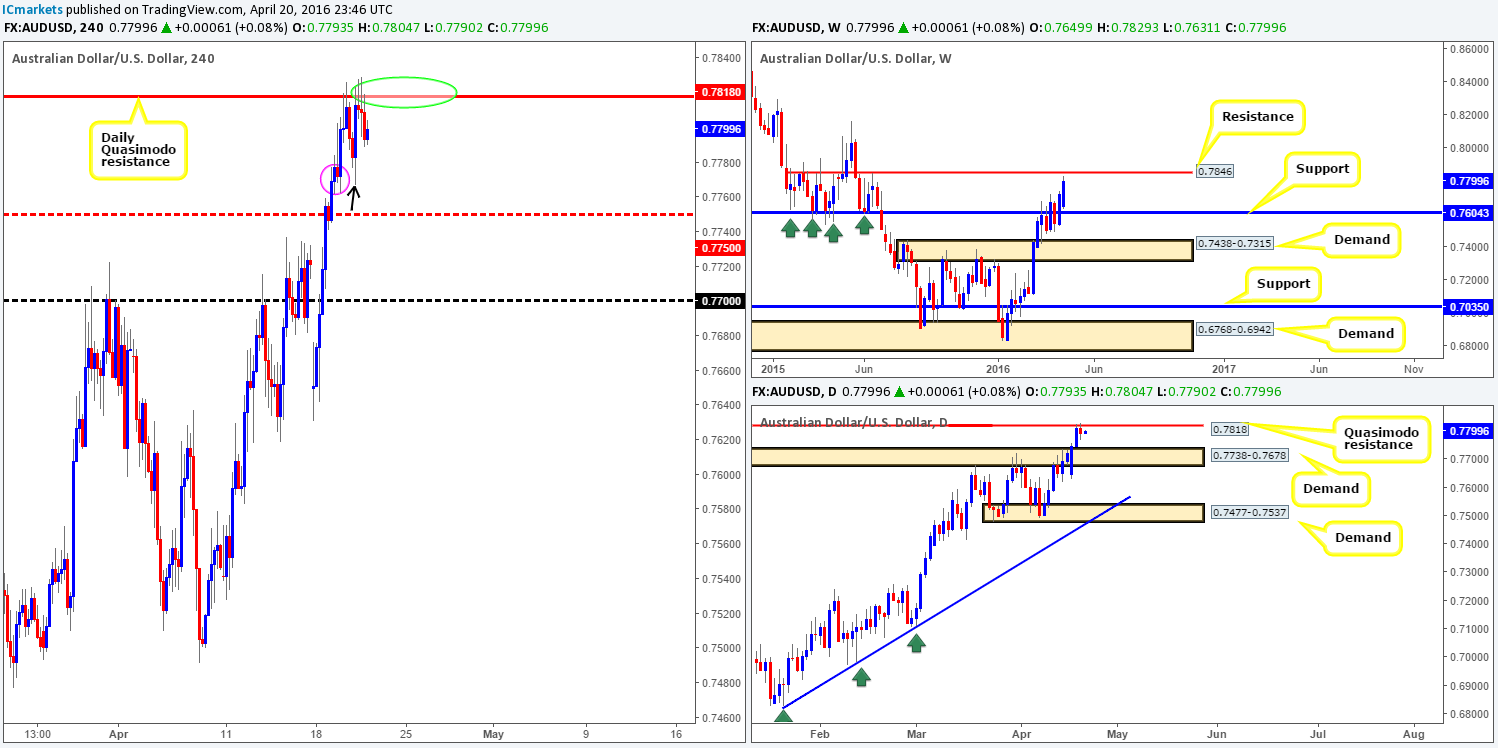
Throughout the course of yesterday’s sessions, the commodity currency was seen nibbling at the daily Quasimodo resistance line drawn from 0.7818 – just look at those beautiful selling wicks! In addition to this, the minor H4 demand seen marked with a pink circle at 0.7762-0.7777 likely had the majority of bids removed from this area by yesterday’s low (a demand consumption tail marked with a black arrow) 0.7766.
In light of this, where does one go from here? Well, with the daily chart showing room for the Aussie to drop down towards demand seen printed at 0.7738-0.7678, we’re quite confident that this pair is heading lower. However, before anyone looks to take on any short trades, traders may want to take note of the fact that weekly price may want to punch higher to connect with resistance drawn from 0.7846 (hence a fakeout could be seen above the current daily Quasimodo resistance before sellers step on the scene).
Therefore, the best, and in our opinion most logical way to approach this market today, would be to hunt for lower timeframe shorts (for lower timeframe confirmation techniques, please see the top of this report) around the daily Quasimodo line (green circle). By waiting for the lower timeframes to prove selling strength resides here, one can usually avoid any fakeout that may take place. If we manage to pin down a sell trade today, we’ll be looking to take partial profits at the H4 mid-level support 0.7750, followed by the 0.7700 handle.
Levels to watch/live orders:
- Buys: Flat (Stop loss: N/A).
- Sells: 0.7818 region [Tentative – confirmation required] (Stop loss: dependent on where one confirms this area).
USD/JPY:
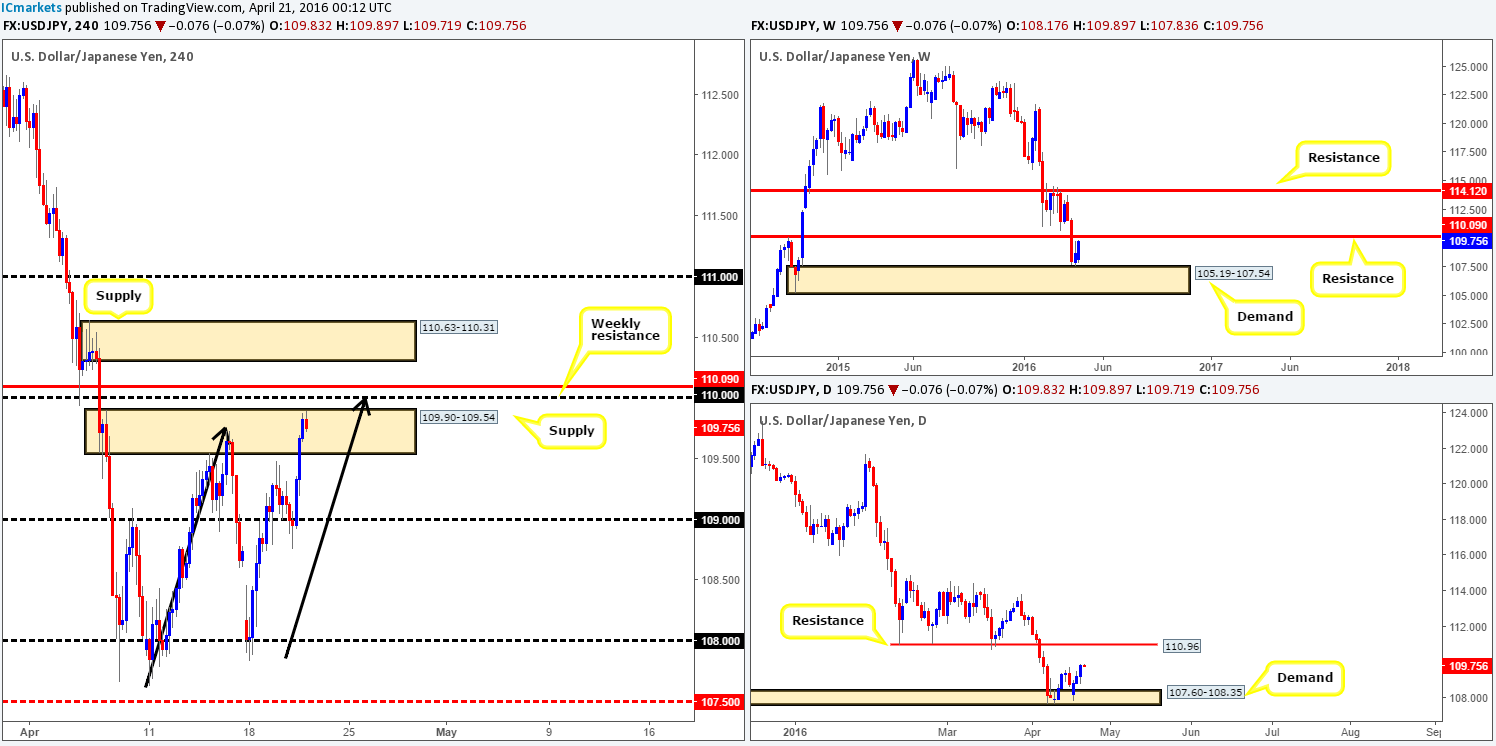
Following a rather aggressive push below the 109.00 handle to lows of 108.76 yesterday, a heavy round of bids came into this market going into the London session. This, as you can see, forced price to test the extremes of H4 supply at 109.90-109.54 by the day’s end, and come very close to completing the D-leg of an AB=CD bearish pattern (see black arrows).
Seeing as how there’s a major weekly resistance sitting just above the current H4 supply zone at 110.09, we feel price is likely going to fake above this area to connect with this higher-timeframe line. What is more, notice that the AB=CD pattern we mentioned above actually completes just below this level, in fact; it completes to-the-pip at the 110.00 handle! Therefore, today’s spotlight will firmly be focused on looking to sell around the 110.09/110.00 region. We would not advise placing pending orders around this area, however, due to the strong possibility that a fakeout up to H4 supply sitting at 110.63-110.31 could potentially take place before sellers step in!
Levels to watch/live orders:
- Buys: Flat (Stop loss: N/A).
- Sells: 110.09/110.00 [Tentative – confirmation required] (Stop loss: dependent on where one confirms this area).
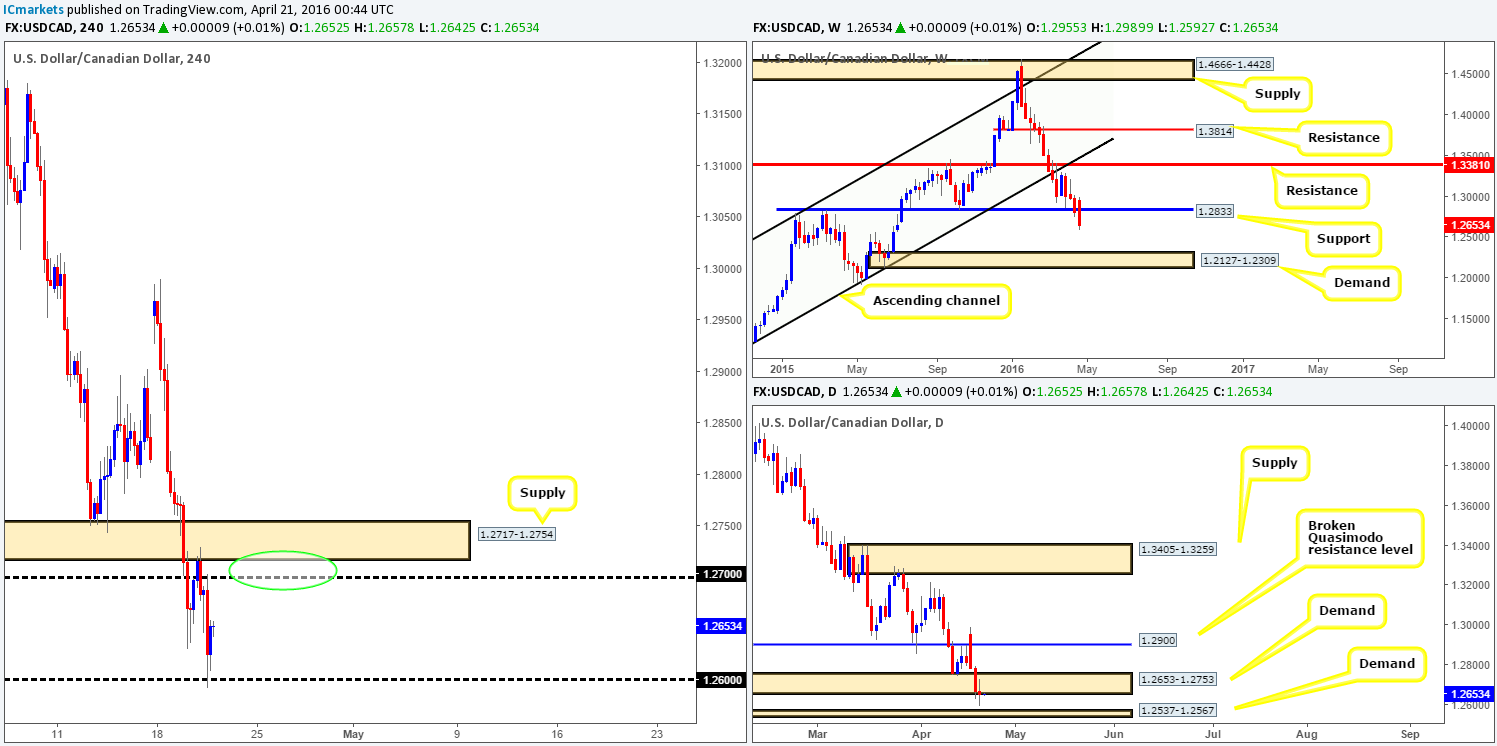
USD/CAD:
The USD/CAD, as you can see from the H4 chart, faked above 1.2700 into the jaws of a H4 supply seen at 1.2717-1.2754 during yesterday’s London session. The subsequent sell-off from here, weighed on heavily by a rise in Oil prices, saw the Loonie connect with the 1.2600 line going into the U.S. open, which managed to reverse price to highs of 1.2659 by the close.
Given that H4 price is now effectively loitering mid-range between 1.2700/1.2600 at the moment, let’s take a look to see what the higher timeframes have on offer. Over on the weekly chart, we can see that support drawn from 1.2833 is under serious pressure at the moment. In the event that a sustained move south is seen beyond here, demand drawn from 1.2127-1.2309 is likely the next target on the hit list. Climbing down to the daily chart, demand at 1.2653-1.2753 saw a rather viscous whipsaw through this area yesterday, likely consuming the majority of buyers around this zone and potentially clearing the path south down to demand seen at 1.2537-1.2567.
With the above points in mind, higher-timeframe direction is clearly pointing in a more southerly direction for the time being. However, the only place we see as legit for shorts today is back up around the H4 supply at 1.2717-1.2754/ 1.2700 (green circle) region. Looking for a trade on a break below 1.2600 is not really something we’d be comfortable with since this would place one almost on top of daily demand mentioned above at 1.2537-1.2567 – not really ideal for selling!
Levels to watch/live orders:
- Buys: Flat (Stop loss: N/A).
- Sells: 1.2717-1.2754/1.2700 [Tentative – confirmation required] (Stop loss: dependent on where one confirms this area).
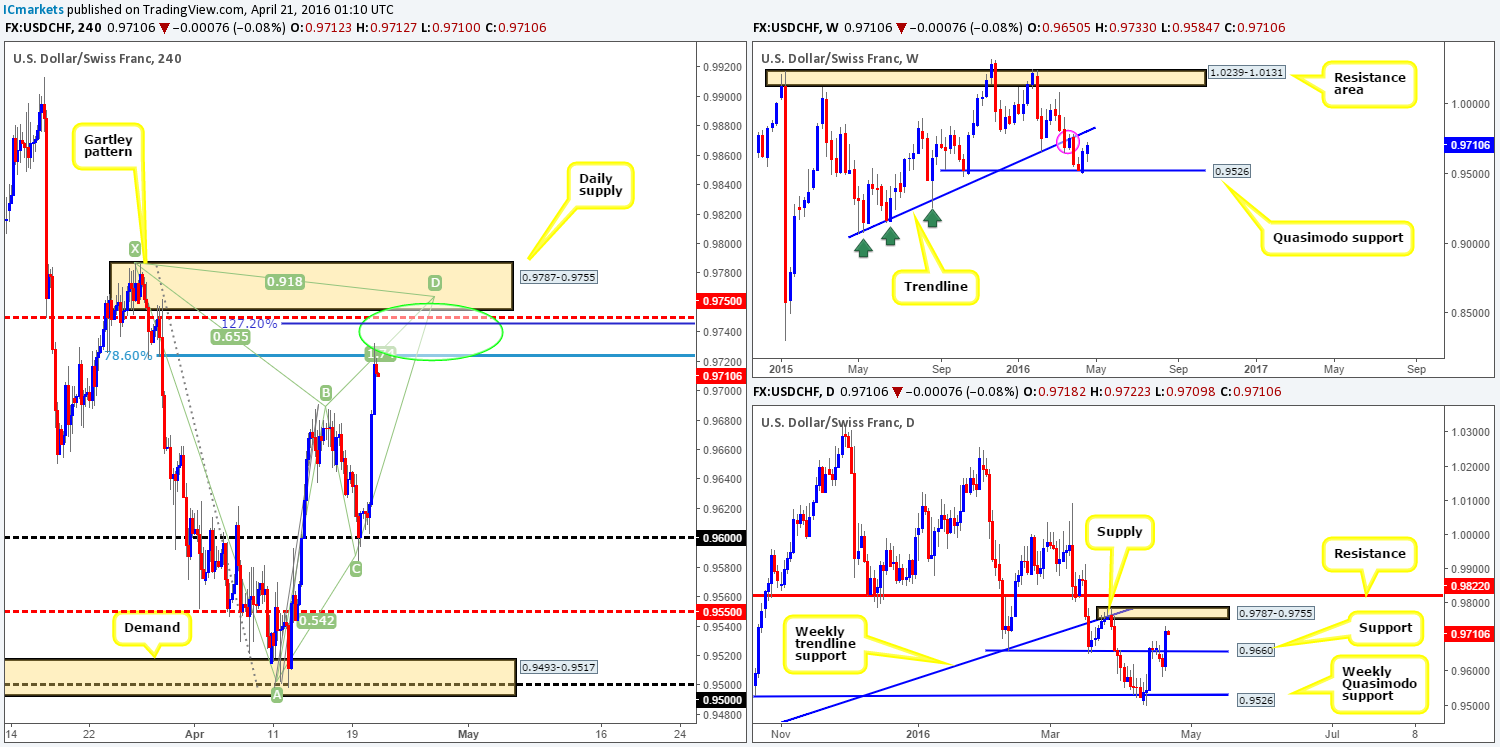
USD/CHF:
Thanks to yesterday’s aggressive advance north to highs of 0.9733, our outlook for today’s upcoming trade is going to be relatively straightforward. With price seen trading at a small weekly supply marked with a pink circle at 0.9787-0.9695 and daily action closing in on a supply drawn from 0.9787-0.9755, this, as we’re sure you’ll agree, casts a certain bearish cloud over this pair.
However, when taking into account that the H4 chart is currently chalking up a near-perfect bearish Harmonic Gartley pattern which converges nicely with the above said daily supply (green circle), this places us firmly in the sellers’ camp today. With that being the case, we have placed a pending sell order at 0.9752 – two pips above the mid-level resistance 0.9750, and a stop-loss order above daily supply at 0.9790. Should our order be filled today, we’ll be looking to take a small chunk of our position off the table at the nearest H4 demand formed on approach, and from there we’ll reassess regarding further take-profit zones as we see this pair driving quite a way lower over the next few days.
Levels to watch/live orders:
- Buys: Flat (Stop loss: N/A).
- Sells: 0.9752 [Pending order] (Stop loss: 0.9790).
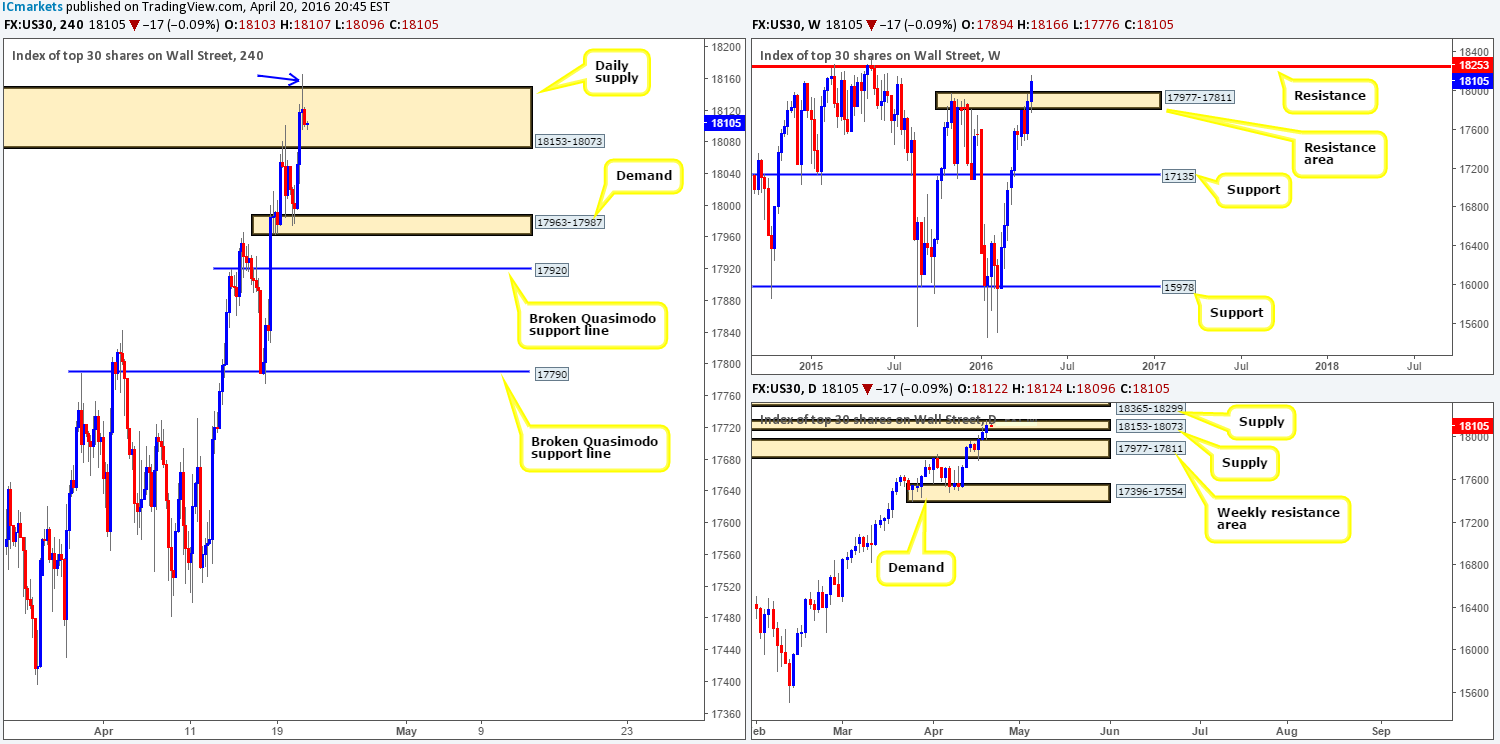
DOW 30:
Using a top-down approach this morning, we’ll begin by taking a look at the weekly chart. At the time of writing, it is relatively clear to see that the bulls have the upper hand in this market right now. The weekly resistance area at 17977-17811 has more than likely had its day, consequently opening up the runway north towards weekly resistance chalked up at 18253. Branching lower to the daily chart, one can actually see that yesterday’s action used the struggling weekly resistance area as a base in which to push above daily supply at 18153-18073. By and of itself, this screams bullish strength to us.
With the majority of sellers likely stopped out around daily supply at 18153-18073 from yesterday’s spike seen marked by a blue arrow on the H4 chart, we’re looking to buy from H4 demand at 17963-17987 today. However, seeing as how this would effectively be the second time back to this demand, price could potentially fake lower to the H4 broken Quasimodo support line at 17920 before buyers step in. As such, we would advise only entering long from the current H4 demand with lower timeframe confirmation (for confirmation techniques, please see the top of this report).
Levels to watch/live orders:
- Buys: 17963-17987 [Tentative – confirmation required] (Stop loss: dependent on where one confirms this area).
- Sells: Flat (Stop loss: N/A).
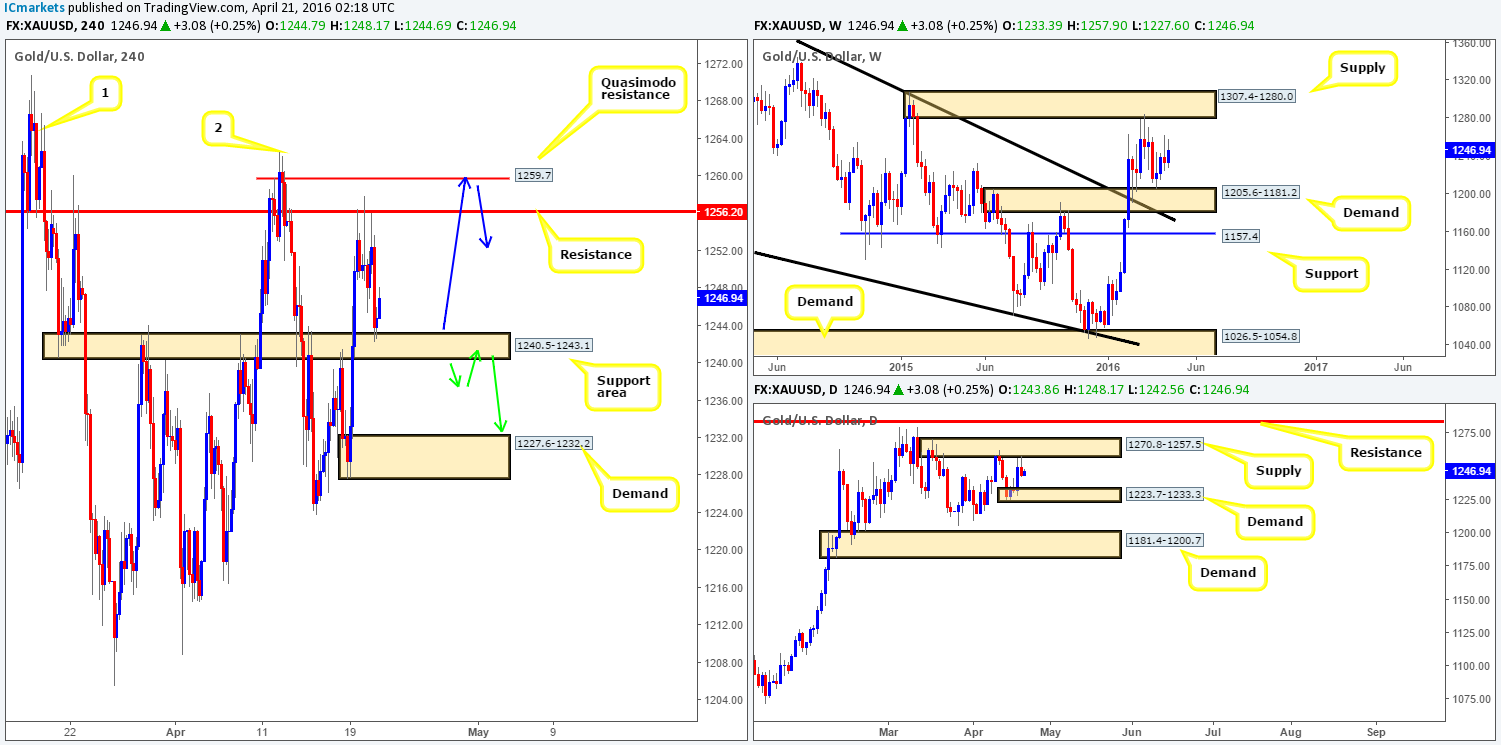
XAU/USD:
During the course of yesterday’s sessions, we saw the yellow metal stab up to the H4 resistance at 1256.2 for the third time in two days, before selling-off to a H4 support area at 1240.5-1243.1 by the close 1243.8. So far the response from this support base has been reasonably sound.
Gold is an interesting instrument to be looking at right now. On the one hand we have weekly price showing very little direction in this market. To the upside, price is seen capped by supply drawn from 1307.4-1280.0, while to the downside demand at 1205.6-1181.2 continues to hold price higher. As such, we recommend keeping an eyeball on both of these zones in the coming days. On the other hand, Gold recently sold off from daily supply at 1270.8-1257.5, with room seen to continue lower until at least daily demand penciled in at 1223.7-1233.3.
On account of the above, this is what we have logged going forward:
- As per the blue arrows, if price should continue to drive higher from the current H4 support area, we’ll be looking short (with the aid of lower timeframe price action) the H4 Quasimodo resistance line at 1259.7 (sits nicely within the current daily supply area). The reason for choosing this level simply comes down to offers now likely being weak at the H4 resistance below it at 1256.2. Additionally, Points one (1266.7) and two (1262.6) show what we believe to be consumption wicks i.e. little active supply left within this region. Therefore, in our view, 1259.7 remains the only fresh line to the upside at the moment.
- Conversely, in the event that we see price drive below the current H4 support area, the river south should be ‘ripple free’ down to H4 demand at 1227.6-1232.2 (located within the daily demand mentioned above at 1223.7-1233.3). For us to be given the green light to short following a close lower, nonetheless, we’d need to see price retest this area as supply together with a lower timeframe confirming signal as per the green arrows.
Levels to watch/live orders:
- Buys: Flat (Stop loss: N/A).
- Sells: 1259.7 [Tentative – confirmation required] (Stop loss: dependent on where one confirms this level). Watch for price to consume 1240.5-1243.1 and look to trade any retest seen thereafter (lower timeframe confirmation required).


