
EUR/USD:
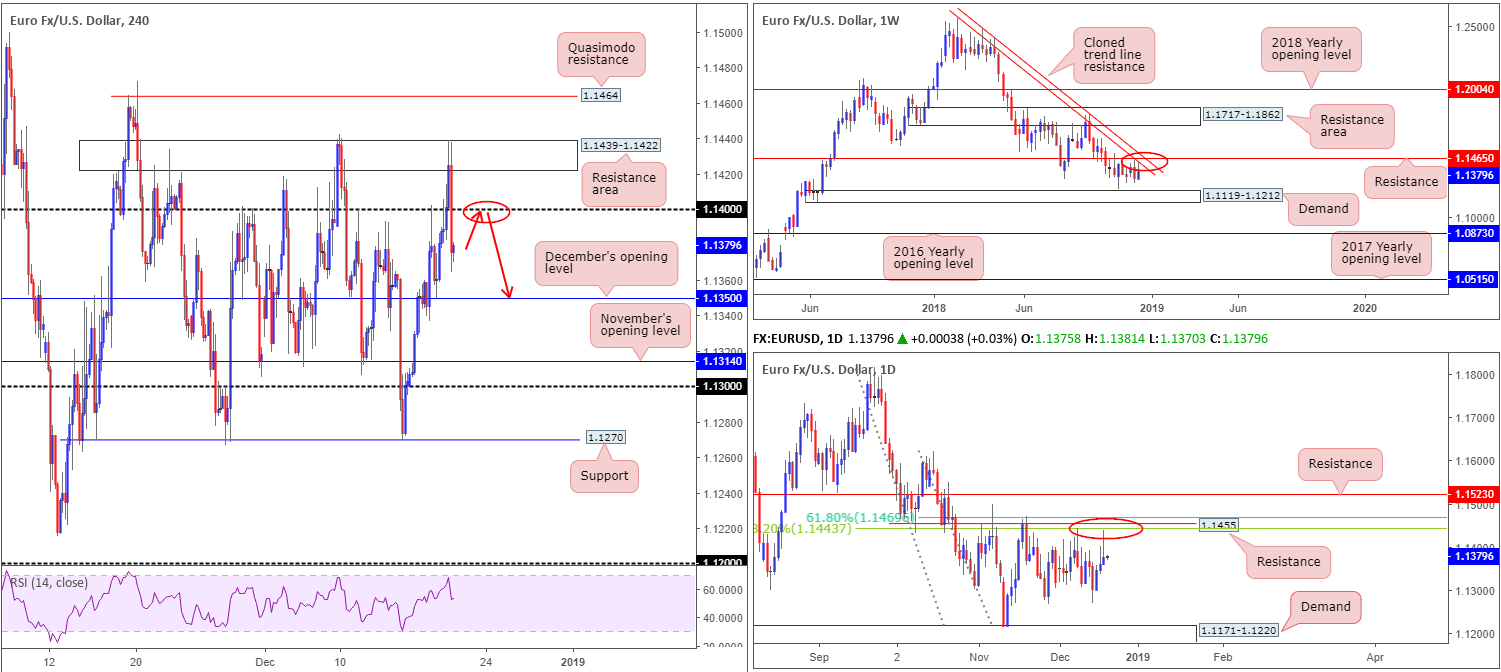
The EUR/USD witnessed a round of reasonably dominant buying in early US trade Wednesday, following news the EU approved Italy’s revised 2019 budget with a 2.04% deficit target. Firmly clearing 1.14, the move hauled the pair high into the walls of a H4 resistance area coming in at 1.1439-1.1422. As you can see, though, upward momentum was short-lived.
The FOMC raised the fed funds rate target by 25bps, as expected. The central bank also narrowed the trajectory of rate hikes, envisaging two hikes in 2019. Although Powell spoke favourably regarding the strength of the US economy, the Fed Chairman struck a cautious tone concerning a slowdown in growth. Overall, however, the US dollar popped higher, bringing the US dollar index to 97.00+, consequently exerting downward pressure on the EUR/USD.
With the H4 candles settling sub 1.14 and now potentially poised to reconnect with December’s opening level at 1.1350, where do we stand on the bigger picture? In recent sessions, weekly flow tested the lower limit of a cloned trend line resistance (extended from the high 1.2413), positioned close by a resistance level priced in at 1.1465. Further selling from this point has demand at 1.1119-1.1212 to target. In terms of daily action, price turned lower just south of resistance circulating around the 1.1455 region, which happens to closely converge with two Fibonacci resistances: a 61.8% and a 38.2% at 1.1469 and 1.1443, respectively. Note the day ended forming a reasonably notable bearish pin-bar pattern.
Areas of consideration:
Having seen a rather large fakeout above 1.14 yesterday, likely tripping a truckload of stop-loss orders, unfilled sell orders likely reside around this region. Couple this with both weekly and daily charts emphasizing resistance, the unit could potentially retest the underside of 1.14 today and make a run for December’s opening level at 1.1350 as an initial support target.
As round numbers are undeniably prone to fakeouts/stop runs, the research team recommends waiting for additional bearish candlestick confirmation before pulling the trigger off 1.14. That way, not only do traders have an indication sellers are active, the candlestick pattern also provides entry/stop parameters.
Today’s data points: Limited.
GBP/USD:
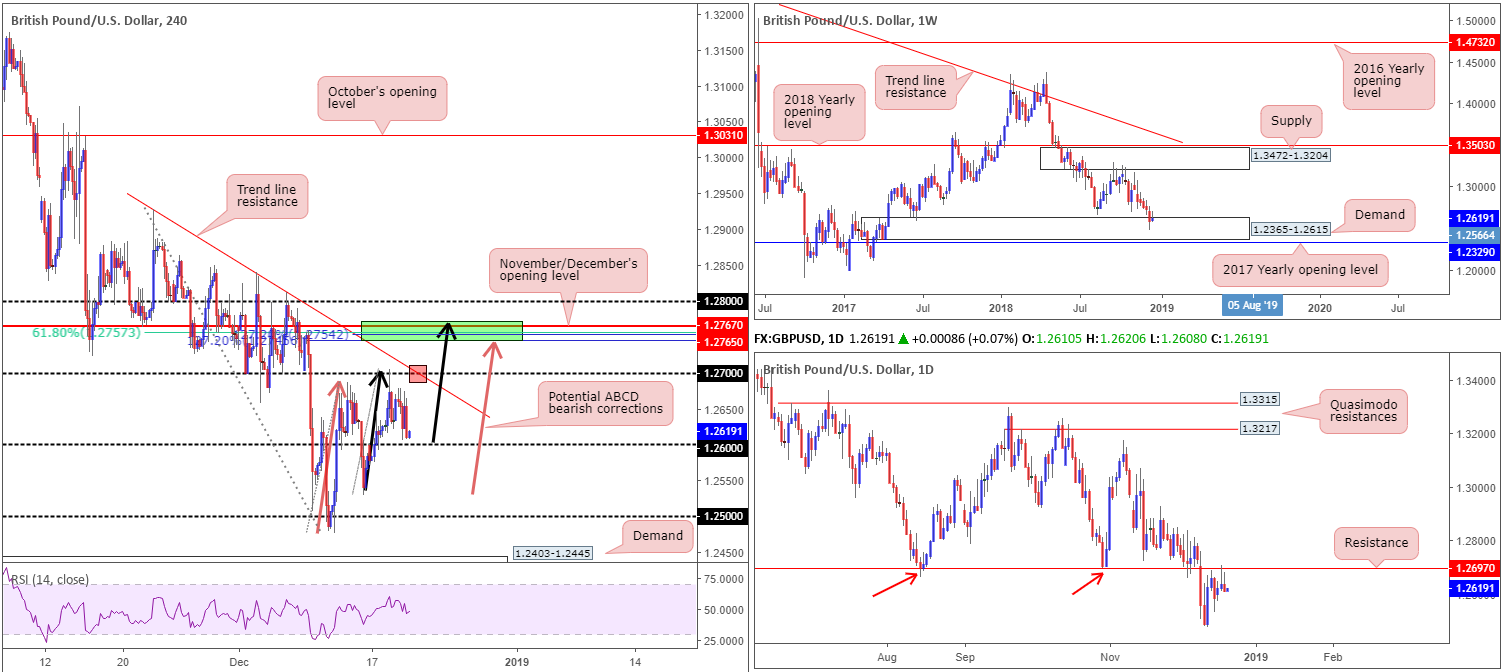
A victim of USD strength following the latest Fed movement and also weighed by softer-than-expected UK inflation, the GBP/USD remained defensive sub 1.27 Wednesday, concluding the day just north of 1.26. In the event 1.26 proves supportive, 1.27 offers possible resistance (red), as does two H4 AB=CD (orange and black arrows) 127.2% bearish patterns potentially completing between 1.2774/1.2745 (green). Note this area also happens to encompass November and December’s opening levels at 1.2767/1.2765. However, a move in this fashion would imply not only a break of 1.27, but also a breach of nearby trend line resistance (etched from the high 1.2927): a line that has managed to cap upside on two occasions this month.
On a wider perspective, weekly price shows buyers and sellers remain battling for position around the top edge of demand coming in at 1.2365-1.2615. The story on the daily timeframe, nevertheless, reveals two back-to-back bearish pin-bar formations printed around the underside of resistance found at 1.2697.
Areas of consideration:
With respect to higher-timeframe structure, conflicting signals clearly remain: we have weekly price trading from demand, though at the same time we also have daily price languishing just south of resistance signaling further selling could be in the offing.
Medium-term action presents the following for sellers:
- A bounce is likely to be observed from 1.27 (red), given the converging H4 trend line resistance (taken from the high 1.2927). Also bear in mind daily resistance is seen close by at 1.2697.
- A failure of 1.27 to hold will likely bring in 1.2774/1.2745 (green). As discussed above, this zone holds ample H4 confluence to support sellers.
In regard to buying, the research team unfortunately sees very little to hang their hat on at the moment. This is largely due to the lackluster performance being seen out of the current weekly demand area.
Today’s data points: UK Retail Sales m/m; MPC Official Bank Rate Votes, Monetary Policy Summary and the Official Bank Rate Decision.
AUD/USD:
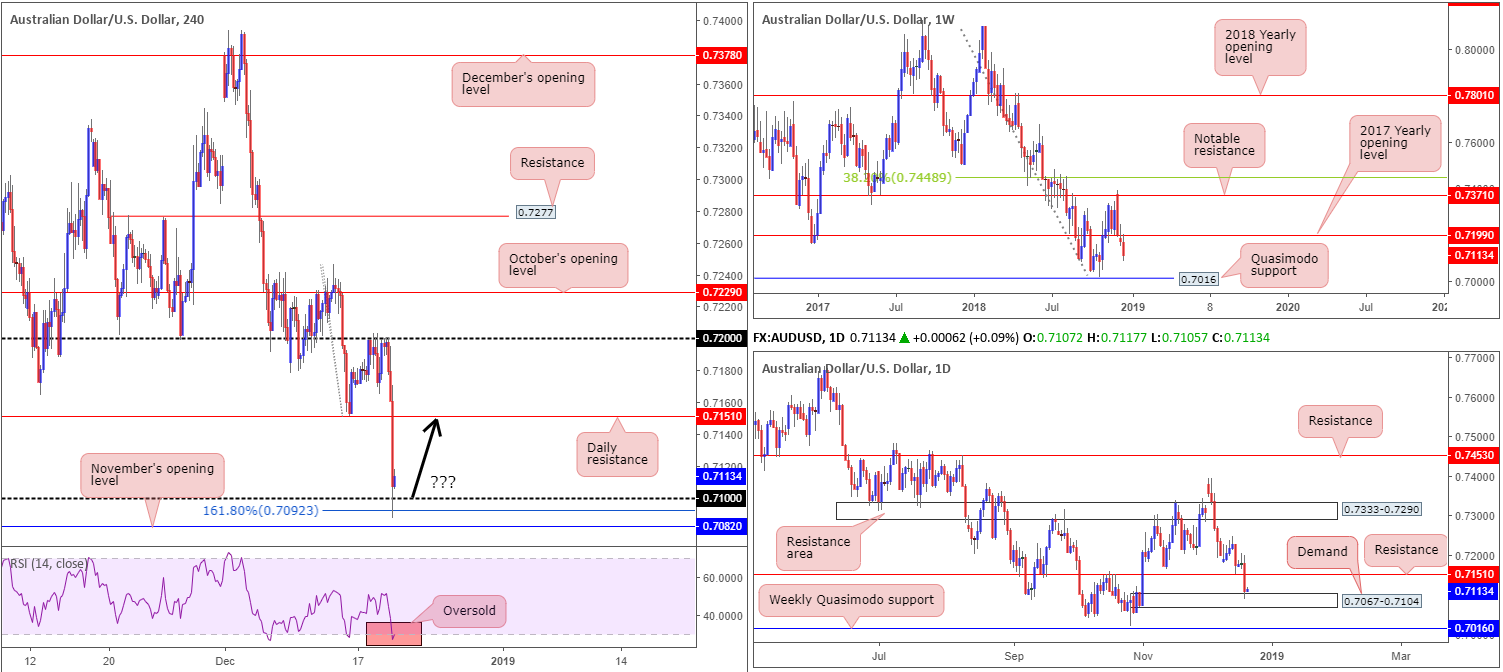
The commodity currency fell sharply following FOMC announcements Wednesday, chalking up a 1.00% loss on the day. In one fell swoop, H4 price swept through orders at daily support drawn from 0.7151 (now acting resistance) and mildly surpassed 0.71 to bring in buyers off a 161.8% Fibonacci ext. point at 0.7092. Note the 161.8% Fibonacci extension forms part of what we believe Scott Carney terms an alternate AB=CD pattern.
With buyers defending 0.71, as we write, and the H4 RSI indicator treading water within oversold territory, is this enough to draw in buyers and possibly reclaim some of yesterday’s lost ground? According to the daily timeframe it certainly is, having seen price shake hands with a notable demand area coming in at 0.7067-0.7104. This area boasts strong upside momentum out of its base, therefore suggesting strength. Conversely, however, weekly activity continues to reflect a bearish tone. Last week witnessed a close form beneath the 2017 yearly opening level at 0.7199 in the shape of a bearish pin-bar formation. In addition to this, room is seen for the sellers to press as far south as a Quasimodo support at 0.7016.
Areas of consideration:
Well done to any of our readers who happened to sell 0.72. This was a noted level to watch in yesterday’s briefing, given its connection to weekly structure: the 2017 yearly opening level at 0.7199.
While buying may enter the fold today knowing we’re coming from reasonably sound structure on both H4 and daily timeframes, the research team remains concerned about the weekly timeframe suggesting lower levels could be seen.
For those interested in attempting to fade 0.71 today, waiting for bullish candlestick confirmation to form is an option. Not only will this offer entry/stop parameters to work with, it’ll also provide evidence buyers reside around this region. As for the first upside target, daily resistance at 0.7151 appears a logical starting point.
Today’s data points: Limited.
USD/JPY:
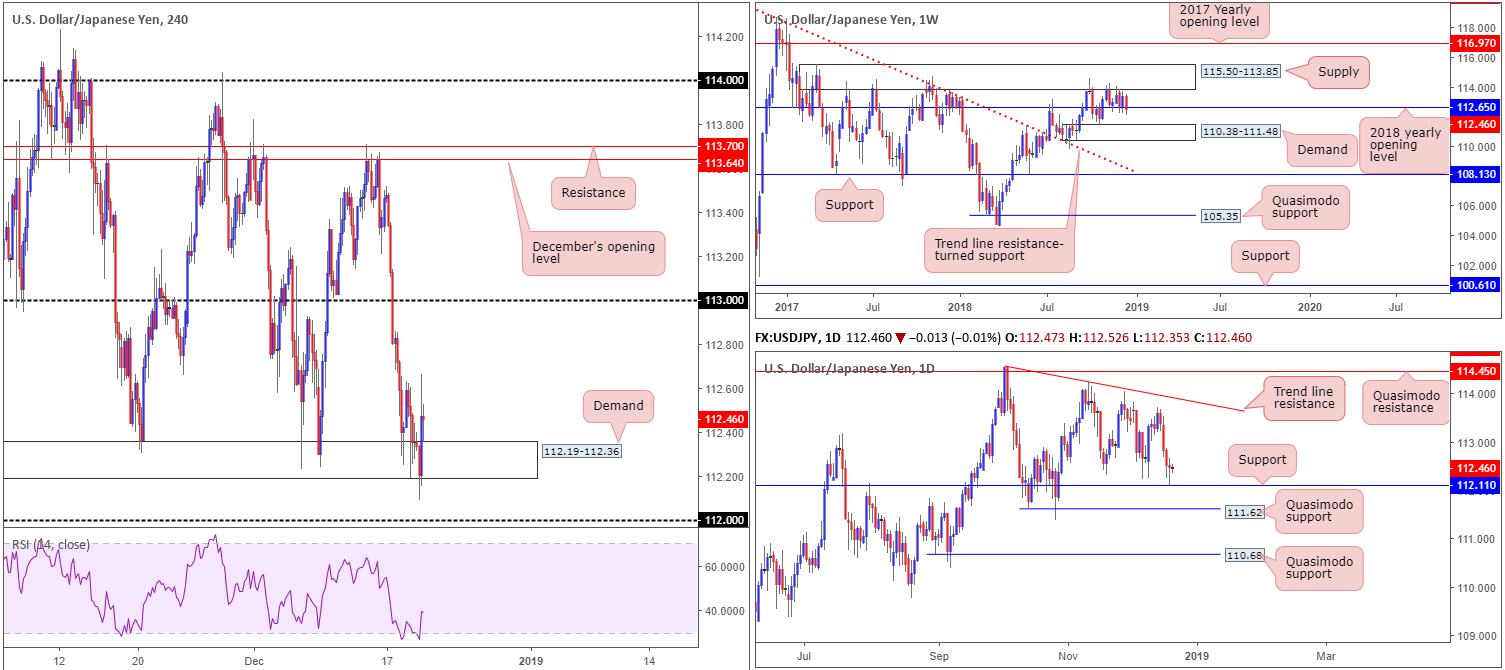
The key observation on the H4 timeframe this morning is the recent whipsaw through the lower edge of demand coming in at 112.19-112.36. Although the move, which was largely triggered on FOMC announcements, failed to bring in buyers off the 112 handle, it did likely trip a large portion of stop-loss orders for those long from the aforementioned demand. It may also interest some traders to note the unit is making its way out of oversold territory on the RSI indicator.
What’s also interesting from a technical perspective is the recent move tested daily support almost to the pip at 112.11. The response from here has so far been positive, with the majority of yesterday’s daily candle covered by way of a buying tail.
On the contrary to the structure highlighted above, weekly price is still seen attempting to wash through orders at its 2018 yearly opening level at 112.65. Further selling from this point could eventually lead to a move being seen towards demand priced in at 110.38-111.48.
Areas of consideration:
Ultimately, the research team are searching for signs of bullish life around the current H4 demand zone in the shape of a H4 bullish candlestick formation (the current H4 candle is showing a beautiful pin-bar formation at the moment – if price closes as is, this would be considered a valid candlestick pattern). Although we have broken the lower edge of this base which has likely tripped some stops, we have to take into account price brought in potential buyers from daily support mentioned above at 112.11.
Providing a suitable H4 bullish candlestick pattern is recognized, the initial upside target rests around the underside of 113.
The reason behind requiring additional candlestick confirmation simply falls on weekly structure suggesting we may be heading for lower ground.
Today’s data points: Japan’s Monetary Policy Statement; BoJ Policy Rate and BoJ Press Conference.
USD/CAD:
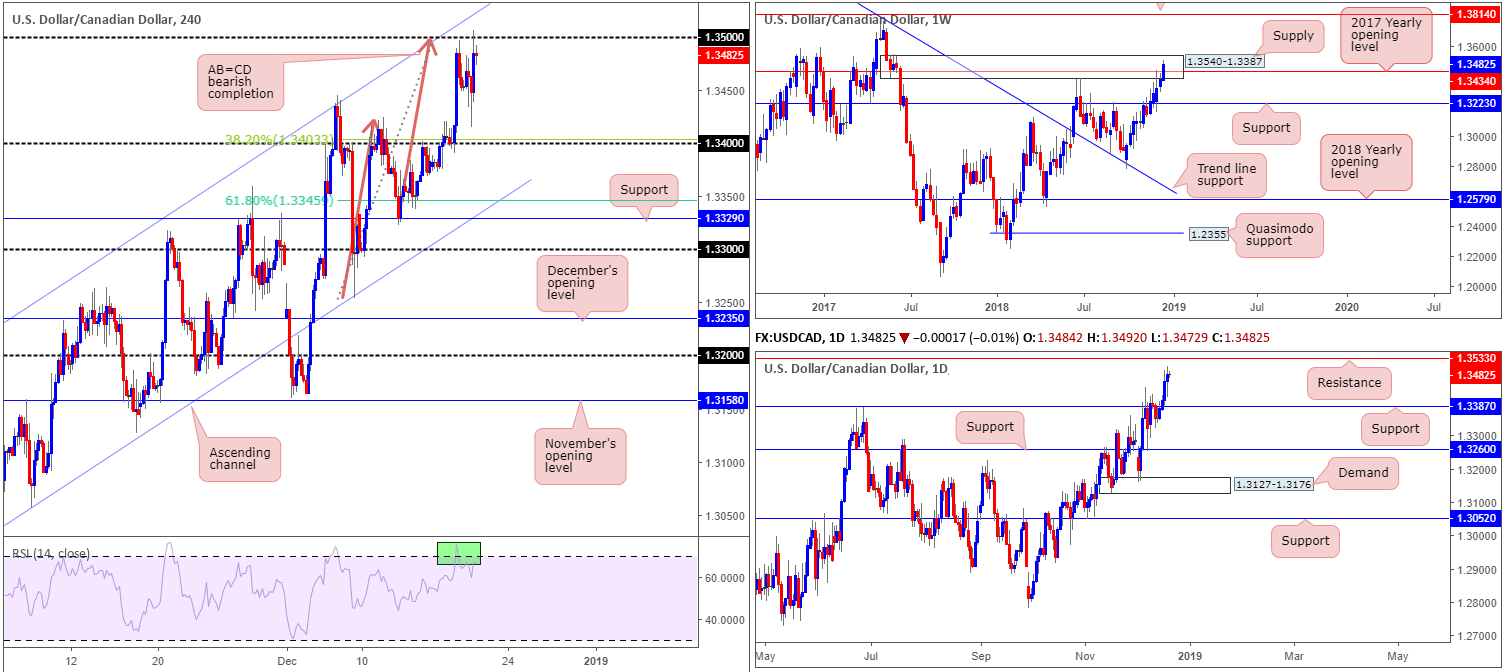
Leaving 1.34 unchallenged Wednesday, H4 action recovered strongly following the FOMC raising the fed funds rate target by 25bps, as expected. As is evident from the H4 timeframe, the advance lifted the unit towards 1.35, though failed to sustain gains beyond highs of 1.3506 into the close. It might also be of interest to some traders to note the H4 RSI indicator is currently displaying an overbought/divergence (green) reading.
In Wednesday’s briefing, the research team highlighted a H4 AB=CD bearish completion pattern (orange arrows). Although price sold off following its completion, price has yet to strike its first take-profit target at 1.3403: the 38.2% H4 Fibonacci support.
While there is still a strong chance of a reversal taking shape from the underside of 1.35 today, higher-timeframe action is currently signifying a possible move higher could be in store before we press lower. Daily action, as you can see, shows room to trade as far north as resistance coming in at 1.3533, which happens to be located within the upper limit of weekly supply at 1.3540-1.3387.
Areas of consideration:
On account of the above reading, 1.3533 is a level of interest for shorts in this market (stop-loss orders can be positioned above the current weekly supply zone). On top of the higher-timeframe convergence, traders may also want to note 1.3533 merges nicely with H4 channel resistance (extended from the high 1.3132).
From 1.3533, downside targets reside at 1.35. A close beneath this number would be enough to secure a risk-free trade (moving stop-loss orders to breakeven), with eyes then on 1.3434 (2017 yearly opening level on the weekly timeframe), followed closely by 1.34 as the next downside support targets.
Today’s data points: Limited.
USD/CHF:
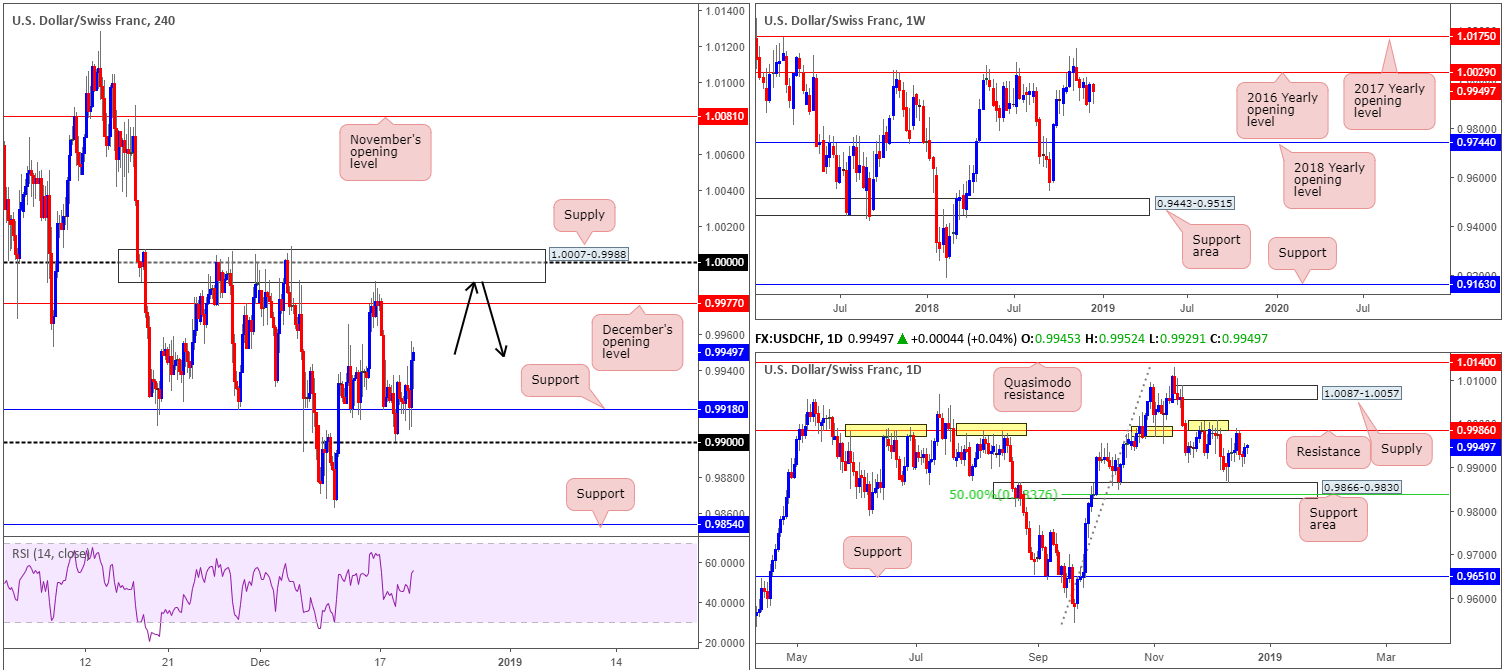
Wednesday’s FOMC session provided the USD/CHF a ledge to pull itself towards highs of 0.9955, consequently breaking a two-day bearish phase. H4 support at 0.9918 remained firmly in the fold, with the candles appearing poised to now approach December’s opening level sited overhead at 0.9977, shadowed closely by H4 supply coming in at 1.0007-0.9988 which happens to contain the all-important 1.0000 (parity) figure within.
How the latest round of buying affected higher-timeframe structure, however, was negligible. Weekly price remains languishing under the 2016 yearly opening level at 1.0029. Support, according to this timeframe, does not enter the fold until we reach the 2018 yearly opening level coming in at 0.9744. The story on the daily timeframe, nevertheless, shows price action remains capped between notable resistance at 0.9986 and a support area coming in at 0.9866-0.9830.
Areas of consideration:
On either timeframe, there’s little stopping the unit from marching further north today, at least until we reach December’s opening level on the H4 timeframe at 0.9977.
Unfortunately, limited support is visible to base a trade at current price. Despite this, selling opportunities are an option should the pair trade higher today. The H4 supply mentioned above at 1.0007-0.9988 will, as it has done in the past, likely offer a platform for sellers to push lower. A fakeout through 0.9977 into the noted H4 supply that’s followed by a H4 close back under 0.9977 would, according to H4 and daily structure, be enough to validate a short in this market, targeting H4 support at 0.9918 as the initial take-profit zone.
Today’s data points: Limited.
Dow Jones Industrial Average:
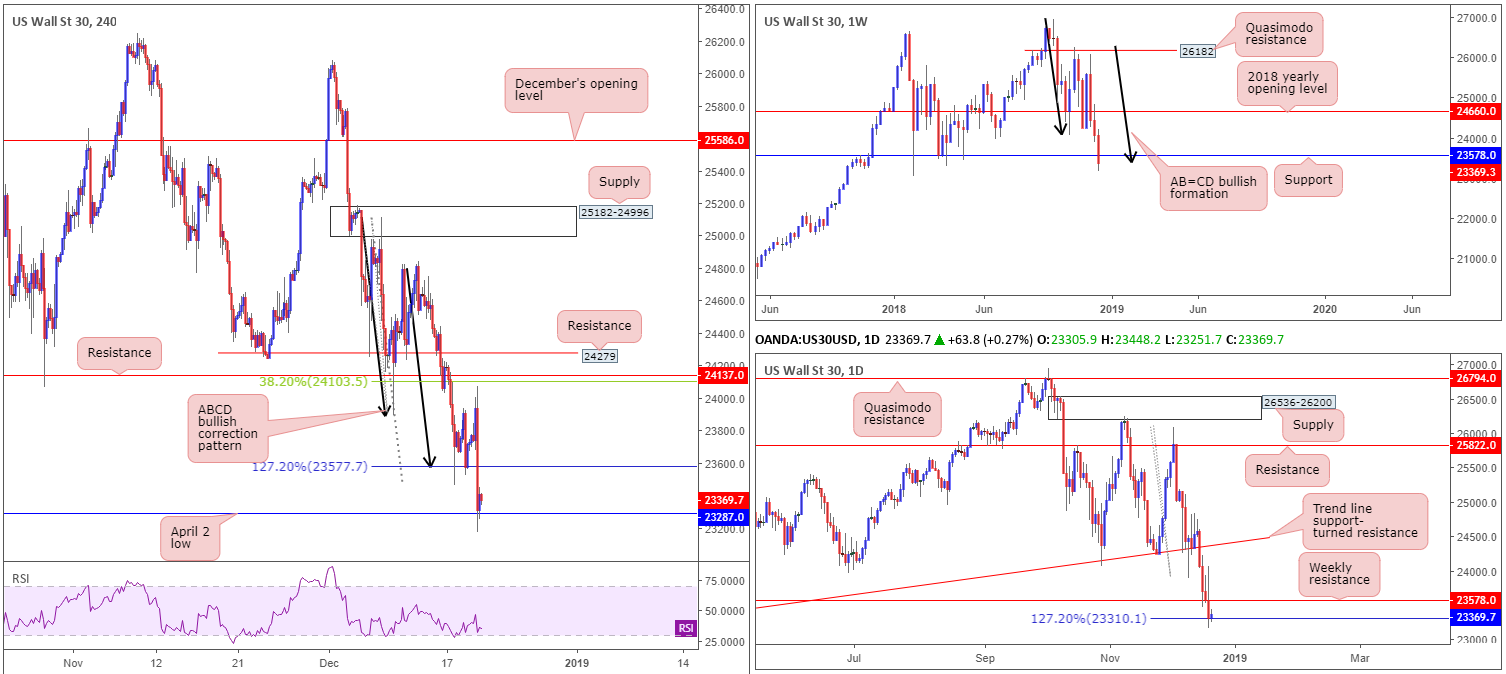
Coming in from the top this morning, weekly price recently explored ground beneath support coming in at 23578. Though considered a bearish signal, the unit may still find active buyers off an AB=CD bullish completion pattern around 23394ish (black arrows).
In conjunction with weekly structure, daily price, although firmly trading beneath recent support at 23578 (now acting resistance), is seen establishing some ground off a 127.2% Fibonacci ext. support value at 23310 (taken from the high 26082). In order to draw in buyer confidence on this timeframe, however, a daily close back above 23578 would likely be needed.
A closer reading of price action on the H4 timeframe reveals the candles put in a strong attempt to defend the ABCD (black arrows) 127.2% bullish pattern at 23577, and even came within a few points of reaching its first take-profit target: the 38.2% Fibonacci resistance at 24103, before swiftly turning lower. Strong selling materialized on the back of yesterday’s FOMC announcements, dragging price through 23577 to the 23287 April 2 low.
Areas of consideration:
Despite observing support on all three timeframes, buying this market is difficult given the index is currently trading 8.68% in the red so far this month. With that being said, though, the research team feels a daily close above daily resistance at 23578 would likely instill confidence in this market, as briefly highlighted above. Until this happens, a long would be a precarious move, in spite of the current supports.
Today’s data points: Limited.
XAU/USD (Gold):
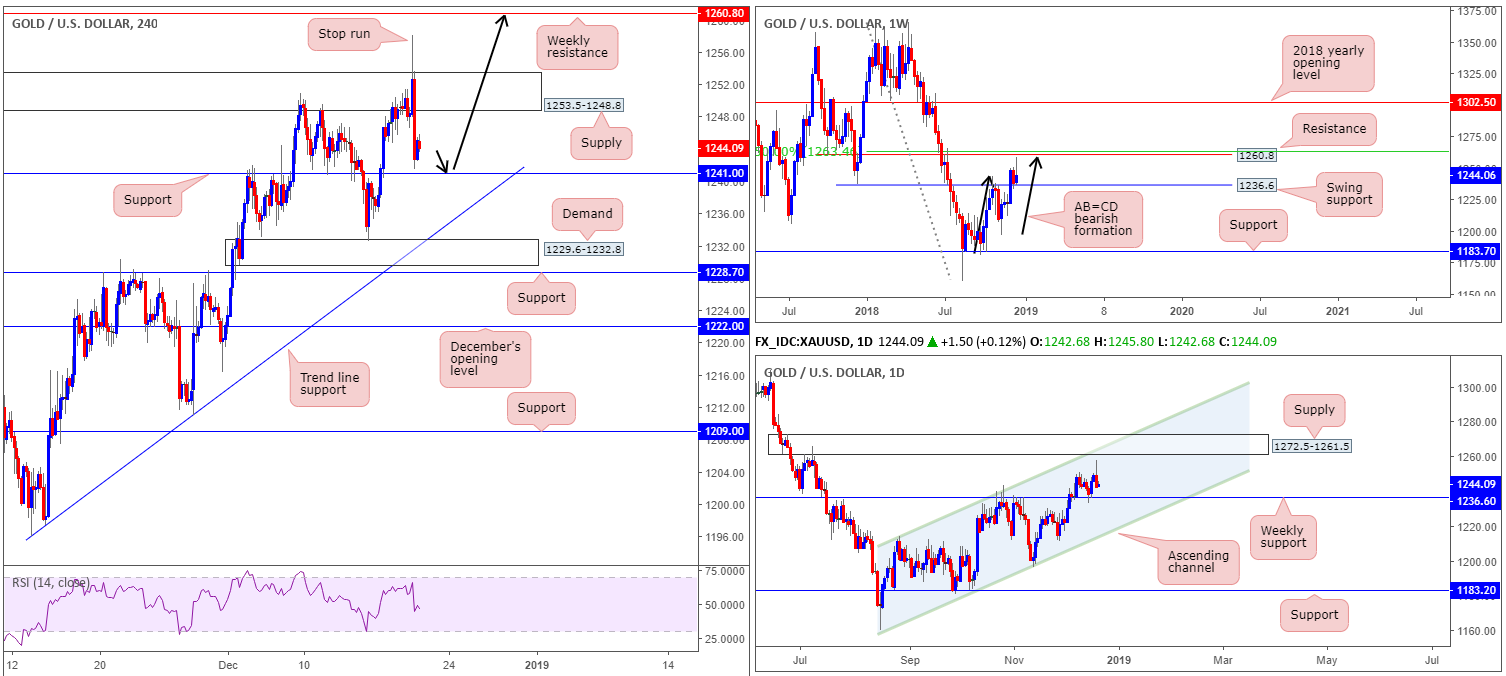
Following a somewhat rather monstrous fakeout through the top edge of H4 supply at 1253.5-1248.8 Wednesday, likely filling a truckload of stop-loss orders from those attempting to sell and also trapping breakout buyers’ orders, the yellow metal pressed for lower ground, concluding the day just north of H4 support at 1241.0.
With sellers likely cleared from the aforementioned H4 supply zone, the path north may very well be clear for further buying towards weekly resistance priced in at 1260.8. What’s also interesting about 1260.8 from a technical perspective is it converges closely with an AB=CD bearish completion point (black arrows) and a 50.0% resistance value at 1263.4 (green). Also, in terms of where we stand on the daily timeframe, upside structure is seen plotted just north of the said weekly resistance level in the form of a converging channel resistance (etched from the high 1214.3) and supply zone at 1272.5-1261.5.
Areas of consideration:
Keeping it Simple Simon this morning, the research team has their eye on H4 support at 1241.0 as a possible floor today, ultimately targeting the weekly resistance level mentioned above at 1260.8. Should H4 price retest 1241.0 today in the shape of a bullish candlestick pattern (entry/stop parameters can be defined according to this pattern), this, along with both weekly and daily charts exhibiting room to press higher, is likely enough to draw in buyers.
A failure to hold at 1241.0, however, will likely call for a move back down to weekly support at 1236.0 for possible buying opportunities.
The use of the site is agreement that the site is for informational and educational purposes only and does not constitute advice in any form in the furtherance of any trade or trading decisions.
The accuracy, completeness and timeliness of the information contained on this site cannot be guaranteed. IC Markets does not warranty, guarantee or make any representations, or assume any liability with regard to financial results based on the use of the information in the site.
News, views, opinions, recommendations and other information obtained from sources outside of www.icmarkets.com.au, used in this site are believed to be reliable, but we cannot guarantee their accuracy or completeness. All such information is subject to change at any time without notice. IC Markets assumes no responsibility for the content of any linked site. The fact that such links may exist does not indicate approval or endorsement of any material contained on any linked site.
IC Markets is not liable for any harm caused by the transmission, through accessing the services or information on this site, of a computer virus, or other computer code or programming device that might be used to access, delete, damage, disable, disrupt or otherwise impede in any manner, the operation of the site or of any user’s software, hardware, data or property.


