
EUR/USD:
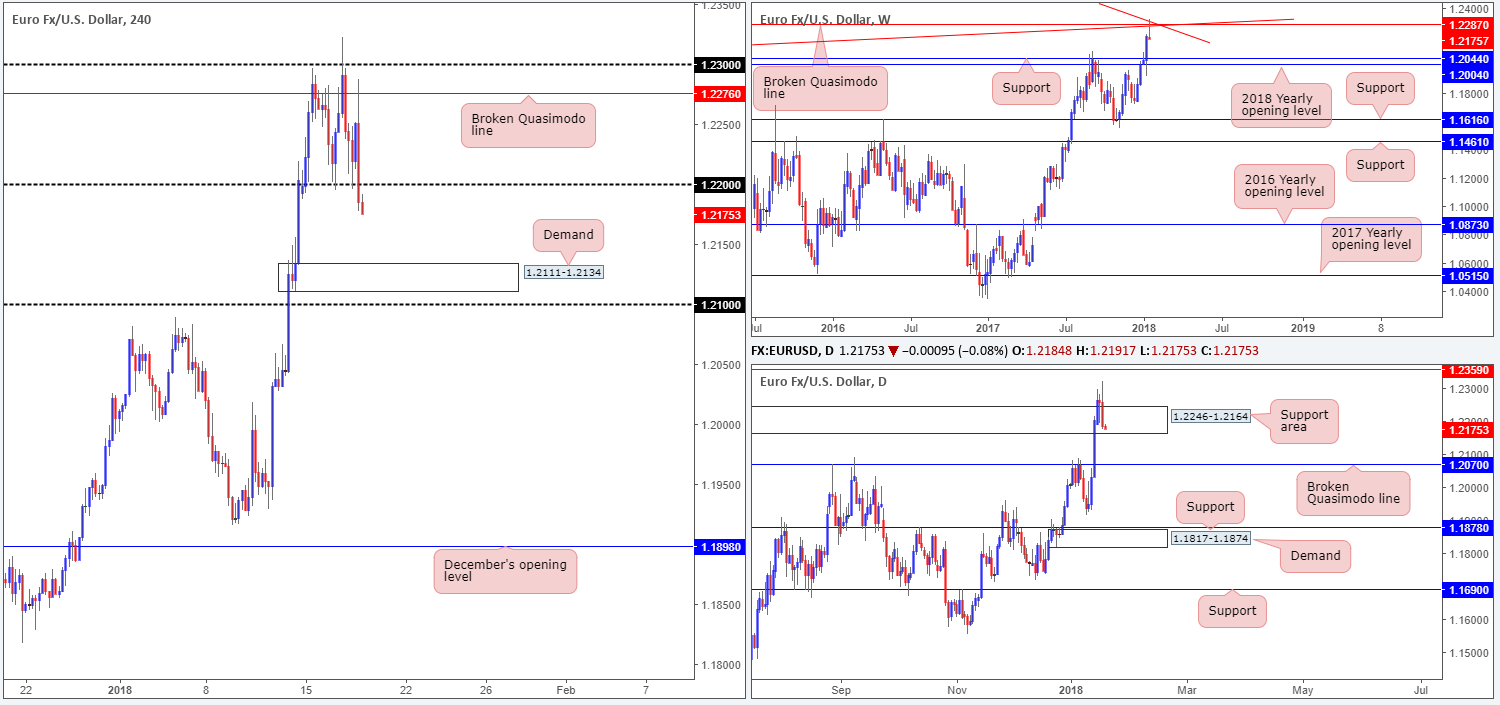
US dollar recovery going into the later hours of Wednesday’s US session brought about a sizeable drop in the EUR/USD market from the underside of a H4 broken Quasimodo line at 1.2276.
The selloff, reinforced by a weekly broken Quasimodo line at 1.2287 and two converging weekly trendline resistances (1.1641/1.6038), dragged the euro beneath the 1.22 handle (H4) going into the closing bell.
Despite the recent run to the downside, technicians will still have an eyeball on the daily support area coming in at 1.2246-1.2164. A break below this beast would likely confirm a bearish bias down to the 1.2070 mark on the daily scale.
Market direction:
With the 1.22 handle now likely out of the picture, further downside to the H4 demand zone placed at 1.2111-1.2134, shadowed closely by the 1.21 handle, could be a possibility today.
A retest of 1.22 followed up with a full or near-full-bodied H4 bear candle would, in our opinion, be an acceptable signal to sell. The reason for demanding the additional candle confirmation here is simply due to the current daily support area in play!
Data points to consider: US housing data, Philly Fed manufacturing index and weekly unemployment claims at 1.30pm GMT.
Areas worthy of attention:
Supports: 1.2111-1.2134; 1.21 handle; 1.2246-1.2164; 1.2070.
Resistances: 1.2287; weekly trendline resistances; 1.2276.
GBP/USD:
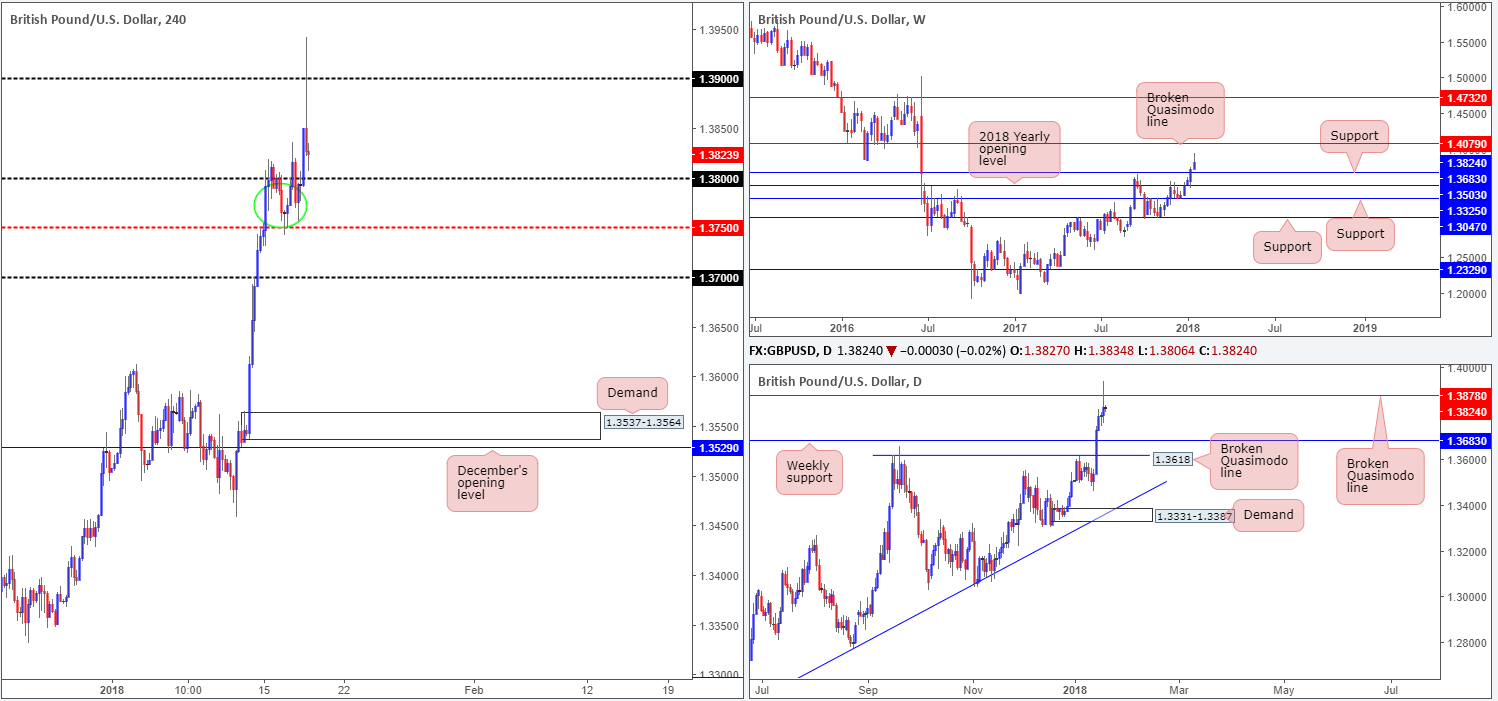
Amid the later hours of US trading on Wednesday, the British pound made a quick run to highs of 1.3834 on the back of dollar weakness, before just as aggressively collapsing to lows of 1.3821. What this recent run higher also accomplished was bringing in a daily broken Quasimodo (resistance) line at 1.3878.
Although H4 price is seen lurking a few pips ahead of the 1.38 handle right now, daily price shows little support in sight until we reach weekly support pegged at 1.3683. Also worthy of note is that in between the 1.38 line and the H4 mid-level support at 1.3750, we see a moderate amount of wood to chop through (support).
Market direction:
Ultimately, for us to be confident regarding bearish direction we would need to see 1.3750 taken out. According to our technicals, this would clear the river south down to at least the 1.37 handle, followed closely by the weekly support mentioned above at 1.3683.
A decisive H4 close below 1.3750, followed up with a strong retest could be a sign that sellers are making another play to push lower. Nearby downside targets for any shorts below 1.3750 would be set at 1.37, 1.3683 and then finally the daily broken Quasimodo line positioned at 1.3618.
Data points to consider: US housing data, Philly Fed manufacturing index and weekly unemployment claims at 1.30pm GMT.
Areas worthy of attention:
Supports: 1.38 handle; 1.3750; 1.3683; 1.3618.
Resistances: 1.39 handle; 1.3878.
AUD/USD:
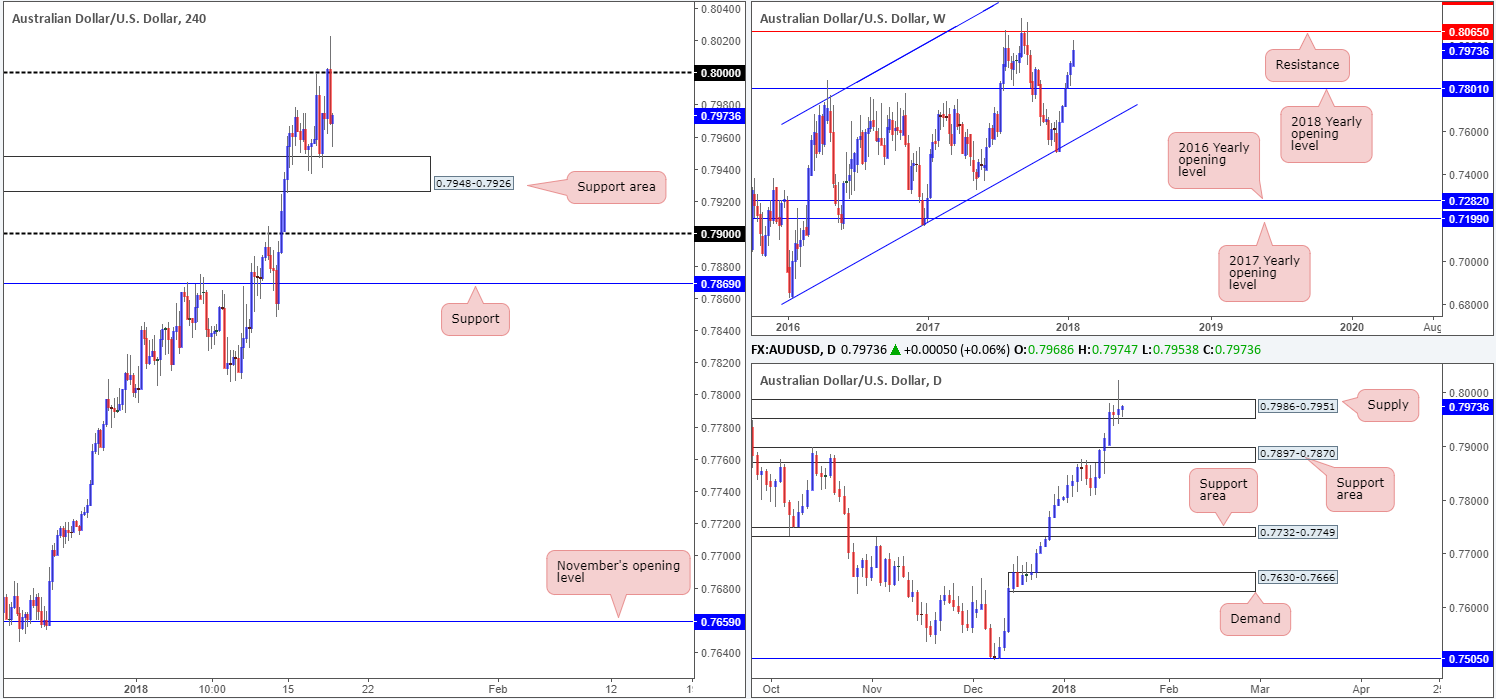
After successfully defending the large psychological number 0.80 during the early hours of trading on Wednesday, the pair took another stab at the number going into the later hours of the US segment as the US dollar probed lower. As you can see, though, H4 price failed to sustain gains past the 0.8022 point, quickly rotating back to lows of 0.7967 on the back of US dollar discovering support.
On the whole, the H4 candles are, to a certain degree, sandwiched between a H4 support area at 0.7948-0.7926 and the 0.80 band. The other key thing to note is that there’s a daily supply also currently in motion at 0.7986-0.7951. A topside breach of 0.80 would, as far as we can see, place weekly resistance at 0.8065 on the hit list. A break of the current H4 support zone, on the other hand, has the 0.79 handle (H4 timeframe) to immediately contend with, followed closely by a daily support area penciled in at 0.7897-0.7870.
Market direction:
Given the structure highlighted above, we believe this to be a rather restricted market at present. With that being the case, we feel that opting to stand on the sidelines may be the better path to take for now.
Data points to consider: Chinese GDP, Fixed asset investment ytd/y, Industrial production y/y and NBS press conference at 7am; US housing data, Philly Fed manufacturing index and weekly unemployment claims at 1.30pm GMT.
Areas worthy of attention:
Supports: 0.7948-0.7926; 0.7897-0.7870.
Resistances: 0.80 handle; 0.8065; 0.7986-0.7951.
USD/JPY:
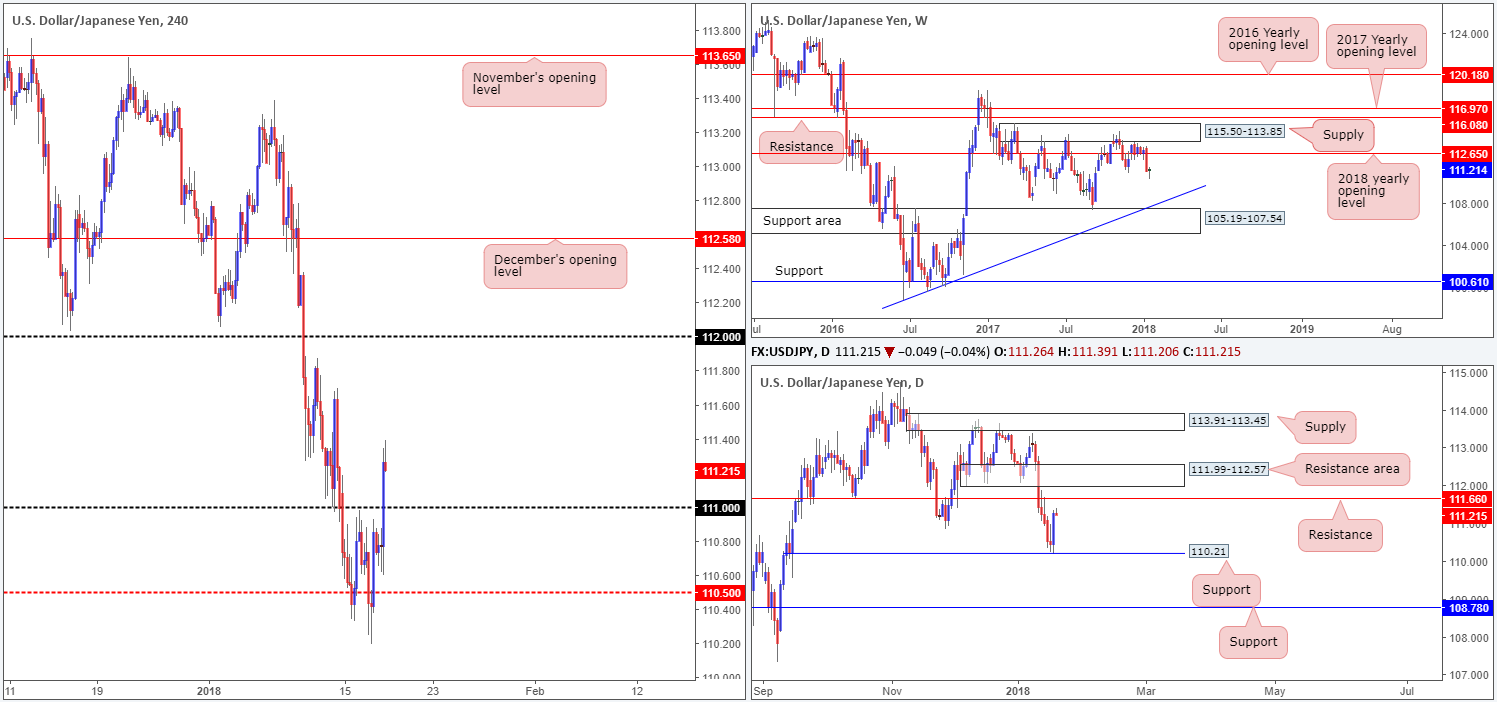
The USD/JPY sported a rather meaningful recovery on Wednesday, engulfing three days of losses in the process. Bolstered by a daily support line seen at 110.21, which happened to print a near-full-bodied bullish candle yesterday, the H4 candles managed to conquer the 111 handle, and reach a high of 111.34.
We do not see much upside resistance on the H4 scale until the 112 handle. Of course, the 111.50 region could act as temporary resistance here, but given recent history, we do not place much weight on this number. Over on the daily timeframe, however, resistance is seen coming in from the 111.66 region, shadowed closely by a daily resistance area plotted at 111.99-112.57.
Market direction:
Buying based on yesterday’s momentum is not a setup we’d label high probability, largely because of the nearby daily resistances. Equally, selling would also be out of the question until we reach the noted daily areas. Between 111.66 and 111.99-112.57 will be a difficult base for buyers to penetrate we believe.
Data points to consider: US housing data, Philly Fed manufacturing index and weekly unemployment claims at 1.30pm GMT.
Areas worthy of attention:
Supports: 111 handle; 110.21.
Resistances: 112 handle; 111.50; 111.66; 111.99-112.57.
USD/CAD:
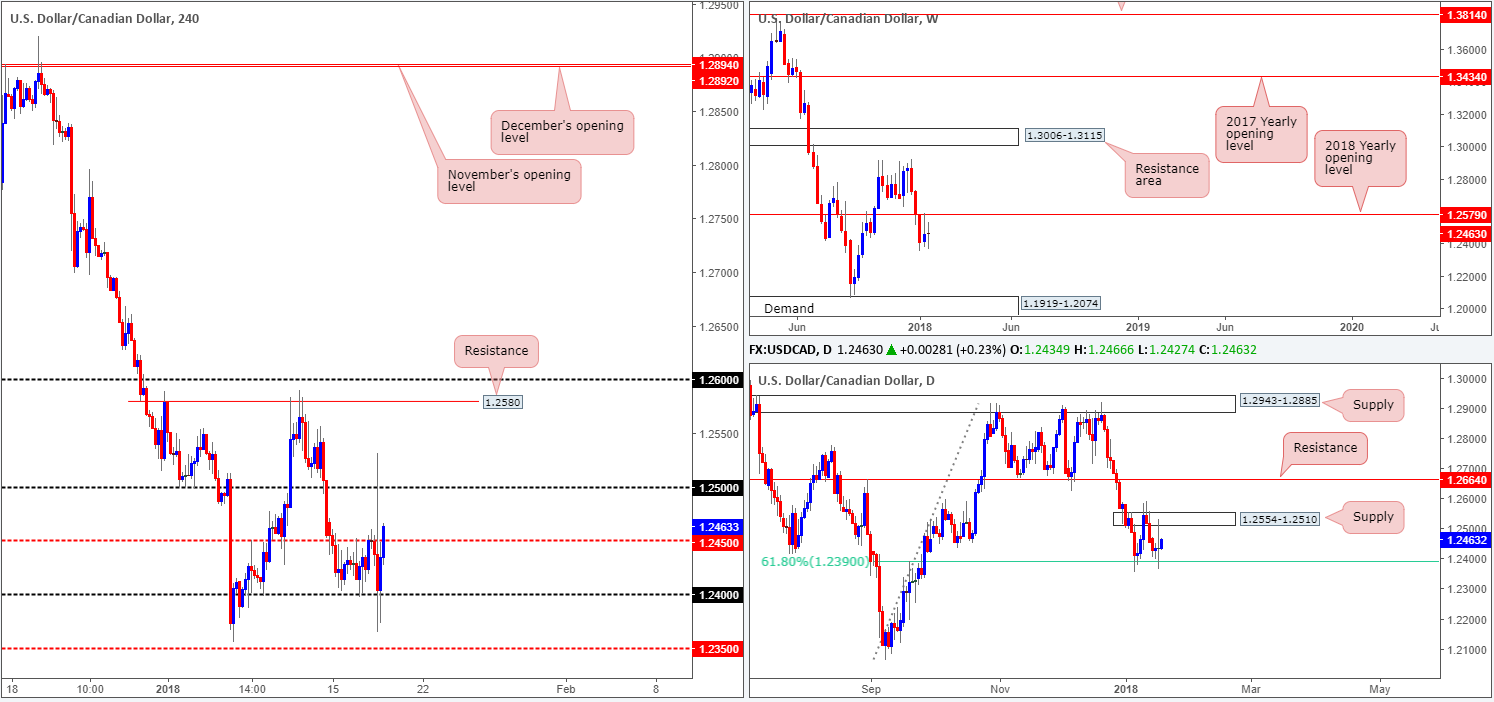
Kicking things off from the top this morning, weekly action continues to consolidate sub 1.2579: the 2018 yearly opening level. Further selling from this point could eventually see the unit tackle a weekly demand area coming in at 1.1919-1.2074. Moving down to the daily candles, we can see that the buyers and sellers remain confined between daily supply at 1.2554-1.2510 and a daily 61.8% Fib support level at 1.2390.
In recent hours, H4 price crossed above the H4 mid-level resistance, following a couple of days of consolidation. Providing that the buyers remain in control, we could see 1.25 brought into play, alongside the lower edge of daily supply mentioned above at 1.2510.
Market direction:
In spite of weekly price suggesting further downside, the daily 61.8% Fib support mentioned above at 1.2390 will likely be tough nut to crack.
Buying above 1.2450 could be good for an intraday break up to 1.25ish, but is not really a trade we’d place a whole lot of weight on.
In the absence of clearer price action, remaining flat may be the best route to take today.
Data points to consider: US housing data, Philly Fed manufacturing index and weekly unemployment claims at 1.30pm; Crude oil inventories at 4pm GMT.
Areas worthy of attention:
Supports: 1.24 handle; 1.2390; 1.1919-1.2074.
Resistances: 1.2450 (potential); 1.25 handle; 1.2554-1.2510.
USD/CHF:
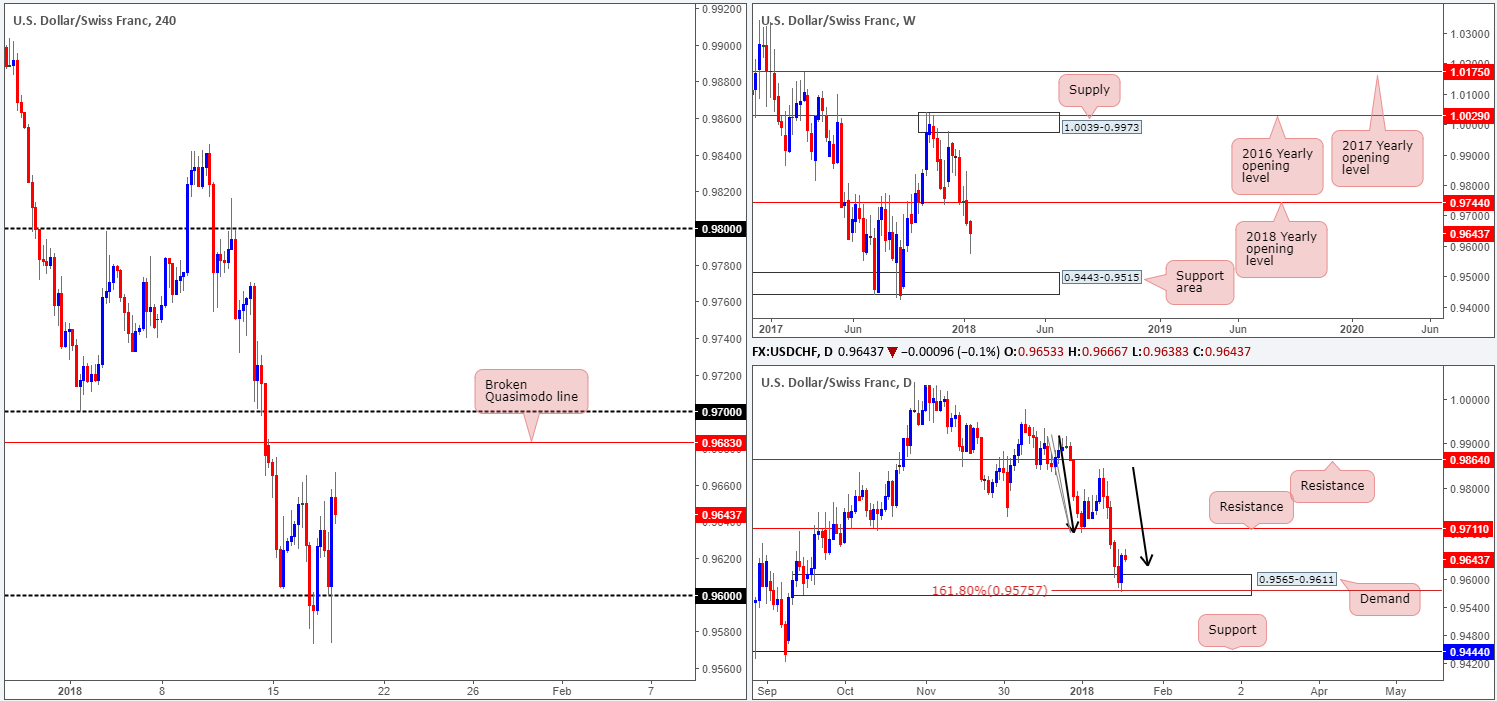
Breaking a five-day bearish phase, the USD/CHF managed to recover some ground on Wednesday, clocking a high of 0.9657. The 0.96 handle seen on the H4 timeframe maintained a defensive posture, which we believe was bolstered by a daily demand base coming in at 0.9565-0.9611, and a daily AB=CD (see black arrows) 161.8% Fib ext. point at 0.9575.
Upside resistance on the H4 timeframe can be seen at a broken Quasimodo line drawn from 0.9683, followed closely by the 0.97 handle. Daily flow places resistance at 0.9711, which happens to boast a reasonably robust history. Weekly movement, on the other hand, offers little direction in terms of structure, since price is seen trading mid-range between the 2018 yearly opening level at 0.9744 and a weekly support area fixed at 0.9443-0.9515.
Market direction:
According to the bigger picture, there is room for the bulls to stretch their legs today. However, traders need to remain cognizant of resistance on the H4 timeframe: 0.9683/0.97, which could potentially pose a problem.
Basing a long trade on the fact that there is room on the higher timeframe to push north is not a trade we would label with any kind of weight. By the same token, selling this unit, knowing we have just rebounded strongly from a daily demand area, is also not something worthy of trading, in our humble view.
Data points to consider: US housing data, Philly Fed manufacturing index and weekly unemployment claims at 1.30pm GMT.
Areas worthy of attention:
Supports: 0.9443-0.9515; 0.9565-0.9611; 0.9575; 0.96 handle.
Resistances: 0.97 handle; 0.9683; 0.9711; 0.9744.
DOW 30:
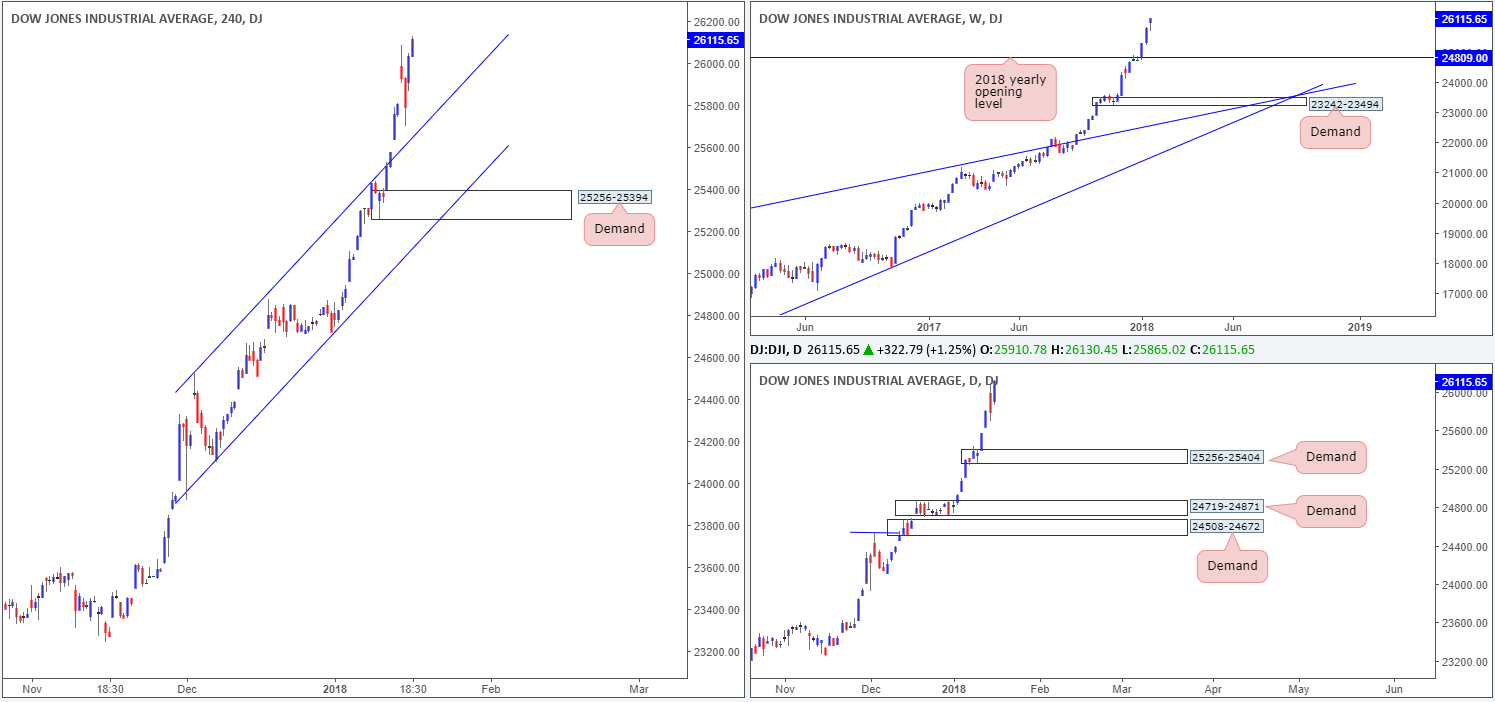
Leaving the H4 channel resistance-turned support (extended from the high 24534) unchallenged on Wednesday, US equities punched north and recorded a fresh record high of 26130. Despite the increase in value, there’s still a good chance that we may eventually see the index dip lower and retest the said H4 structure. A violation of this line, however, would likely clear the river south down to at least the H4 demand base sitting at 25256-25394. Also of particular interest is that this H4 demand is located within the lower limits of daily demand registered at 25256-25404.
Market direction:
Not much change since yesterday’s report, we’re afraid:
Levels of interest are as follows:
- Look to trade any retest seen off of the recently broken H4 channel resistance-turned support.
- Failing that, look for price to dip lower and test the H4 demand at 25256-25394. As this area is housed within the lower limits of the aforementioned daily demand, the odds of price responding from this zone are high, in our view.
Data points to consider: US housing data, Philly Fed manufacturing index and weekly unemployment claims at 1.30pm GMT.
Areas worthy of attention:
Supports: H4 channel support; 25256-25394; 25256-25404.
Resistances: …
GOLD:
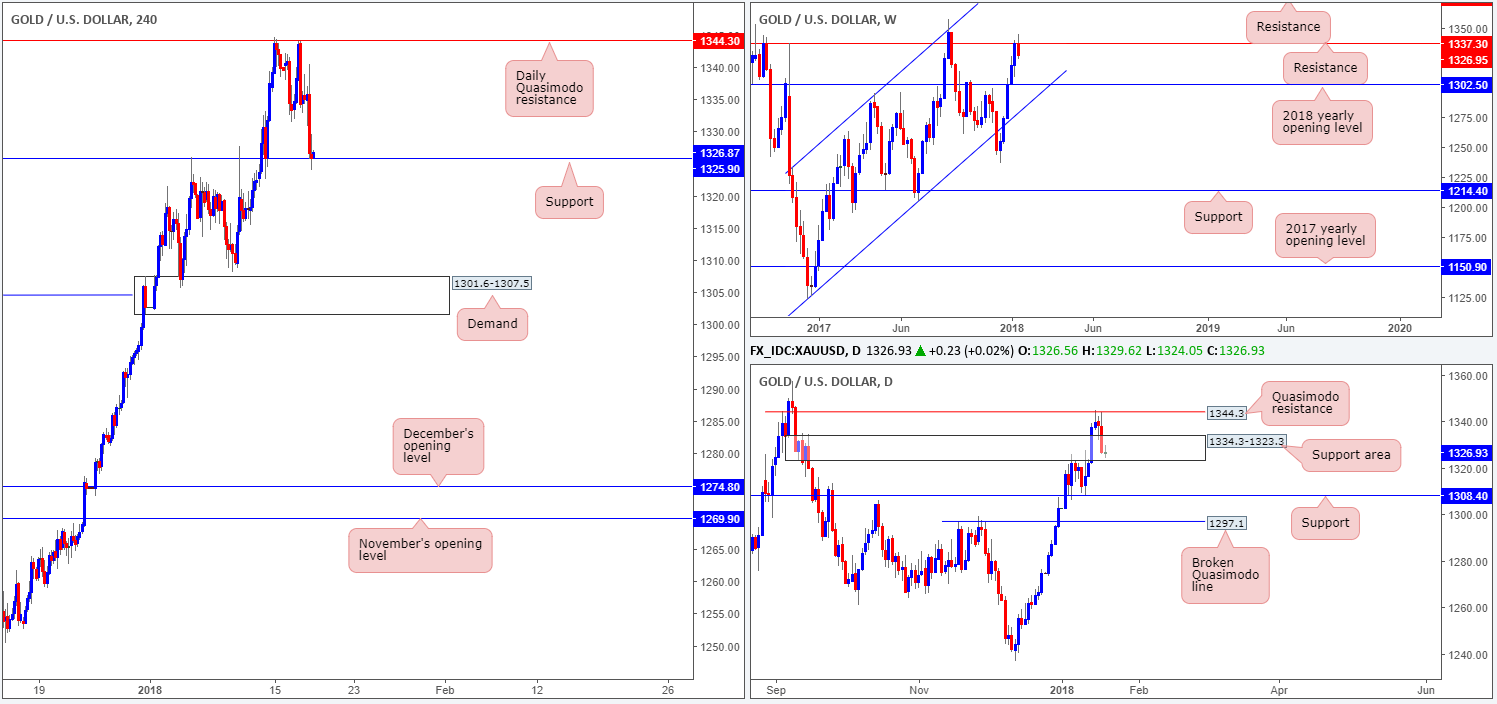
With an increase seen in dollar bids during Wednesday’s segment, the gold market took a turn for the worse and concluded the day in losses.
From a technical standpoint, a selloff was entirely possible. On the weekly timeframe, resistance is seen coming in from the 1337.3 angle, while a little lower on the curve we had a daily Quasimodo resistance line at 1344.3 in play. In consequence to the recent bout of selling, however, the gold market has traded deep within the walls of a daily support area at 1334.3-1323.3, and shook hands with a H4 support level marked at 1325.9. Whether or not these levels are able to withstand the current selling pressure is difficult to judge at this point.
Market direction:
Entering into a long play from the aforesaid H4 support level is likely tempting for a lot of traders that have noted the current daily demand area. However, buying from here entails buying into potential weekly flow, which, as you can probably see, shows room to extend as far south as the 2018 yearly opening level at 1302.5!
Whichever direction one selects today, opposition is clearly seen from both ends. In situation such as these, remaining on the sidelines is typically the safer pathway to take, in our opinion.
Areas worthy of attention:
Supports: 1325.9; 1334.3-1323.3; 1302.5.
Resistances: 1337.3; 1344.3.
This site has been designed for informational and educational purposes only and does not constitute an offer to sell nor a solicitation of an offer to buy any products which may be referenced upon the site. The services and information provided through this site are for personal, non-commercial, educational use and display. IC Markets does not provide personal trading advice through this site and does not represent that the products or services discussed are suitable for any trader. Traders are advised not to rely on any information contained in the site in the process of making a fully informed decision.
This site may include market analysis. All ideas, opinions, and/or forecasts, expressed or implied herein, information, charts or examples contained in the lessons, are for informational and educational purposes only and should not be construed as a recommendation to invest, trade, and/or speculate in the markets. Any trades, and/or speculations made in light of the ideas, opinions, and/or forecasts, expressed or implied herein, are committed at your own risk, financial or otherwise.
The use of the site is agreement that the site is for informational and educational purposes only and does not constitute advice in any form in the furtherance of any trade or trading decisions.
The accuracy, completeness and timeliness of the information contained on this site cannot be guaranteed. IC Markets does not warranty, guarantee or make any representations, or assume any liability with regard to financial results based on the use of the information in the site.
News, views, opinions, recommendations and other information obtained from sources outside of www.icmarkets.com.au, used in this site are believed to be reliable, but we cannot guarantee their accuracy or completeness. All such information is subject to change at any time without notice. IC Markets assumes no responsibility for the content of any linked site. The fact that such links may exist does not indicate approval or endorsement of any material contained on any linked site.
IC Markets is not liable for any harm caused by the transmission, through accessing the services or information on this site, of a computer virus, or other computer code or programming device that might be used to access, delete, damage, disable, disrupt or otherwise impede in any manner, the operation of the site or of any user’s software, hardware, data or property.


