
EUR/USD:
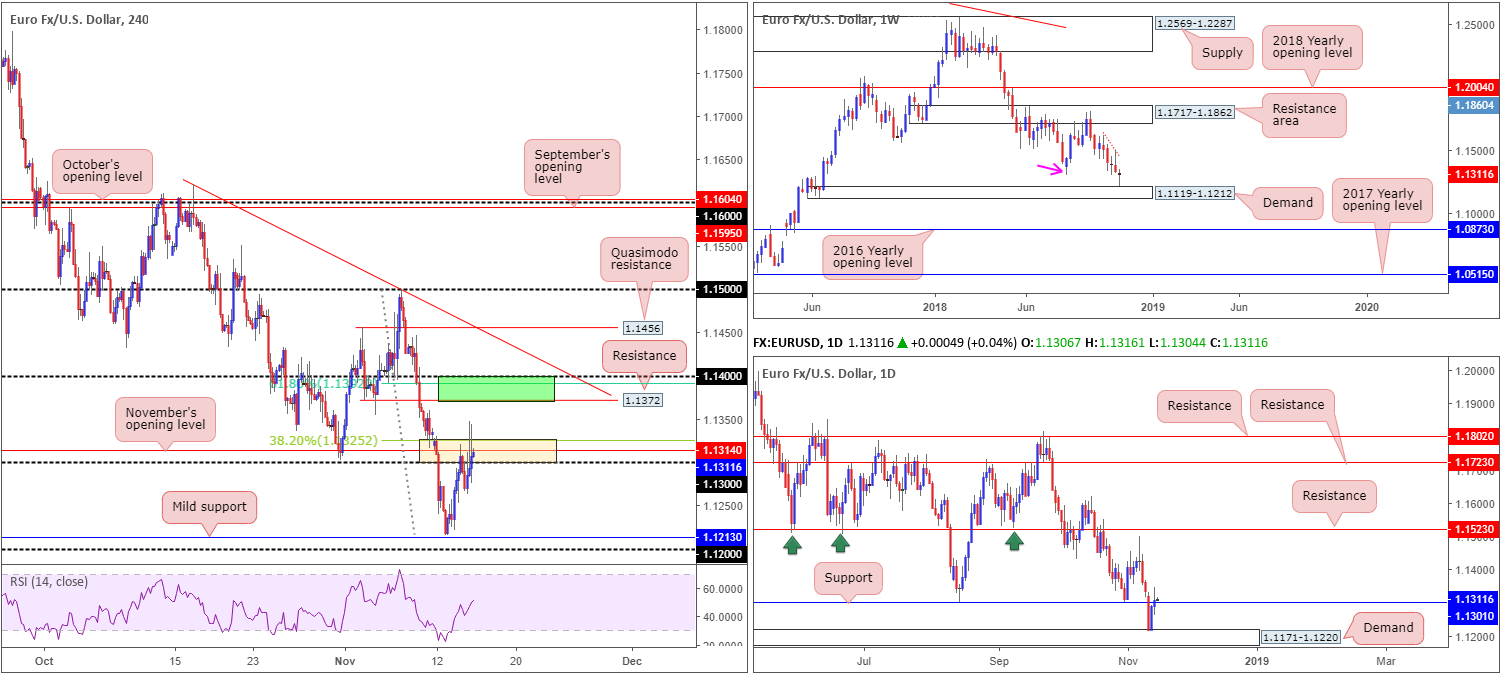
Since the pair bottomed just north of weekly demand at 1.1119-1.1212, price has sported a reasonably bullish tone. Although the unit may endure some selling pressure around 1.1310 (the swing resistance marked with a pink arrow), the path appears relatively clear towards the weekly resistance area at 1.1717-1.1862.
Daily resistance at 1.1310 (also seen as a swing resistance on the weekly timeframe, though now marked as support on the daily timeframe) suffered a marginal breach to the upside yesterday, registering its second consecutive daily gain since bottoming around daily demand at 1.1171-1.1220. Assuming the market defends 1.1310 as support, the next upside target resides around the 1.1499 Nov 7 high, trailed closely by daily resistance plotted at 1.1523.
Wednesday’s briefing offered the 1.1325/1.13 region as a potential H4 sell zone (comprised of the round number 1.13, November’s opening level at 1.1314 and a 38.2% Fib resistance at 1.1325 [light yellow zone]). As you can see, price responded to the zone amid early Asia and dropped 50 pips to lows of 1.1263. Therefore, this should have been a breakeven/mildly profitable trade, if handled correctly. As the markets entered US trade, the euro attracted fresh buyers and pushed to highs of 1.1347, though was unable to close above November’s opening level at 1.1314.
Areas of consideration:
In the event H4 price overthrows 1.1325/1.13, traders’ crosshairs are likely going to be fixed on the 1.14/1.1.1372 neighbourhood for a possible bounce lower. Shaded in green, this area is comprised of the 1.14 handle, a 61.8% Fib resistance value at 1.1392 and a resistance level at 1.1372. Why only a bounce given the number of closely converging H4 structures? There’s limited higher-timeframe resistance – the closest structure is seen around the 1.1499 Nov 7 high.
Conservative traders may opt to wait and see how H4 price action behaves before pulling the trigger. A bearish candlestick formation would help confirm seller interest, and also provide entry/stop parameters. Aggressive traders, on the other hand, will likely enter short from 1.1372 with stop-loss orders planted a few pips beyond 1.14.
In regard to downside targets from 1.14/1.1.1372, November’s opening level mentioned above at 1.1314 appears a logical starting point.
Today’s data points: US Retail sales m/m; Philly Fed manufacturing index; FOMC member Quarles speaks; Fed Chair Powell speaks; FOMC member Bostic speaks.
GBP/USD:
The pound, unsurprisingly, experienced a volatile session Wednesday following news UK PM May secured Cabinet support for her Brexit deal. However, according to reports out of the BBC, UK PM May is likely to face leadership challenge today. Several hard-line Brexiters have already submitted no-confidence motions against the PM independently.
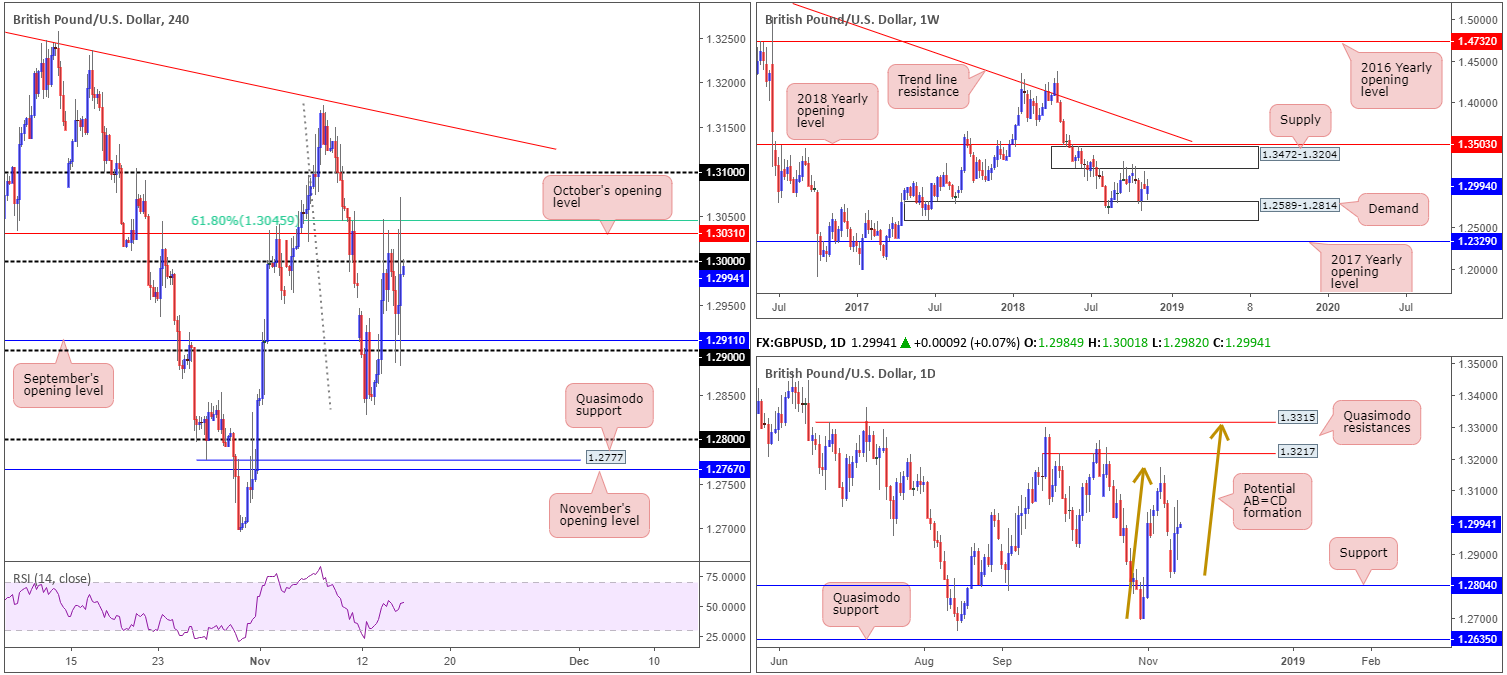
In terms of the technical picture, H4 price action, although somewhat chaotic, found support off its 1.29 handle and resistance from October’s opening level priced in at 1.3031/61.8% Fib resistance at 1.3046. A break of 1.3031/1.3046 has 1.31 to target, whereas a decisive breach of 1.29 could see the pair make a run for the 1.2827 Nov 12 low/1.28 handle.
As for the market’s position on the weekly timeframe, the unit remains confined between supply drawn from 1.3472-1.3204 and demand coming in at 1.2589-1.2814. Lower on the curve, daily movement shows room to press as far north as the 1.3073 Nov 7 high, shadowed closely by 1.3217: a Quasimodo resistance level. Another point worth mentioning is the possibility of an AB=CD bearish formation completing (brown arrows) at a nearby Quasimodo resistance level carved from 1.3315.
Areas of consideration:
As of current price, the H4 candles are seen toying with the underside of 1.30. While selling from here may appear attractive to some given the reasonably clear run towards 1.29ish, the recent fakeouts above this number to October’s opening level mentioned above at 1.3031 raises a red flag, in our humble opinion (sellers could potentially be weak here).
With further volatility expected to hit GBP markets today, traders are urged to employ a cautious stance. Technical levels are great under normal trading conditions, though in times of political uncertainty levels can very easily be wiped out.
Today’s data points: UK retail sales m/m; MPC member Tenreyro speaks; US Retail sales m/m; Philly Fed manufacturing index; FOMC member Quarles speaks; Fed Chair Powell speaks; FOMC member Bostic speaks.
AUD/USD:
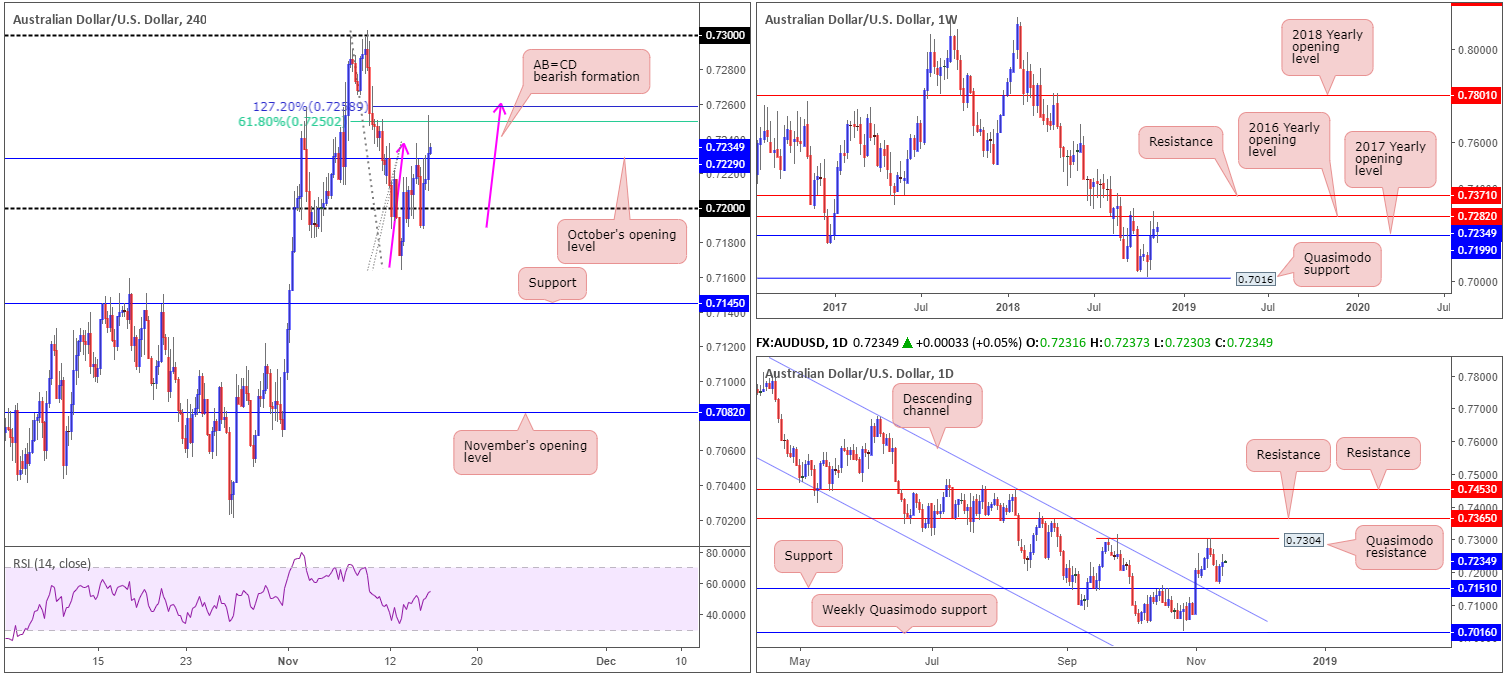
The Australian dollar retained its bullish tone Wednesday on the back of broad-based USD weakness, consequently recording a second consecutive daily gain. Although the H4 candles recently overthrew October’s opening level at 0.7229, resistance in the form of a 61.8% Fib resistance at 0.7250 is in play (positioned just south of an AB=CD [pink arrows] 127.2% bearish pattern at 0.7258).
According to weekly structure, further buying could be in store. This week has witnessed a test of its 2017 yearly opening level at 0.7199 (support), with scope to push towards the 2016 yearly opening base at 0.7282. Note this level is positioned ABOVE the current H4 resistances!
Daily price also recently found support just north of 0.7151 and its closely positioned channel resistance-turned support (taken from the high 0.8135). The next upside target on this scale falls in around 0.7304: a Quasimodo resistance level – again ABOVE the current H4 resistances.
Areas of consideration:
Having seen both weekly and daily structure indicate further buying could be observed, selling the H4 AB=CD 127.2% formation at 0.7258/61.8% H4 Fib resistance at 0.7250 is a chancy move, according to our technical studies.
Instead, focus now draws to possible longs on a retest of October’s opening level mentioned above at 0.7229 (retest preferably in the shape of a bullish candlestick formation as this helps provide entry/stop parameters), targeting the 2017 yearly opening level at 0.7282 on the weekly timeframe, followed by the daily Quasimodo resistance at 0.7304.
Today’s data points: Australian job’s data; RBA Assist Gov. Debelle speaks; US Retail sales m/m; Philly Fed manufacturing index; FOMC member Quarles speaks; Fed Chair Powell speaks; FOMC member Bostic speaks.
USD/JPY:
A selloff in US equities, along with a waning US dollar, weighed on the USD/JPY market amid US hours Wednesday.
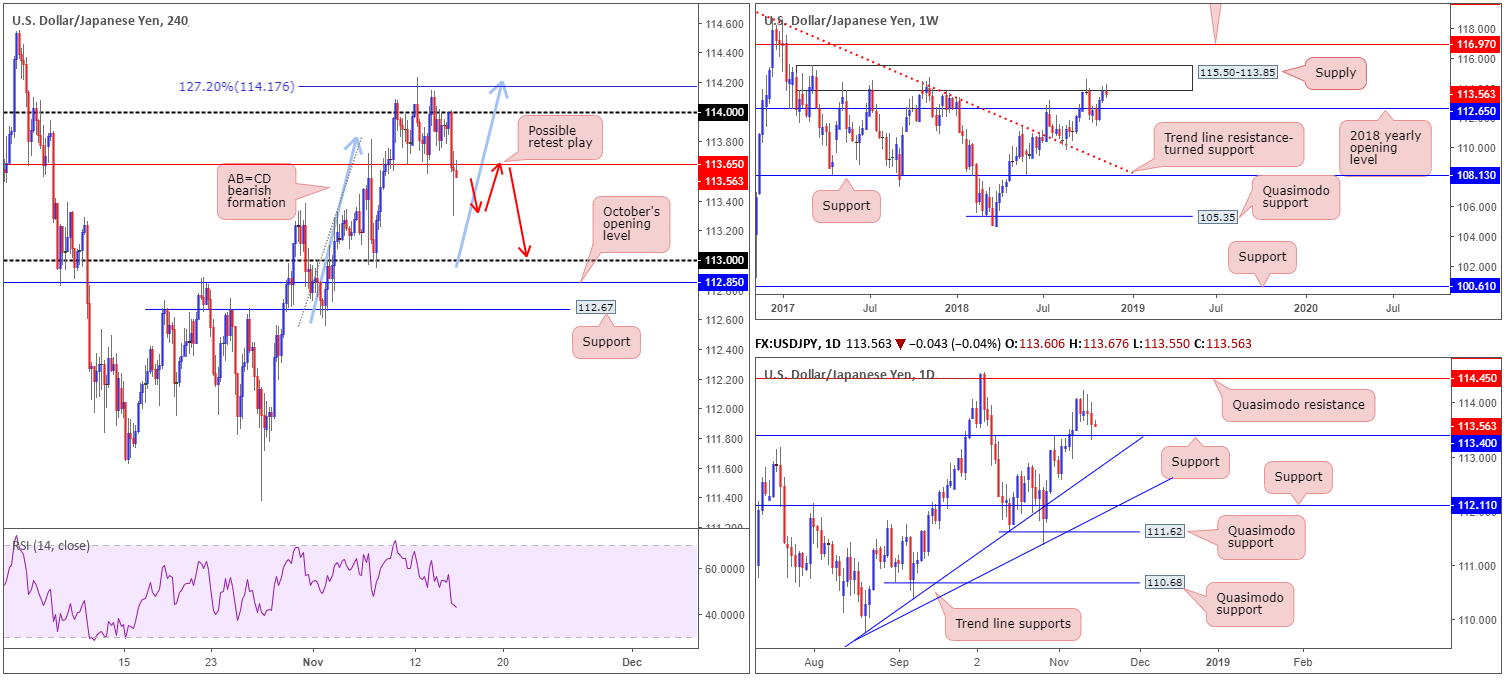
For a while now, our reports drew focus towards the 114.17 neighbourhood: a 127.2% (Fib ext.) H4 AB=CD (blue arrows) completion. The main attraction here was it completed around the underside of a weekly supply at 115.50-113.85, though having the 114 handle plotted nearby was also appealing.
Those who remained short from 114.17 have likely liquidated the majority of their position already, owing to price reaching a crucial take-profit target: daily support at 113.40. Final support targets reside around the 113 handle, October’s opening level at 112.85 and finally the H4 support at 112.67, which happens to merge nicely with the 2018 yearly opening level on the weekly timeframe at 112.65 (essentially the next downside target on the weekly timeframe from the current supply).
Areas of consideration:
On the whole, we feel further selling is still likely in this market, despite recently making contact with daily support at 113.40. The current weekly supply has an incredibly strong history dating as far back as mid-2017.
On account of the above reading, a retest play of H4 resistance at 113.65 is an option today (red arrows), targeting 113 as the initial port of call. In view of this resistance emphasizing more of a local presence, however, waiting for additional candlestick confirmation to form prior to pulling the trigger is advised (entry/stop parameters can be defined by the candlestick structure).
Today’s data points: US Retail sales m/m; Philly Fed manufacturing index; FOMC member Quarles speaks; Fed Chair Powell speaks; FOMC member Bostic speaks.
USD/CAD:
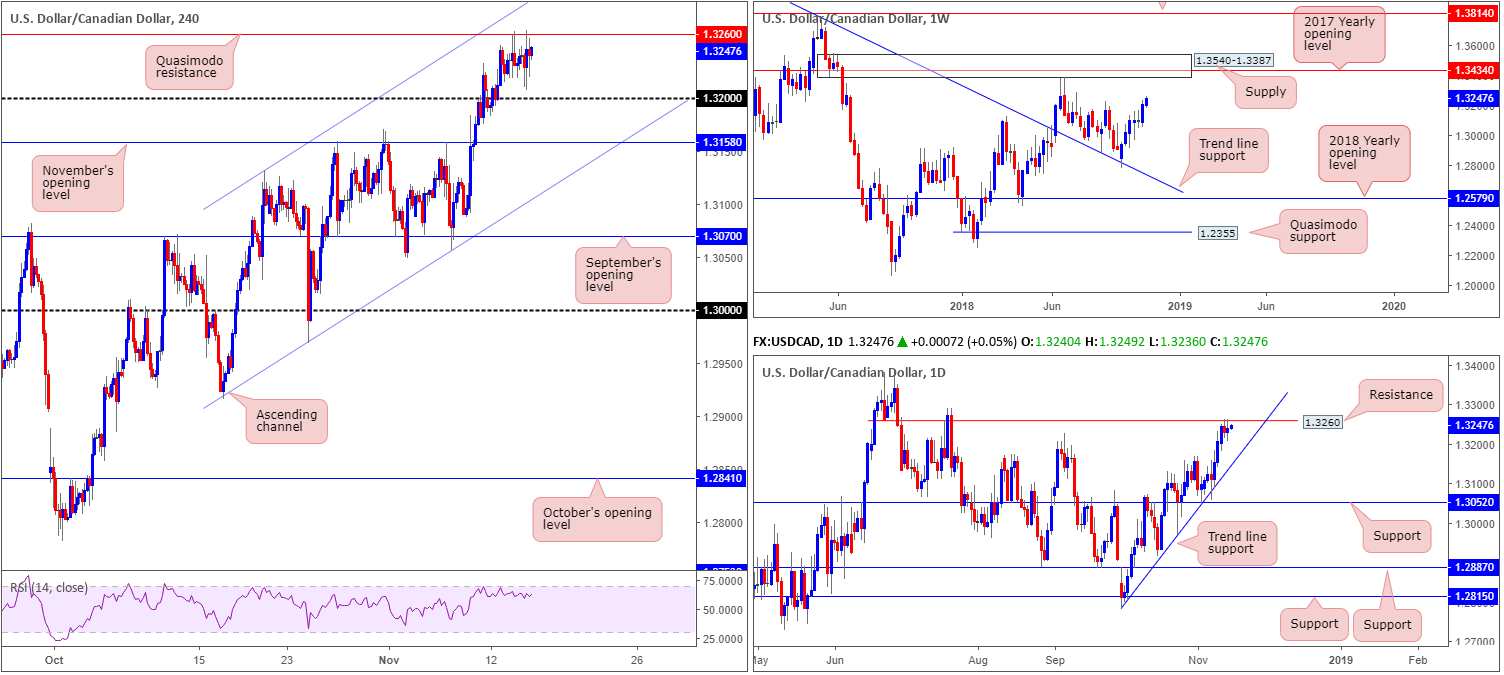
Upward momentum continues to demonstrate signs of waning after shaking hands with H4 Quasimodo resistance at 1.3260, aided by a mild recovery in crude oil which snapped a 12-day losing streak, and an overall weaker USD. What gives 1.3260 extra credibility is this level also denotes daily resistance as well. From the daily scale, movement lower could potentially stretch as far south as trend line support (extended from the low 1.2782).
While resistance is clearly visible on the H4 and daily timeframes, likely drawing in sellers’ attention, there is one caveat to bear in mind. Weekly price action displays limited resistance in this market until connecting with supply coming in at 1.3540-1.3387 (happens to hold the 2018 yearly opening level within at 1.3434), therefore further buying is a possibility.
Areas of consideration:
As highlighted in previous reports, the initial downside target for those looking to (or already are) short from 1.3260 rests around the 1.32 handle. Following this, November’s opening level at 1.3158 is next in line. Stop-loss placement on a short from 1.3260 remains best positioned above the H4 channel resistance (around 1.3285ish). Nevertheless, do remain cognizant of the weekly timeframe here, traders. Any sign of strong bullish candles entering the market may be an indication to consider exiting the trade, irrespective of whether the H4 candles have tested 1.32 or not.
Today’s data points: US Retail sales m/m; Philly Fed manufacturing index; FOMC member Quarles speaks; Fed Chair Powell speaks; FOMC member Bostic speaks; Crude oil inventories.
USD/CHF:
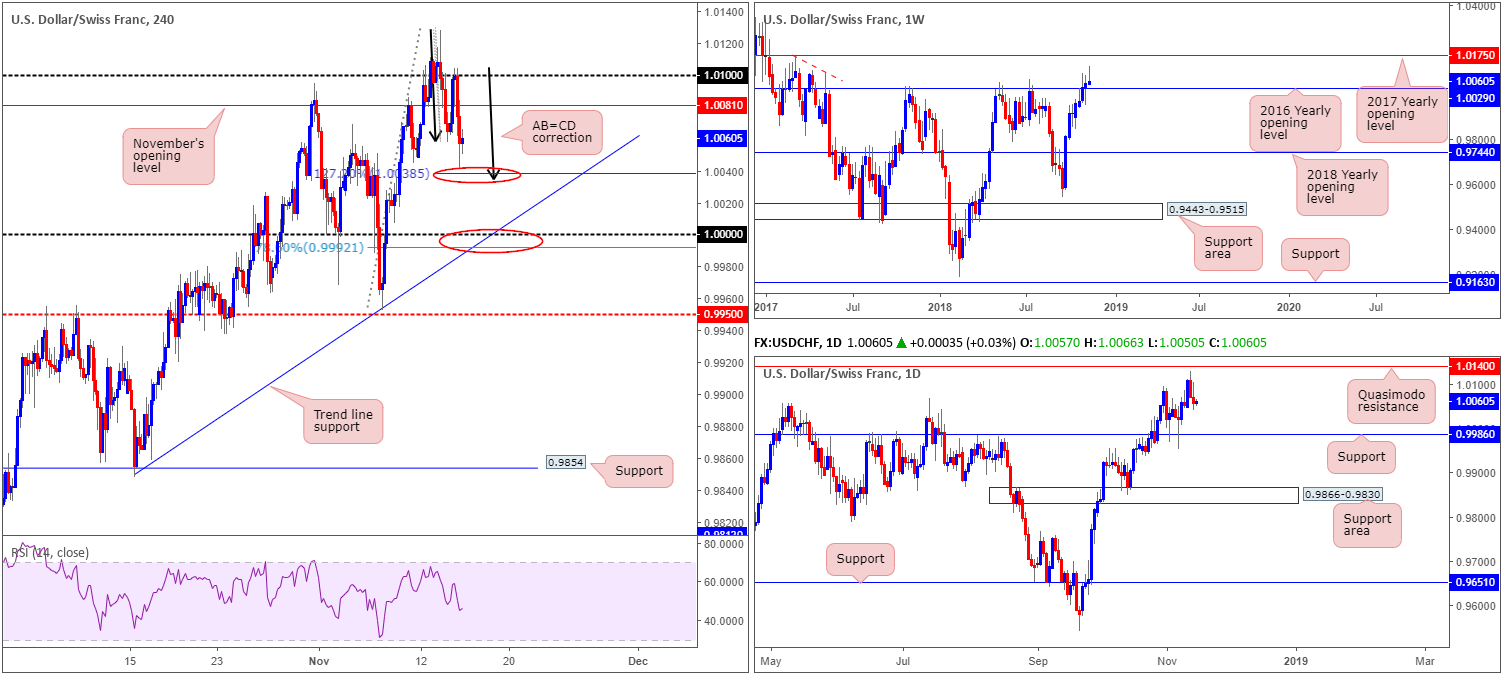
With the EUR/USD recording its second consecutive daily gain, it should not come as a surprise to see the USD/CHF register similar, only inverse. As can be seen from the H4 chart this morning, the unit retested the underside of its 1.01 handle and pressed for lower ground, consequently forming a nice-looking AB=CD correction pattern around the 1.0038 region (127.2% Fib ext. point). By and of itself, this will likely attract buyers into the market, given it is located nearby the 2016 yearly opening level at 1.0029 on the weekly timeframe.
Still, despite this, parity (1.0000) also remains an appealing level, fusing with a H4 trend line support (etched from the low 0.9847) and a 78.6% H4 Fib support at 0.9992. In addition to this, parity is seen positioned just north of daily support coming in at 0.9986.
Areas of consideration:
Based on our technical studies, two areas of support are in the offing today:
- The AB=CD completion point at 1.0038 (note a fakeout beneath this level to the 2016 yearly opening level at 1.0029 on the weekly timeframe is expected) could potentially hold price higher, with an initial target residing around November’s opening level at 1.0081.
- 1.0000, thanks to its converging support on the H4 and daily timeframe, is an area buyers also likely have their crosshairs fixed on. As price has yet to complete its approach, it is difficult to accurately decide on a first take-profit target, though as it stands 1.0050ish appears logical.
Conservative traders may opt to wait and see how H4 price action behaves before pulling the trigger at each of the above said levels. A bullish candlestick formation would help confirm seller interest, and also provide entry/stop parameters.
Today’s data points: US Retail sales m/m; Philly Fed manufacturing index; FOMC member Quarles speaks; Fed Chair Powell speaks; FOMC member Bostic speaks.
Dow Jones Industrial Average:
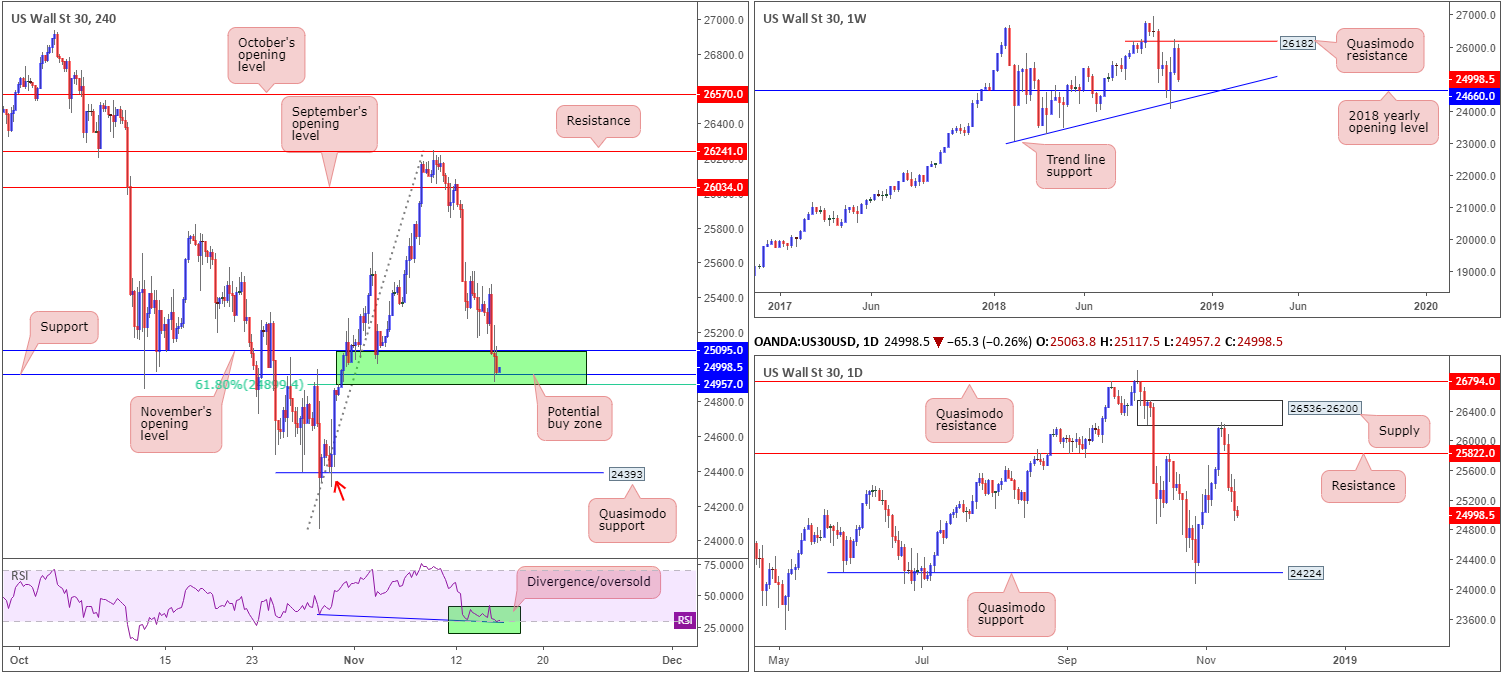
Down in excess of 1.00%, the financial-heavy DJIA logged its fourth consecutive daily loss Wednesday. As a result of this, H4 flow is seen treading water within the walls of a potential buy zone shaded in green at 24899/25095. Comprised of a 61.8% Fib support at 24899, a support level at 24957, November’s opening level at 25095 and the RSI indicator suggesting divergence/oversold conditions, a bullish response may be seen from here. Though judging by the current candles, enthusiasm appears lacking.
In the event the index explores ground beneath 24899/25095, the next area of interest falls in around a H4 Quasimodo support brought in from 24393. What’s notable about this level from a technical perspective is its connection with higher-timeframe structure. Above, we can see the 2018 yearly opening level located at 24660, while directly below it we also have a proven daily Quasimodo support at 24224.
Areas of consideration:
In view of the limited higher-timeframe convergence out of 24899/25095, along with lackluster H4 candles, traders may want to consider waiting for additional candlestick confirmation before pulling the trigger on longs here. Not only will this help avoid an unnecessary loss, it’ll provide entry/stop parameters.
As for the H4 Quasimodo support mentioned above at 24393, a number of possible entry techniques are available here:
- Simply enter long from 24393 and position the stop-loss order beneath the H4 Quasimodo apex at 24065.
- Once again, enter long from 24393, though on this occasion position stop-loss orders beneath the tail at 24309 (red arrow). This is effectively an aggressive approach whereby one uses the demand area that’s connected to the H4 Quasimodo formation.
- And finally, conservative traders could wait for additional candlestick confirmation and enter based on the structure’s rules.
In terms of take-profit targets, the initial objective from 24899/25095 is reasonably close by at 25400ish, while from 24393, as of current market price, support (which would be resistance at that time) at 24957 appears a logical starting block.
Today’s data points: US Retail sales m/m; Philly Fed manufacturing index; FOMC member Quarles speaks; Fed Chair Powell speaks; FOMC member Bostic speaks.
XAU/USD (Gold):
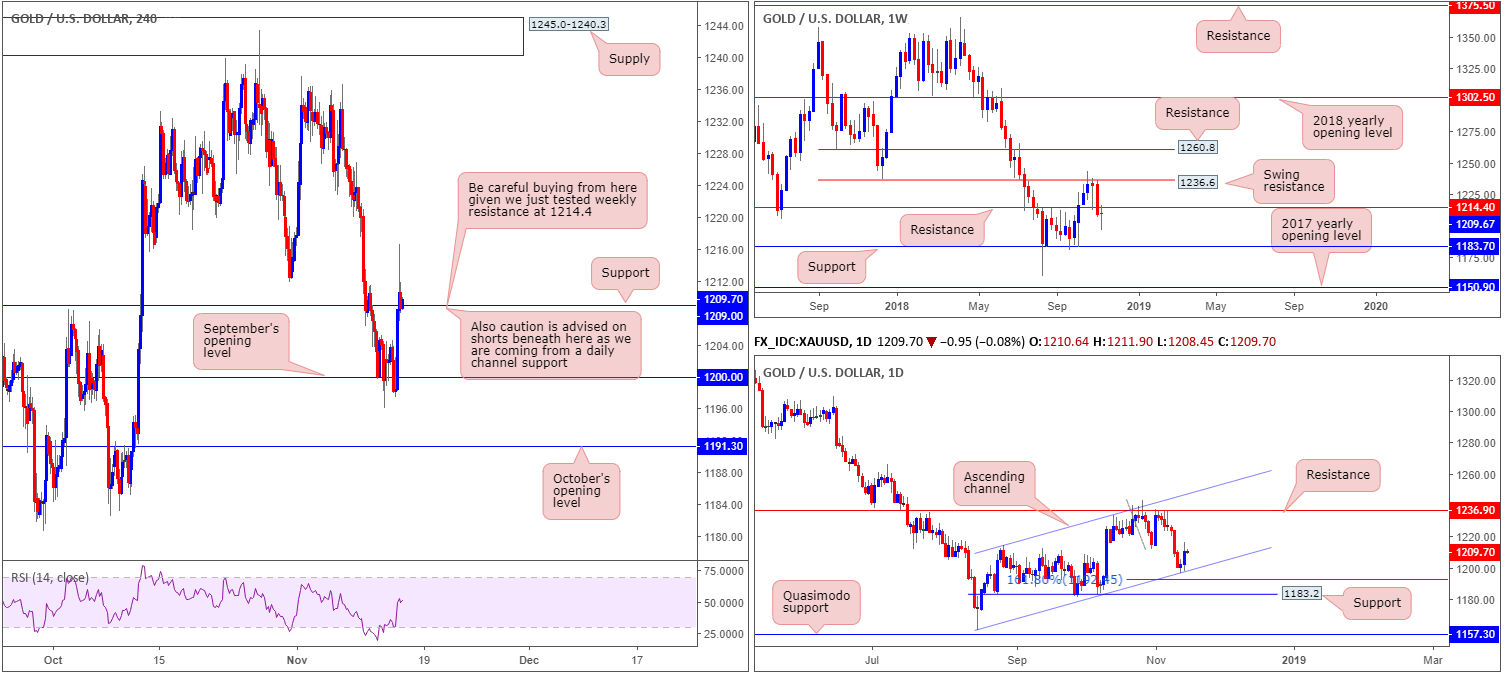
For traders who read Wednesday’s briefing you may recall the piece underlined a potential buying opportunity should H4 price retest September’s opening level at 1200.0. As is evident from the chart, the setup played out beautifully and went on to overthrow H4 resistance at 1209.0 (now acting support). Well done to any of our readers who managed to jump aboard this train.
While overcoming H4 resistance is a desirable sight for buyers, the weekly timeframe shows price crossed swords with a weekly resistance at 1214.4. Though, to confuse things further, daily price shows room to potentially advance as far north as resistance at 1236.9, followed by channel resistance (taken from the high 1214.3), following a recent test of channel support (extended from the low 1160.3).
Areas of consideration:
With weekly and daily timeframes presenting opposing structure, along with H4 price currently trading undecided around 1209.0, opting to remain flat in this market is something to consider.
Irrespective of the direction one selects, conflicting structure is openly visible.
The use of the site is agreement that the site is for informational and educational purposes only and does not constitute advice in any form in the furtherance of any trade or trading decisions.
The accuracy, completeness and timeliness of the information contained on this site cannot be guaranteed. IC Markets does not warranty, guarantee or make any representations, or assume any liability with regard to financial results based on the use of the information in the site.
News, views, opinions, recommendations and other information obtained from sources outside of www.icmarkets.com.au, used in this site are believed to be reliable, but we cannot guarantee their accuracy or completeness. All such information is subject to change at any time without notice. IC Markets assumes no responsibility for the content of any linked site. The fact that such links may exist does not indicate approval or endorsement of any material contained on any linked site.
IC Markets is not liable for any harm caused by the transmission, through accessing the services or information on this site, of a computer virus, or other computer code or programming device that might be used to access, delete, damage, disable, disrupt or otherwise impede in any manner, the operation of the site or of any user’s software, hardware, data or property.


