
Waiting for lower timeframe confirmation is our main tool to confirm strength within higher timeframe zones, and has really been the key to our trading success. It takes a little time to understand the subtle nuances, however, as each trade is never the same, but once you master the rhythm so to speak, you will be saved from countless unnecessary losing trades. The following is a list of what we look for:
- A break/retest of supply or demand dependent on which way you’re trading.
- A trendline break/retest.
- Buying/selling tails/wicks – essentially we look for a cluster of very obvious spikes off of lower timeframe support and resistance levels within the higher timeframe zone.
- Candlestick patterns. We tend to stick with pin bars and engulfing bars as these have proven to be the most effective.
We typically search for lower-timeframe confirmation between the M15 and H1 timeframes, since most of our higher-timeframe areas begin with the H4. Stops are usually placed 1-3 pips beyond confirming structures.
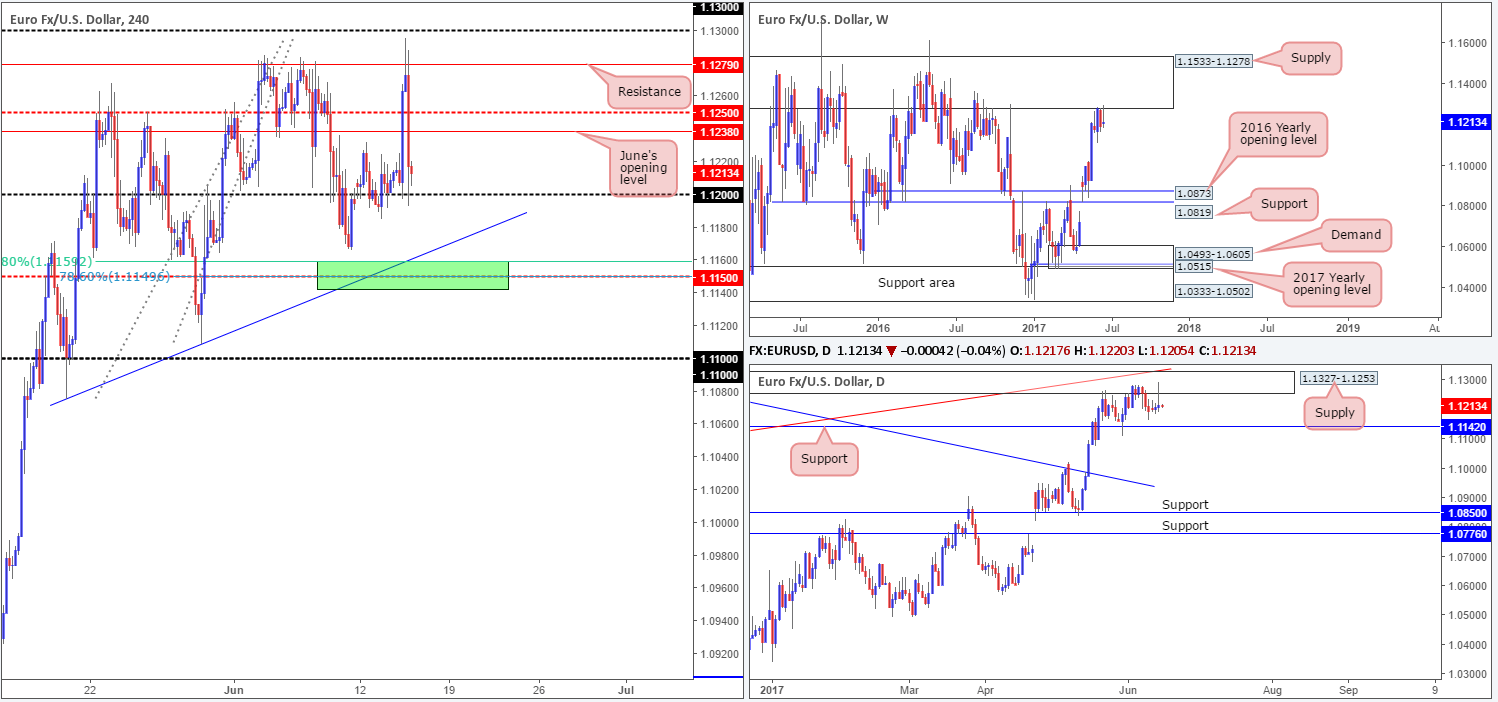
EUR/USD:
Following disappointing US inflation and retail sales data on Wednesday, the EUR/USD surged north from the 1.12 handle and topped just ahead of the 1.13 line. It was from this point that we saw the pair give back all of its daily gains as the FOMC decided to increase its benchmark rate by 25bps, consequently bringing price back down to the 1.12 handle going into the closing bell. Despite the gyrations seen during yesterday’s segment, the unit, once again, found support off 1.12. With that in mind, much of the following report will echo similar thoughts put forward in Wednesday’s analysis…
Directly overhead on the H4 chart we have June’s opening level at 1.1238, followed closely by the mid-level resistance at 1.1250. Below 1.12, there’s little support seen until price connects with the mid-level barrier at 1.1150.
A quick look at the weekly chart shows that the single currency remains trading around the underside of a major supply at 1.1533-1.1278. Managing to cap upside since May 2015, this is not an area one should overlook. Looking down to the daily timeframe, however, the candles are now seen sandwiched between supply coming in at 1.1327-1.1253 and support pegged at 1.1142.
Our suggestions: Based on the above notes our desk has shown interest around the 1.1150 neighborhood, due to the base converging with the following structures (green area):
- A H4 trendline support etched from the low 1.1075.
- A H4 61.8% Fib support at 1.1159 drawn from the low 1.1074.
- A H4 78.6% retracement level pegged at 1.1149 penciled in from the low 1.1109.
- A daily support level seen at 1.1142.
Seeing as how this zone is rather small, we will not be placing pending buy orders here. Instead, we’ve chosen to wait for a reasonably sized H4 bull candle to form, preferably a full-bodied candle. This will help prove buyer interest exists here which IS necessary due to where price is trading from on the weekly chart right now.
Data points to consider: US Weekly unemployment claims and the Empire state manufacturing index figures at 1.30pm, US Industrial production and Capacity utilization rate at 2.15pm GMT+1.
Levels to watch/live orders:
- Buys: 1.1150 region ([waiting for a reasonably sized H4 bull candle – preferably a full-bodied candle – to form before pulling the trigger is advised] stop loss: ideally beyond the candle’s tail).
- Sells: Flat (stop loss: N/A).
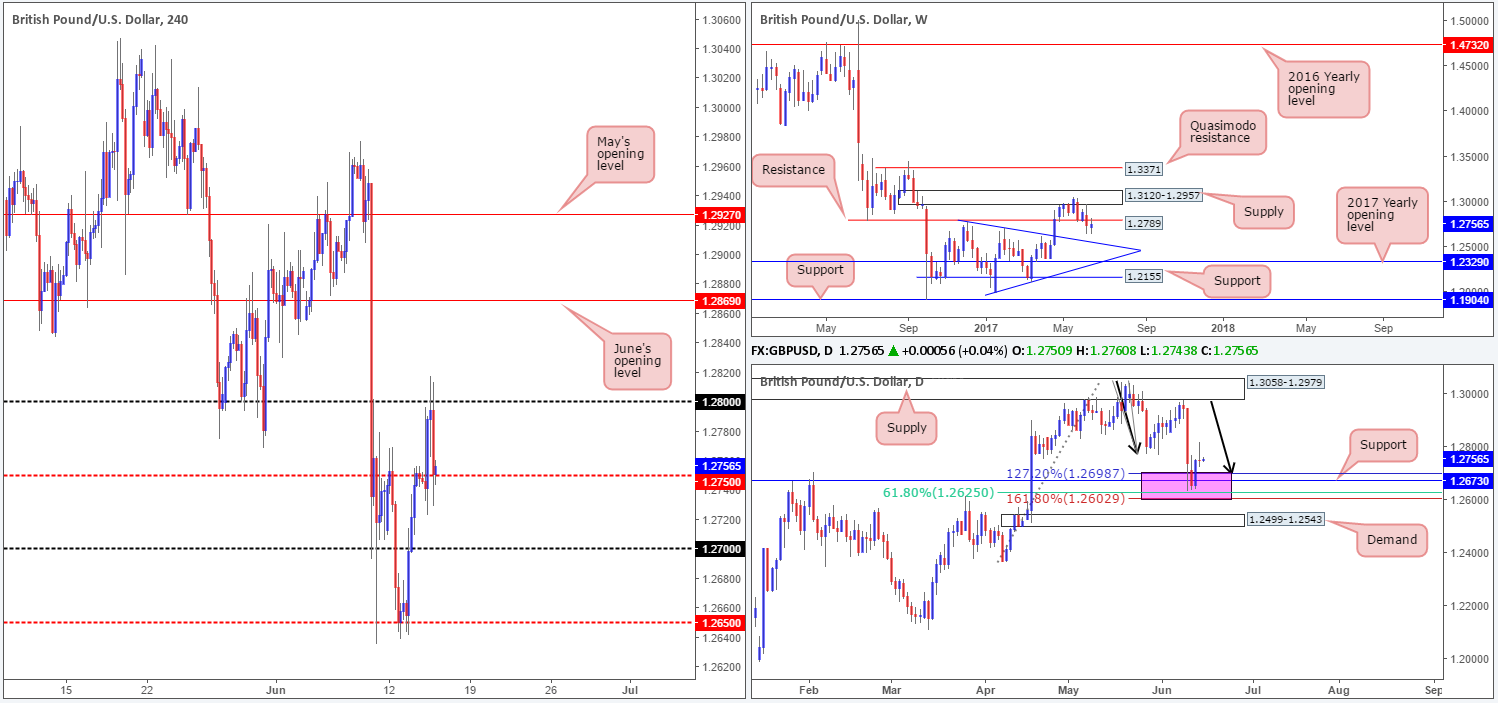
GBP/USD:
As expected, the GBP/USD took a similar path to the EUR/USD yesterday. Bouncing higher following dismal US inflation and retail sales data, the pair was able to connect with the 1.28 handle. Of course, this is not your average round number here, since it’s positioned nearby weekly resistance pegged at 1.2789.
The pair, as you can see, turned lower from 1.28 and headed back down to the H4 mid-level support 1.2750 into the close, as the Fed, as anticipated, hiked its benchmark rate by 25bps.
If you take a quick look at the daily chart, however, the bulls bounced nicely from 1.2602/1.2698 (a daily zone marked in pink) on Tuesday. Comprised of a support level coming in at 1.2673, a 61.8% Fib support at 1.2625 (taken from the low 1.2365) and an AB=CD (black arrows) 127.2/161.8% ext. completion point seen at 1.2602/1.2698 (drawn from the high 1.3047),making this is a rather attractive buy zone!
Our suggestions: A difference of opinion is currently being seen on the higher timeframes. Judging direction can be tricky in situations like this. Therefore, we’ll remain on the sidelines and wait for further developments before making any further decisions.
Data points to consider: UK Retail sales at 9.30am, MPC monetary policy summary at 12pm, BoE Gov. Carney speaks at 9pm. US Weekly unemployment claims and the Empire state manufacturing index figures at 1.30pm, US Industrial production and Capacity utilization rate at 2.15pm GMT+1.
Levels to watch/live orders:
- Buys: Flat (stop loss: N/A).
- Sells: Flat (stop loss: N/A).
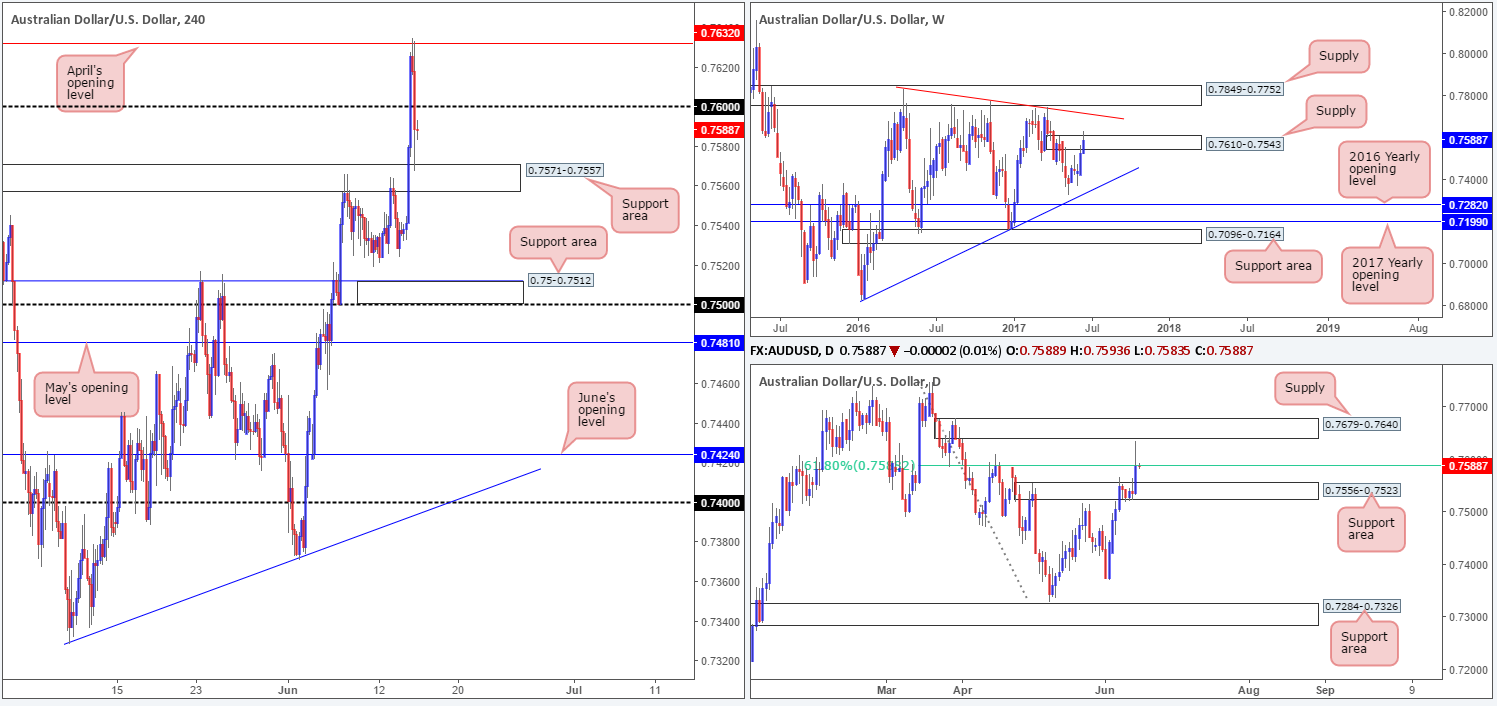
AUD/USD:
April’s opening level at 0.7632 elbowed its way into the spotlight yesterday, following lower-than-expected US inflation and retail sales data. Thanks largely to the Fed increasing its benchmark rate by 25bps, 0.7632 held steady, forcing the commodity currency back below the 0.76 handle, and into a H4 support area at 0.7571-0.7557 by the day’s end.
Wednesday’s advance also saw weekly action pierce above supply coming in at 0.7610-0.7543, likely filling a huge amount of buy stops in the process. Looking down to the daily candles, nonetheless, the candle managed to hold below the 61.8% Fib resistance at 0.7588 taken from the high 0.7747, despite chalking in an aggressive whipsaw wick that almost tagged the underside of supply seen at 0.7679-0.7640. Traders may have also noticed that directly below the Fib level sits a daily support area coming in at 0.7556-0.7523.
Our suggestions: Given the H4 candles are now sandwiched between the aforementioned H4 support area and the 0.76 handle, movement is somewhat restricted for the time being. In addition to this, we’re not too impressed with the structure seen on the higher timeframes at the moment. This – coupled with Aussie employment figures scheduled to be released in the next hour, we will humbly take a back seat today and look to reassess the market going into tomorrow’s open.
Data points to consider: Australian employment change at 2.30am, RBA Assist Gov. Debelle speaks at 8.40am. US Weekly unemployment claims and the Empire state manufacturing index figures at 1.30pm, US Industrial production and Capacity utilization rate at 2.15pm GMT+1.
Levels to watch/live orders:
- Buys: Flat (stop loss: N/A).
- Sells: Flat (stop loss: N/A).
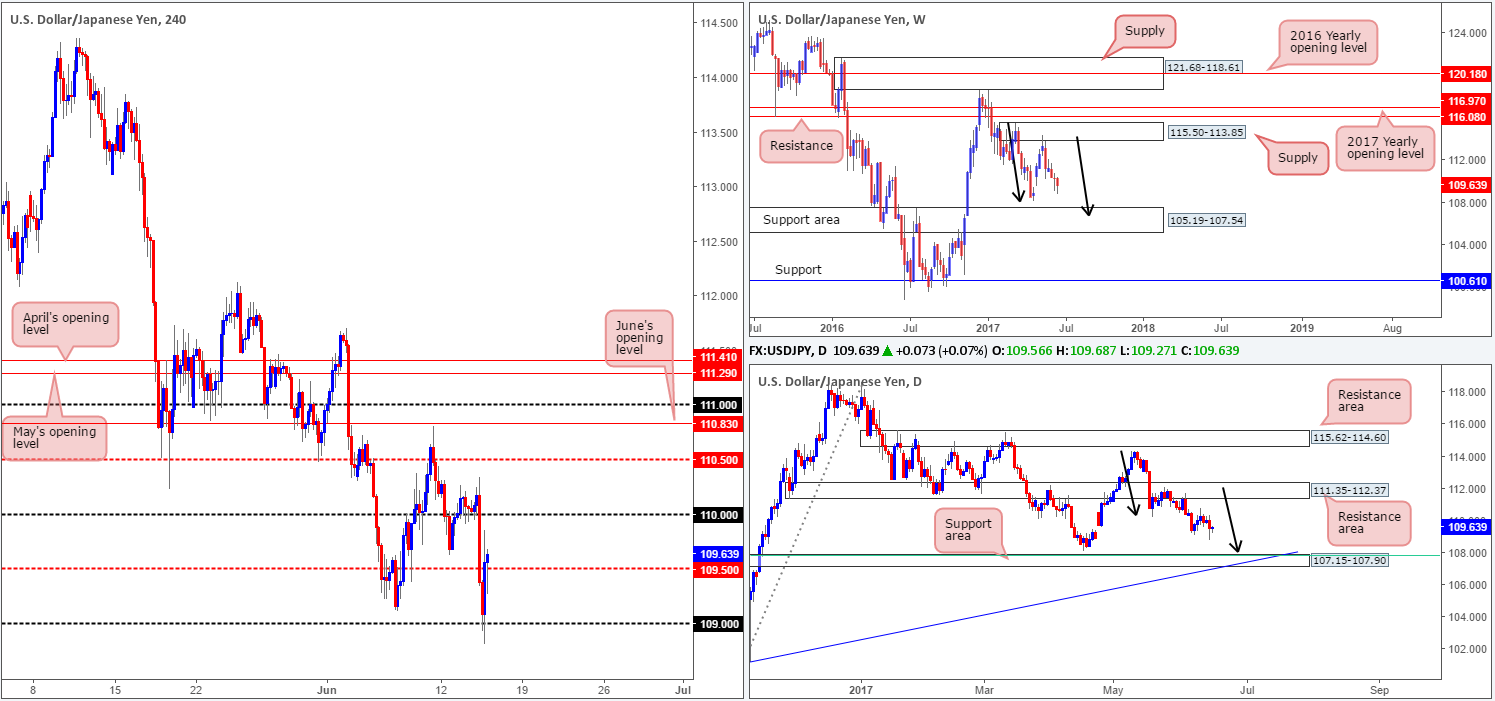
USD/JPY:
The USD/JPY suffered a blow to mid-section yesterday after below par US inflation and retail sales data hit the wire. Pushing through both the 110 handle and also the H4 mid-level support at 109.50, the pair shook hands with the 109 handle as we entered the US segment. The Fed, as expected, lifted the benchmark interest rate by 25bps, confirming support around 109 and pushing price back above the 109.50 barrier by the close.
Weekly bears continue to remain in a relatively strong position after pushing aggressively lower from supply registered at 115.50-113.85. We know there’s a fair bit of ground to cover here, but this move could possibly result in further downside taking shape in the form of a weekly AB=CD correction (see black arrows) that terminates within a weekly support area marked at 105.19-107.54 (stretches all the way back to early 2014). In conjunction with weekly flow, daily price also shows a potential AB=CD correction in the works taken from the high 114.36, which could see price drive lower to 107.15-107.90: a support zone that’s glued to the top edge of the said weekly support area and holds a 61.8% Fib support at 107.81 taken from the low 101.19.
Our suggestions: In light of the above notes, our team has no interest in buying this market today. Instead, what we’re looking for is a H4 close to print below 109.50. That way, we’d not only have space to sell down to at least 109, but we’d also be trading in line with higher-timeframe flow.
Data points to consider: US Weekly unemployment claims and the Empire state manufacturing index figures at 1.30pm, US Industrial production and Capacity utilization rate at 2.15pm GMT+1.
Levels to watch/live orders:
- Buys: Flat (stop loss: N/A).
- Sells: Watch for H4 price to engulf 109.50 and then look to trade any retest seen thereafter ([waiting for a lower-timeframe sell signal to form following the retest – see the top of this report – is advised] stop loss: dependent on where one confirms this level).
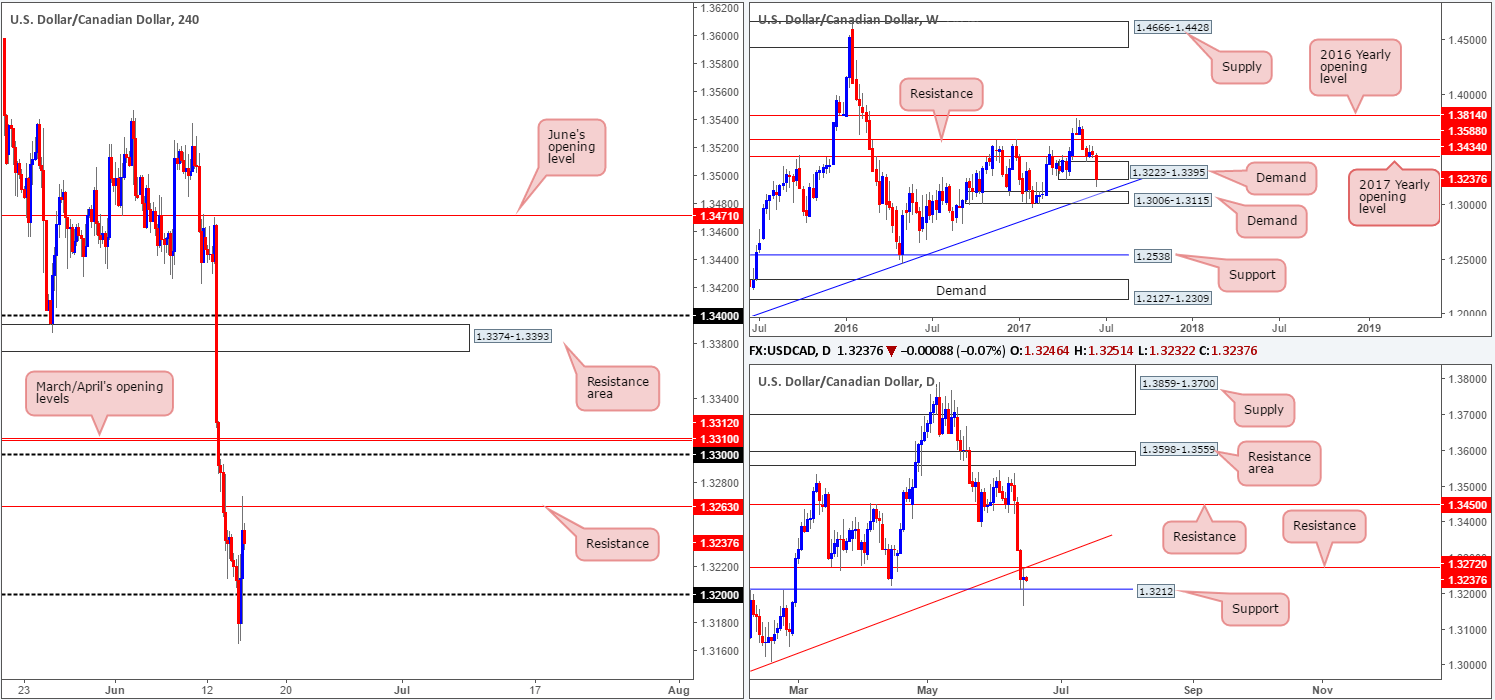
USD/CAD:
The USD/CAD erased some of its earlier losses (spurned on by lower-than-expected US inflation and retail sales data) after the Fed stepped in and lifted its benchmark interest rate by 25bps. This allowed the pair to trade back above the 1.32 handle and retest H4 resistance at 1.3263.
Despite the minor whipsaw seen through the lower edge of the weekly demand base at 1.3223-1.3395, the area remains in play. A closer look at price action on the daily chart, nevertheless, shows price is capped between support drawn from 1.3212 and resistance at 1.3272, which happens to converge with a trendline resistance extended from the low 1.2968.
Our suggestions: Given the uncertainty surrounding the weekly demand area, and daily price not showing much in the way of direction at the moment, looking to sell from the current H4 resistance is not something we’d consider high probability. As such, remaining flat until more conducive price action presents itself is the route we’ve chosen to take.
Data points to consider: US Weekly unemployment claims and the Empire state manufacturing index figures at 1.30pm, US Industrial production and Capacity utilization rate at 2.15pm. Canadian Manufacturing sales at 1.30pm GMT+1.
Levels to watch/live orders:
- Buys: Flat (Stop loss: N/A).
- Sells: Flat (Stop loss: N/A).
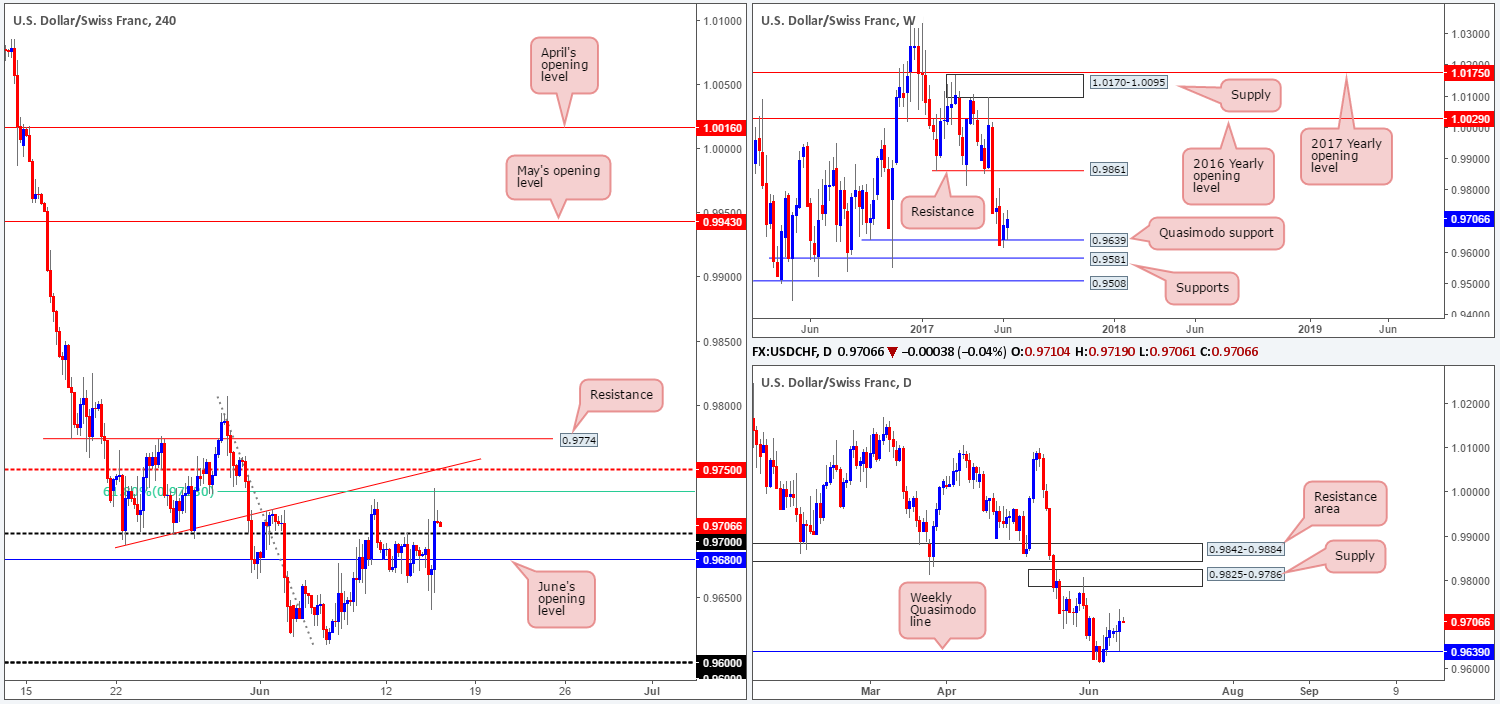
USD/CHF:
Using a top-down approach this morning, we can see that the bulls continue to show promise after connecting with the weekly Quasimodo support level seen at 0.9639. To our way of seeing things, the next upside target on this scale does not come into view until weekly resistance located at 0.9861. It’s much the same story on the daily chart, except the next upside hurdle is seen around supply coming in at 0.9825-0.9786.
Swinging over to the H4 chart, the US dollar turned to the upside yesterday following the Fed’s decision to raise interest rates by a further 25bps. Running through offers around the 0.97 handle, the pair was able to connect with a H4 61.8% Fib resistance plugged at 0.9732.
Our suggestions: In light of the higher-timeframe picture, our desk is biased to the upside. Be that as it may, buying this market is a little challenging. Not only is there the aforementioned H4 61.8% Fib resistance lurking just ahead, but a few pips above that sits the H4 mid-level resistance at 0.9750 that merges with a H4 trendline resistance taken from the low 0.9691. Therefore, we’re afraid that we have no interest in trading this market today.
Data points to consider: US Weekly unemployment claims and the Empire state manufacturing index figures at 1.30pm, US Industrial production and Capacity utilization rate at 2.15pm. SNB Monetary policy assessment at 8.30am GMT+1.
Levels to watch/live orders:
- Buys: Flat (stop loss: N/A).
- Sells: Flat (stop loss: N/A).
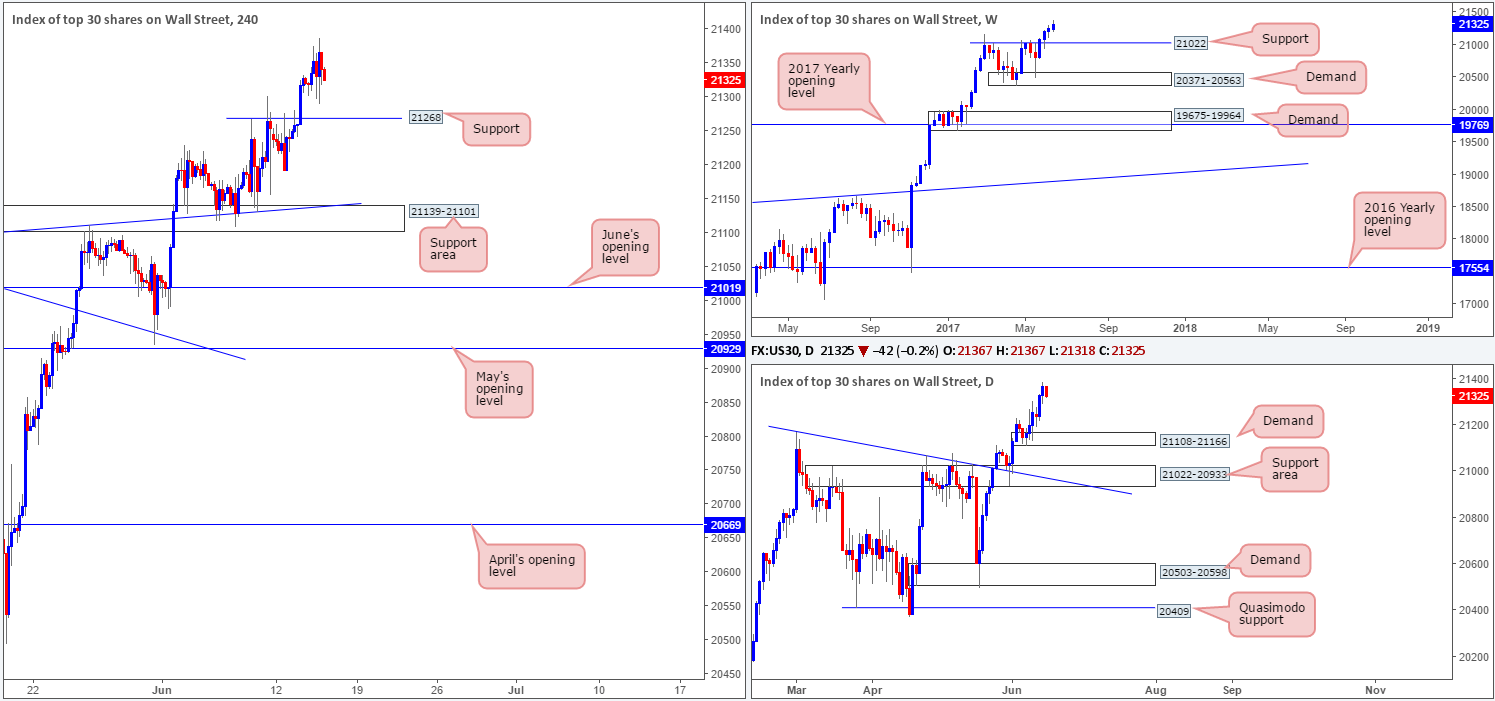
DOW 30:
Although US equities pushed to a fresh record high of 21388 yesterday, the market took on more of a sober tone in comparison to Wednesday’s trading. For those who have been following our reports over the past few days you may recall that our desk had recently taken a small long position at 21164 and placed stops below the H4 support area (21139-21101) at 21097. The position is still active, but we have liquidated 50% of the trade around the 21234 neighborhood.
Fortunately, the index continues to push higher as we are now looking to trail this market with the remainder of our position. The stop remains located below Monday’s session low (21192) at 21188. Ideally, we’re looking for H4 price to remain above the H4 support level coming in at 21268, as a close below here could imply that our stop-loss order is at risk of being filled.
Our suggestions: Should H4 action pullback and retest 21268 and hold as support, our team may, dependent on the time of day, consider adding to our position. A H4 bullish candle (preferably a full-bodied candle) would be a fantastic sight as this would be enough evidence to trigger an additional buy in this market.
Data points to consider: US Weekly unemployment claims and the Empire state manufacturing index figures at 1.30pm, US Industrial production and Capacity utilization rate at 2.15pm GMT+1.
Levels to watch/live orders:
- Buys: 21164 ([live] stop loss: 21188). 21268 region ([waiting for a reasonably sized H4 bull candle – preferably a full-bodied candle – to form before pulling the trigger is advised] stop loss: ideally beyond the candle’s tail).
- Sells: Flat (stop loss: N/A).
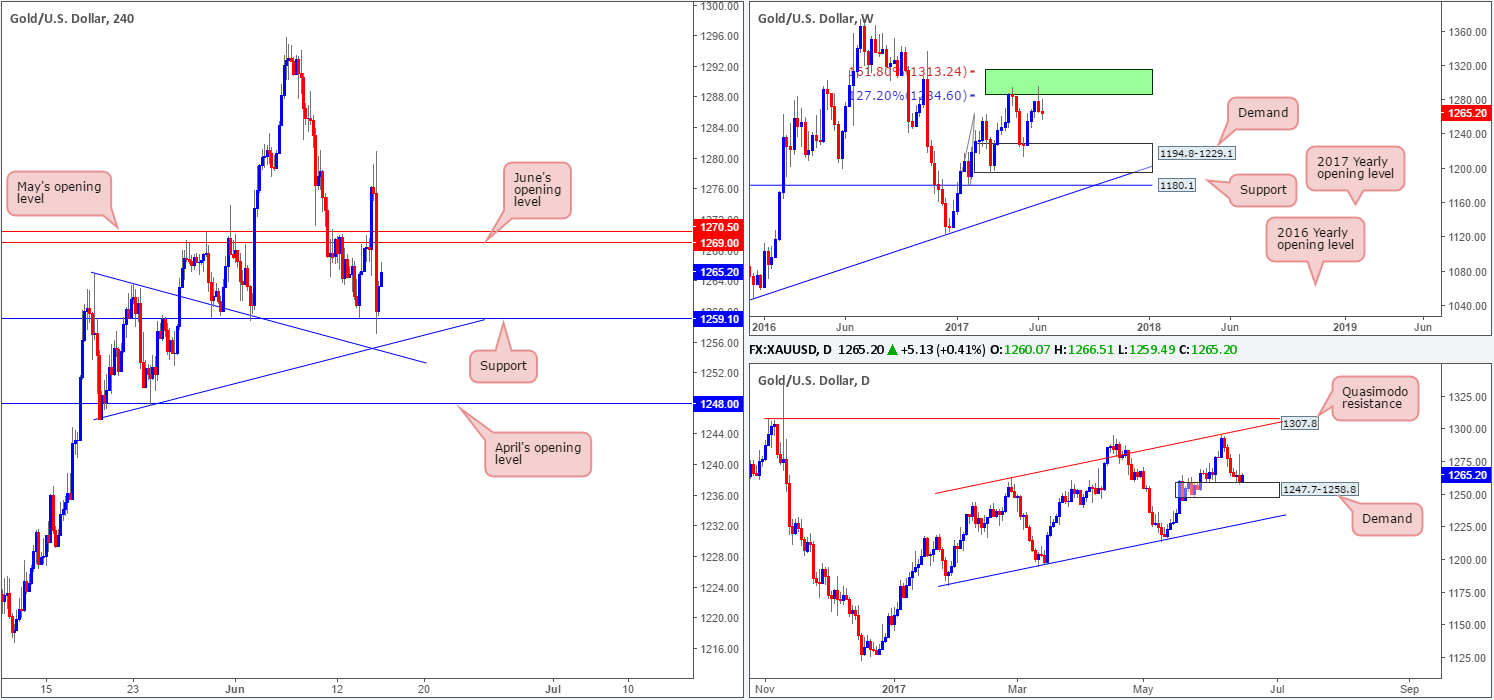
GOLD:
As can be seen from the weekly timeframe, the bears continue to hold this market lower after connecting with an area comprised of two weekly Fibonacci extensions 161.8/127.2% at 1313.7/1285.2 taken from the low 1188.1 (green zone). From this scale, there’s room for the precious metal to continue pumping lower until we reach the demand base coming in at 1194.8-1229.1.
Sliding down to the daily timeframe, bullion is seen trading within an ascending channel (1180.4/1263.7). The demand area coming in at 1247.7-1258.8 continues to hold firm. Pressure from weekly sellers could see this area consumed, however, which in turn would likely bring the candles down to the channel support taken from the low 1180.4.
Turning our attention to the H4 timeframe, support at 1259.1 remains intact, despite the whipsaw to lows of 1257.0. With this support level seen capping downside, and May/June’s opening levels at 1270.5/1269.0 seen capping upside, where does one go from here?
Our suggestions: It’s never ideal when the higher-timeframe picture shows conflicting signals. Of course, one could still look to trade from the above said H4 levels, but not knowing where the higher timeframes are likely headed, one should not really expect much more than a bounce. For us personally, we’re going to take the side of caution and remain on the sidelines for the time being.
Levels to watch/live orders:
- Buys: Flat (stop loss: N/A).
- Sells: Flat (stop loss: N/A).


