
A note on lower timeframe confirming price action…
Waiting for lower timeframe confirmation is our main tool to confirm strength within higher timeframe zones, and has really been the key to our trading success. It takes a little time to understand the subtle nuances, however, as each trade is never the same, but once you master the rhythm so to speak, you will be saved from countless unnecessary losing trades. The following is a list of what we look for:
- A break/retest of supply or demand dependent on which way you’re trading.
- A trendline break/retest.
- Buying/selling tails/wicks – essentially we look for a cluster of very obvious spikes off of lower timeframe support and resistance levels within the higher timeframe zone.
- Candlestick patterns. We tend to only stick with pin bars and engulfing bars as these have proven to be the most effective.
We search for lower timeframe confirmation between the M15 the H1 timeframes, since most of our higher-timeframe areas begin with the H4. Stops are usually placed 5-10 pips beyond confirming structures.
EUR/USD:
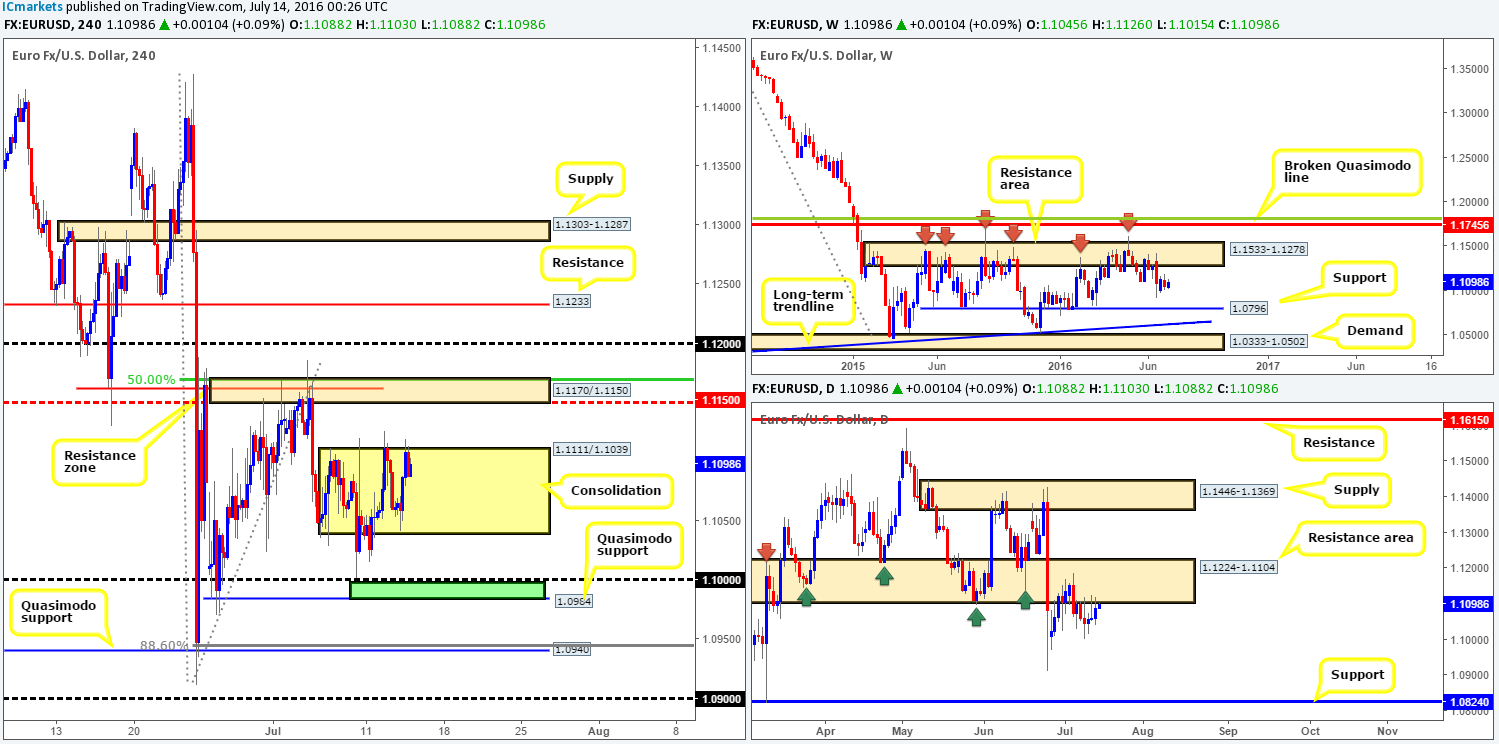
To our way of seeing things, H4 action recently entered into a phase of consolidation between 1.1111/1.1039. Directly above this range lurks a H4 resistance zone drawn from 1.1170/1.1150, whilst just below we have a minor H4 Quasimodo support at 1.0984 coupled with the key figure 1.10 (green zone). Both of these areas are interesting, as are the H4 range extreme points.
With the above in mind, let’s take a peek at what the higher timeframes are up to… Over on the weekly chart, the EUR continues to trade mid-range between a long-term weekly resistance area coming in at 1.1533-1.1278, and a long-term weekly support line seen at 1.0796. Moving down to the daily chart, however, we can see that price remains flirting with the underside of a daily resistance area at 1.1224-1.1104. Apart from the referendum low at 1.0911, there’s little daily support stopping this market from reaching the daily support chalked in at 1.0824.
Our suggestions: Seeing as how daily price is occupying a daily resistance area at the moment, selling from either the upper edge of the current H4 range or the aforementioned H4 resistance zone is, in our opinion, worth considering today. We would, nevertheless, advise entering alongside lower timeframe confirmation (see the top of this report), since fakeouts are common within ranging environments such as what we’re seeing now. In addition to this, with the BoE set to take the limelight later on today this could also affect this pair due to its high correlation. So do remain vigilant during this time!
Levels to watch/live orders:
- Buys: Flat (Stop loss: N/A).
- Sells: 1.1111 region [Tentative – confirmation required] (Stop loss: dependent on where one confirms this area). 1.1170-1.1150 [Tentative – confirmation required] (Stop loss: dependent on where one confirms this area).
GBP/USD:
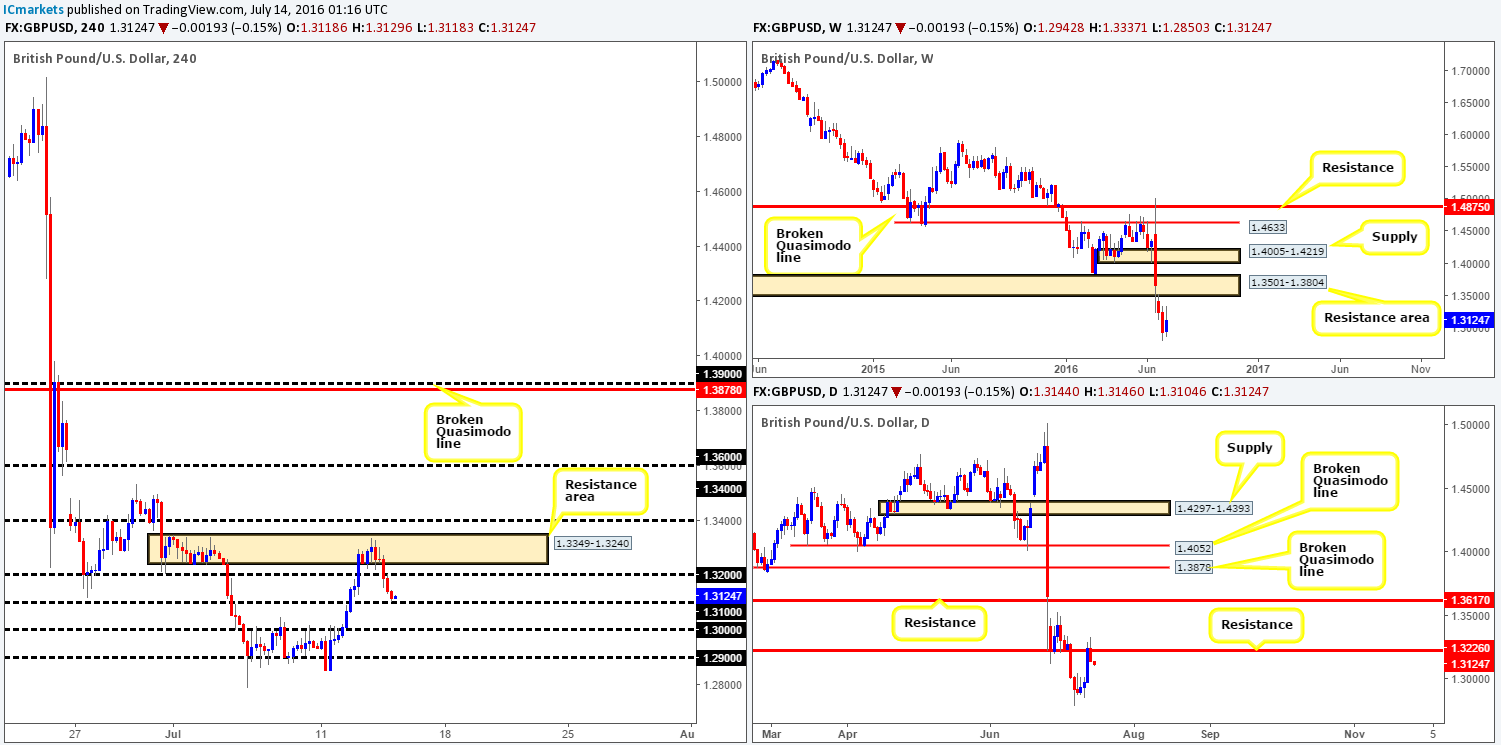
Following a sharp run to the upside on Tuesday, cable began topping out going into the early hours of yesterday’s sessions from within a H4 resistance area at 1.3349-1.3240. This sent the pair tumbling lower throughout the remainder of the day, consuming the 1.32 handle and closing the session just ahead of 1.31.
Given that yesterday’s reversal was bolstered by a daily resistance line drawn from 1.3226, and there’s little support seen on the weekly timeframe at the moment, a break below 1.31 may be on the cards today. Beyond this number, the 1.30 and 1.29 handles are the next lines to keep an eye on since both provided this market relatively significant support and resistance a week or so ago.
Our suggestions: Watch for the market to close below and retest 1.31. This could, along with a nice-looking lower timeframe signal (see the top of this report), be enough to trigger a sell trade in our book. Targets from this hurdle, as we mentioned above, are 1.30 followed by the 1.29 barrier. However, the BoE is set to that the stage for the first time since the ‘Brexit’ fallout later on today, as investors have been poised for a fresh round of easing over the summer. Therefore, technicals could take a back seat during this time!
Levels to watch/live orders:
- Buys: Flat (Stop loss: N/A).
- Sells: Watch for price to consume the 1.31 handle and look to trade any retest seen thereafter (lower timeframe confirmation required).
AUD/USD:
Jobs data for the month of June shows that Australia’s unemployment rate hit 5.8 percent, matching market expectations, while employment came in lower than expected, creating only 7.9k jobs vs. expected 10.1k.
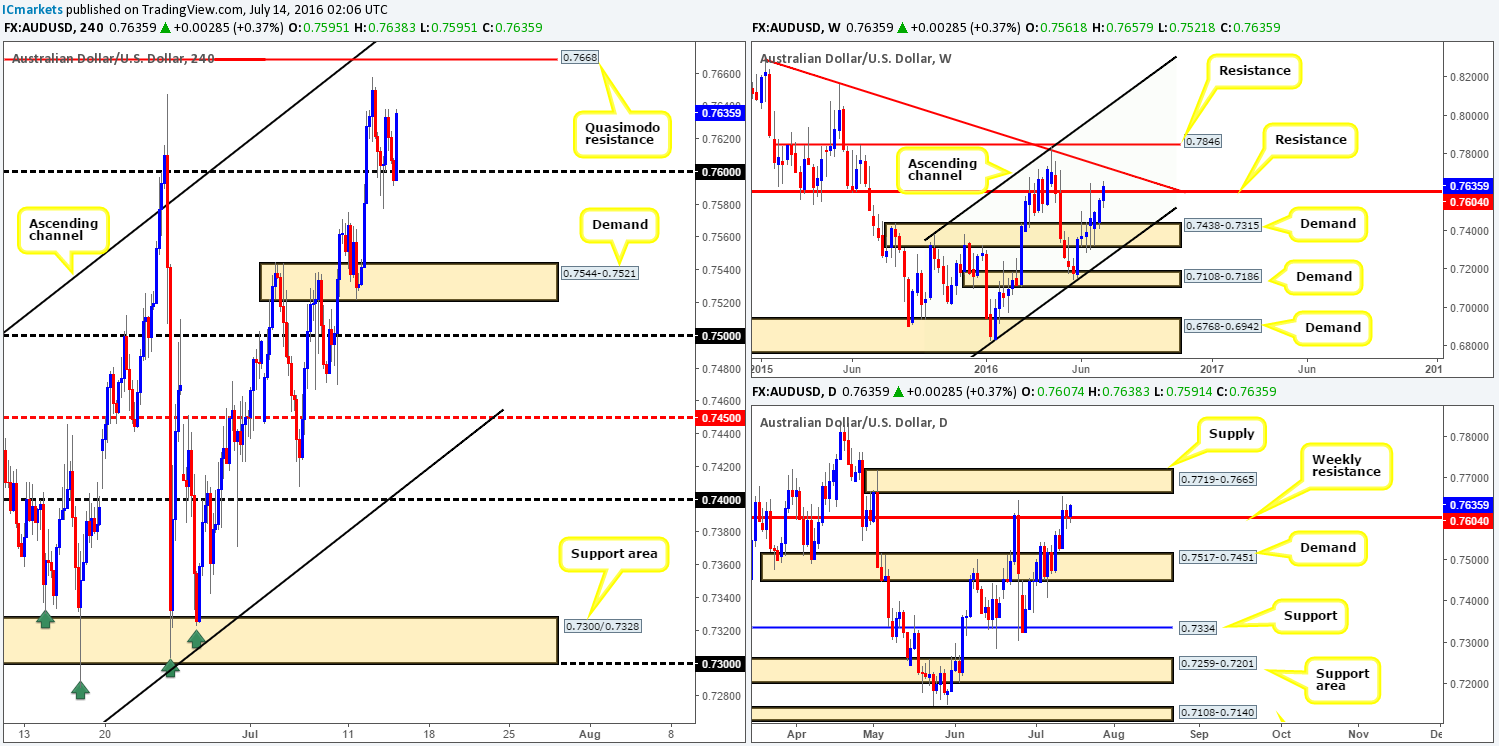
From a technical standpoint, however, the commodity-linked currency found a bed of support around the 0.76 handle during the course of yesterday’s trading, which remains firm as we write. The weekly resistance level at 0.7604 is showing signs of weakness at the moment, especially seeing as how daily action is now using the line as support to potentially propel prices up to daily supply at 0.7719-0.7665.
Our suggestions: The H4 Quasimodo level at 0.7668 is an interesting zone and somewhere we’d consider shorting, due to it fusing beautifully with the underside of the aforementioned daily supply zone. Waiting for lower timeframe confirmation is recommended (see the top of this report) but given the higher timeframe convergence, a market order at 0.7667 with a stop placed above the daily supply is also something to consider.
Levels to watch/live orders:
- Buys: Flat (Stop loss: N/A).
- Sells: 0.7668 region [Market entry is possible as long as one is willing to place their stops above the daily supply area at 0.7719-0.7665] (Stop loss: 0.7723).
USD/JPY:
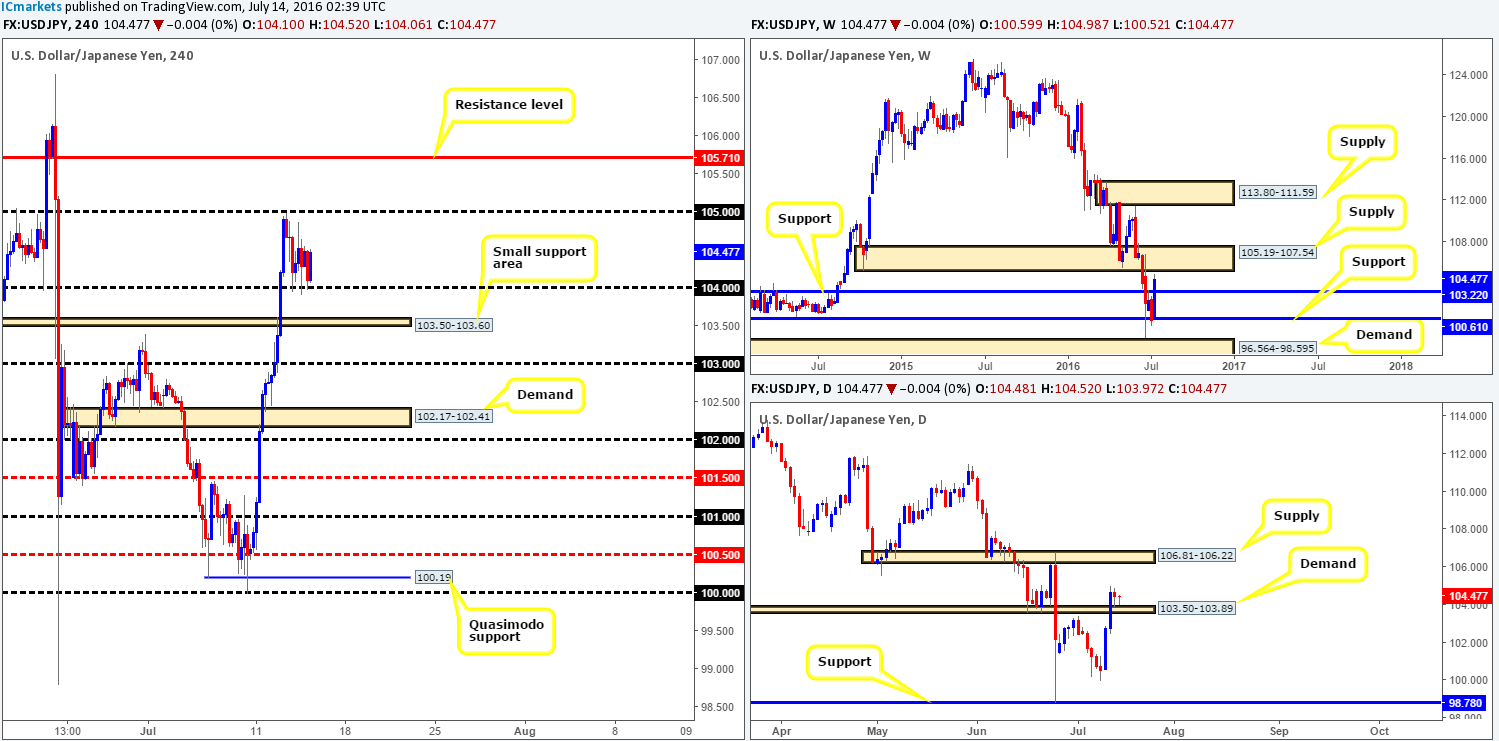
From the weekly timeframe, the safe-haven pair is now seen trading within striking distance of a weekly supply at 105.19-107.54. This zone provided demand beautifully back in the month of May this year, and as such could just as easily hold this market lower as supply. However, before weekly sellers can push prices lower, a small daily demand area at 103.50-103.89, which as you can see held firm yesterday, will need to be consumed.
Over on the H4 chart, candle action spent the day teasing the 104.00 handle, and remains a supportive base at the time of writing. Traders who are considering going long from this number have the following in their favor:
1. Room to move higher on the weekly chart up to the aforementioned weekly supply zone.
2. Space is also seen above the current daily demand area up to daily supply coming in at 106.81-106.22.
Be that as it may, with the BoE set to take the limelight later on today, this could also affect this pair. So do remain vigilant during this time!
Our suggestions: Watch for a lower timeframe long entry off of the 104 handle today. The reason for urging traders to consider waiting for lower timeframe confirmation (see the top of this report for a list of our lower timeframe entry techniques) simply comes down to the fact that round numbers are prone to whipsaws! Getting stopped out to-the-pip is never a pleasant experience, especially when price then rotates and hits your target! Should one manage to pin down a setup here today, the 105 handle is our recommended first take-profit target, followed by the H4 resistance level at 105.71.
Levels to watch/live orders:
- Buys: 104 region [Tentative – confirmation required] (Stop loss: dependent on where one confirms this area).
- Sells: Flat (Stop loss: N/A).


