
A note on lower timeframe confirming price action…
Waiting for lower timeframe confirmation is our main tool to confirm strength within higher timeframe zones, and has really been the key to our trading success. It takes a little time to understand the subtle nuances, however, as each trade is never the same, but once you master the rhythm so to speak, you will be saved from countless unnecessary losing trades. The following is a list of what we look for:
- A break/retest of supply or demand dependent on which way you’re trading.
- A trendline break/retest.
- Buying/selling tails – essentially we look for a cluster of very obvious spikes off of lower timeframe support and resistance levels within the higher timeframe zone.
- Candlestick patterns. We tend to only stick with pin bars and engulfing bars as these have proven to be the most effective.
For us, lower timeframe confirmation starts on the M15 and finishes up on the H1, since most of our higher timeframe areas begin with the H4. Stops usually placed 5-10 pips beyond your confirming structures.
EUR/USD:
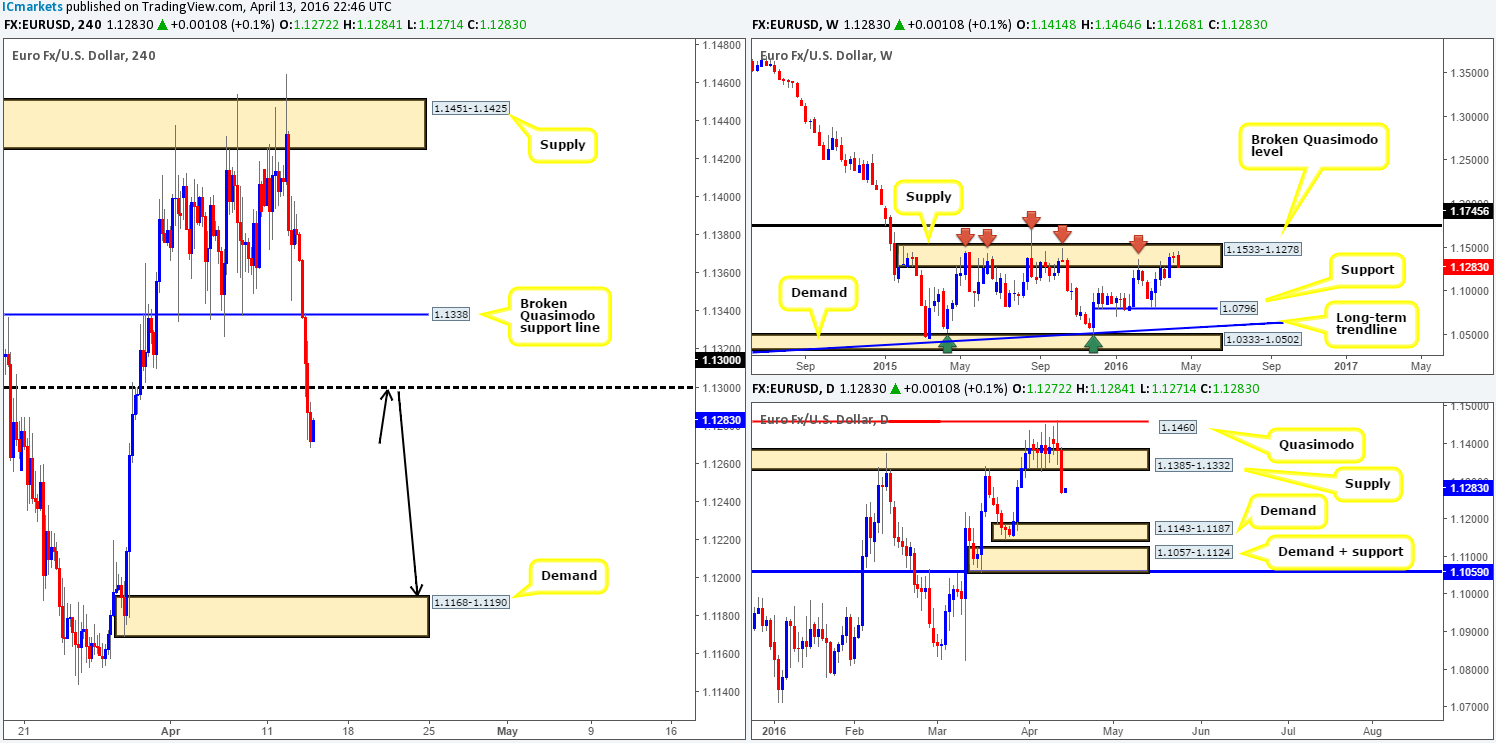
The value of the EUR currency weakened in aggressive fashion on Wednesday, clearing out bids from both a broken H4 Quasimodo support line at 1.1338 and the psychological support 1.1300. Despite lower than expected U.S. retail sales data, the single currency remained below the 1.1300 line going into the close.
Technically, this recent sell-off should not really come as much of a surprise seeing that price has been lodged within a major area of weekly supply at 1.1533-1.1278 for the past few weeks! Consequent to this move, daily demand at 1.1385-1.1332 was engulfed (now acting supply) which looks to have cleared the rubble for a continuation move down to demand seen at 1.1143-1.1187.
As things stand, our prime focus today will be on shorting this market. Ultimately, what we’re looking for is a retest of 1.1300 as resistance together with lower timeframe confirmation (engulf of demand/break of a trendline etc…). Should this come to fruition, we plan on trailing this position down to H4 demand chalked up at 1.1168-1.1190, which conveniently sits on top of the daily demand mentioned above at 1.1143-1.1187.
Levels to watch/live orders:
- Buys: Flat (Stop loss: N/A).
- Sells: 1.1300 region [Tentative – confirmation required] (Stop loss: dependent on where one confirms this area).
GBP/USD:
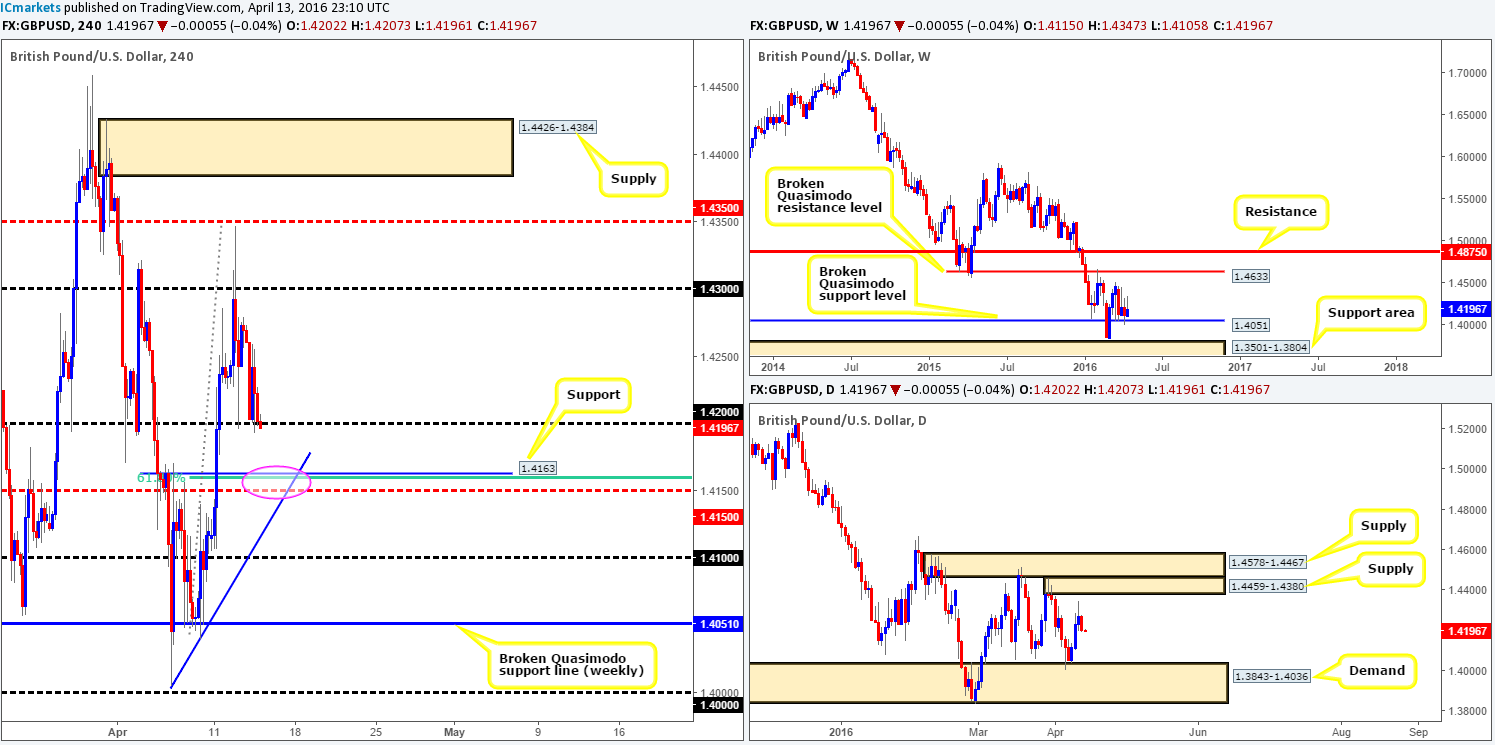
In recent trading Cable took a hit to the mid-section, consequently forcing price down into the jaws of psychological support 1.4200 and wiping out Tuesday’s gains. With the bulls showing little to no enthusiasm around this number at the moment, this could encourage further selling down towards H4 support coming in at 1.4163. This support also brings together a nice collection of structure (pink circle) that includes the 61.8% Fibonacci level at 1.4160, trendline support taken from the low 1.4005 and a mid-level support seen at 1.4150.
However, with weekly action on shaky ground around the broken Quasimodo support line at 1.4051, and the daily loitering mid-range between demand at 1.3843-1.4036 and supply drawn from 1.4459-1.4380, price could potentially ignore our H4 support! Does that mean we should completely dismiss this level? Definitely not! A bounce from this confluent area is still a strong possibility despite the lack of higher-timeframe convergence. That being said though, we would advise only risking capital following lower timeframe price action (see the top of this article for ways of confirming a level). Furthermore, should this trade come alive, we’ll look to manage this one aggressively and take 70% of our position off the table at 1.4200 as well as reducing risk to breakeven.
Levels to watch/live orders:
- Buys: 1.4163 [Tentative – confirmation required] (Stop loss: dependent on where one confirms this level).
- Sells: Flat (Stop loss: N/A).
AUD/USD:
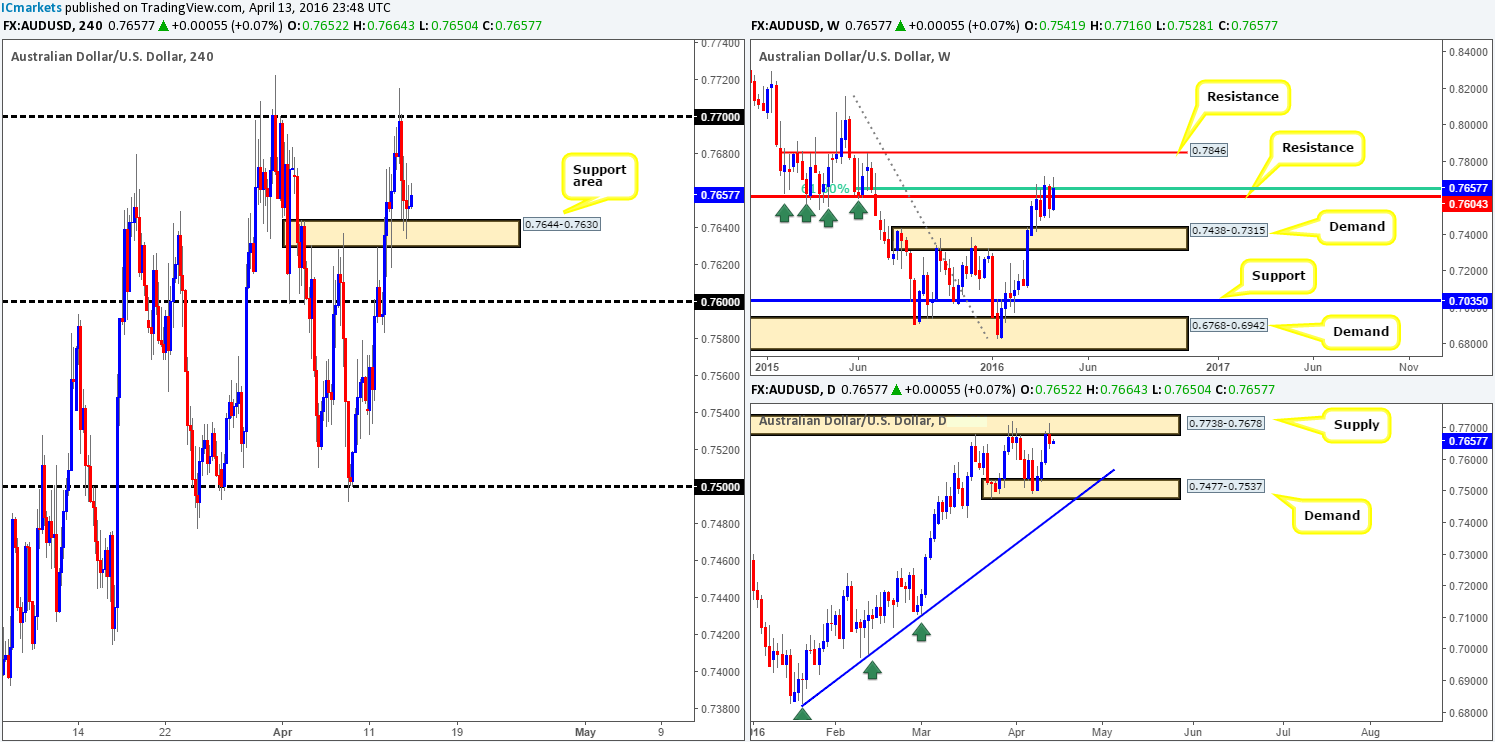
Reporting from the weekly chart this morning, we can see that the buyers and sellers remain battling for position around the 61.8% Fibonacci level at 0.7646 (sits just above resistance coming in at 0.7604). The reason for this struggle here likely comes down to price acknowledging supply on the daily timeframe from 0.7738-0.7678 for the third time in the last month.
For those who read our previous report on the Aussie (see link below) you may recall us speaking about shorting the 0.7700 line. As is evident from the chart, price responded beautifully to this handle which clearly set the tone for the remainder of the day! Unfortunately we were unable to pin down a lower timeframe (confirmation) setup to sell here. Well done to any of our readers who did though as price drove itself into the first take-profit zone (H4 support area at 0.7644-0.7630) in good fashion.
Pushing forward, we see little hope for the current H4 support area considering the higher-timeframe position (see above). Conversely, we also see little opportunity to trade short on the break of this zone given that the 0.7600 handle is lurking directly below! A break beyond 0.7600 may be a different story however, since other than the rather shady-looking demand around the mid-level region 0.7550, the path south appears clear down to 0.7500 which sits deep within daily demand at 0.7477-0.7537 (the next downside target on the daily scale).
http://www.icmarkets.com/blog/wednesday-13th-april-daily-technical-outlook-and-review/
Levels to watch/live orders:
- Buys: Flat (Stop loss: N/A).
- Sells: Watch for price to consume 0.7600 and look to trade any retest seen thereafter (lower timeframe confirmation required).
USD/JPY:
Following the beautiful reaction from our H4 buy zone at 107.50/108.00, further buying was seen during the course of yesterday’s sessions. Thanks to this, psychological resistance 109.00 was taken out, and came very close to being retested as support before continuing to gravitate to highs of 109.40 by the day’s end.
This recent surge in buying was a thing of beauty from a technician’s standpoint. Not only was price trading within shouting distance of a major weekly demand at 105.19-107.54, but it was also seen loitering within daily demand which sat on top of the above said weekly demand at 107.60-108.35. We would have been kicking ourselves if we missed this move, but seeing as how we’re long the USD/CHF right now we’re not too concerned! For traders who remain long this pair, taking note of the 110.00 handle hanging just above H4 supply at 109.90-109.54 might be a good move. The reason being is it also represents a major line of weekly resistance coming in at 110.09, which has the potential to halt this present correction.
This brings us onto the sell-side of this market. At first glance, shorting the weekly resistance seems attractive, but when looking at the daily chart, upside movement could potentially continue north towards the 110.96 mark –clear resistance. Given this, an ideal spot to look for shorts on the H4 chart, at least in our opinion, would be in between the H4 supply at 110.63-110.31 and the round-number 111.00 (pink circle).

Levels to watch/live orders:
- Buys: Flat (Stop loss: N/A).
- Sells: 111.00/110.63 [Tentative – confirmation required] (Stop loss: dependent on where one confirms this area).
USD/CAD:
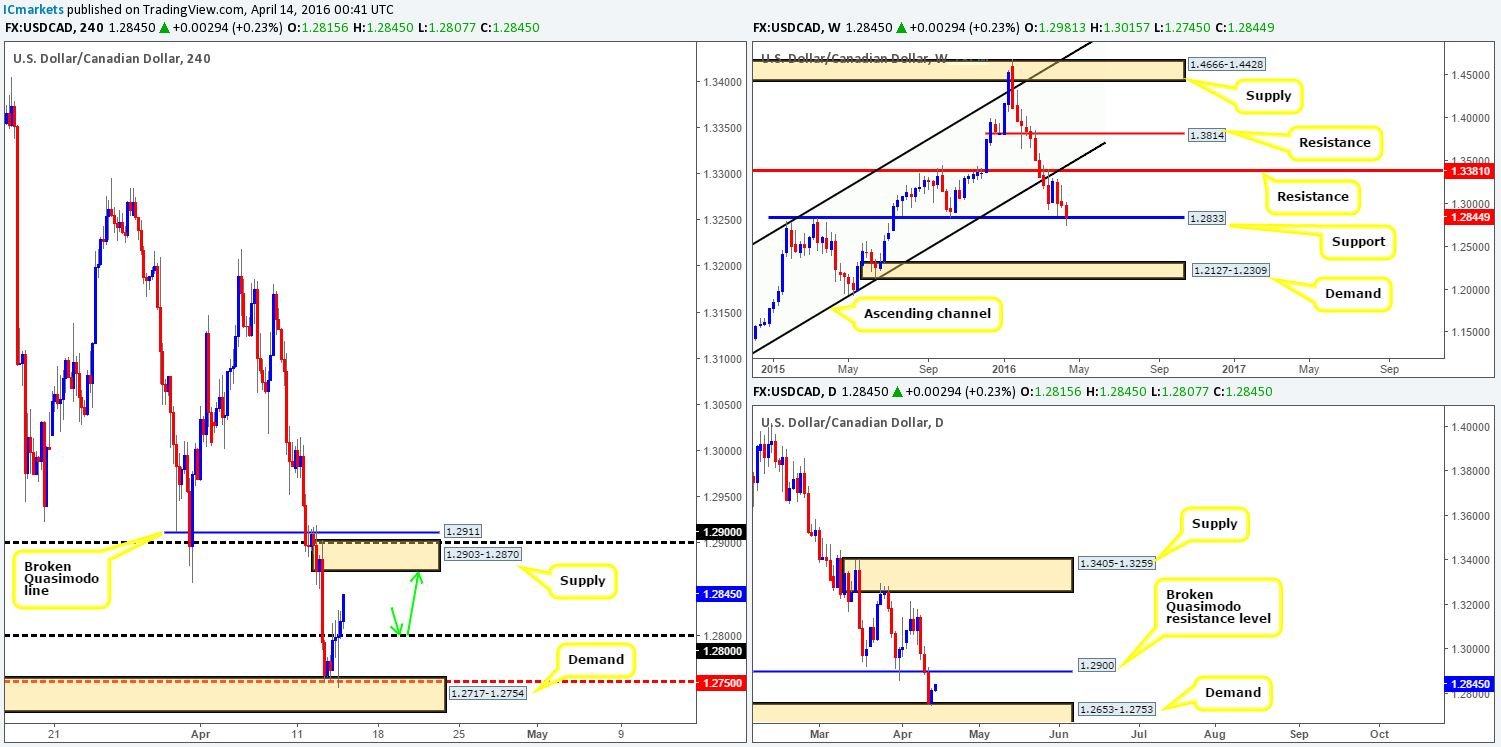
Beginning with a quick peek at the weekly chart, the current action is seen pressing into a well-established support line drawn from 1.2833. Should the bulls defend this barrier, there’s potential for this pair to rally up towards resistance coming in at 1.3381. A break to the downside, however, could force the Loonie to test demand at 1.2127-1.2309. Moving down one scale to the daily chart, we can see that demand at 1.2653-1.2753 looks in relatively good form at the moment, with space seen for price to continue rallying up to 1.2900 – a broken Quasimodo resistance line.
In our previous report (see link below) we said trading long (with lower timeframe confirmation) from the H4 demand at 1.2717-1.2754 was the way to go yesterday due to the higher-timeframe position discussed above. We did not trade this move as we’re already long the USD/CHF – well done to any of our readers who managed to board this train before it departed.
Going forward, following the break above 1.2800 the H4 shows room for price to continue advancing north until H4 supply coming in at 1.2903-1.2870 (encapsulates the broken daily Quasimodo line at 1.2900). In the event that we see this unit retrace to retest 1.2800 prior to hitting this supply, we’ll be looking to take an intraday (confirmed) long in this market as per the green arrows.
http://www.icmarkets.com/blog/wednesday-13th-april-daily-technical-outlook-and-review/
Levels to watch/live orders:
- Buys: 1.2800 region [Tentative – confirmation required] (Stop loss: dependent on where one confirms this area).
- Sells: Flat (Stop loss: N/A).
USD/CHF:
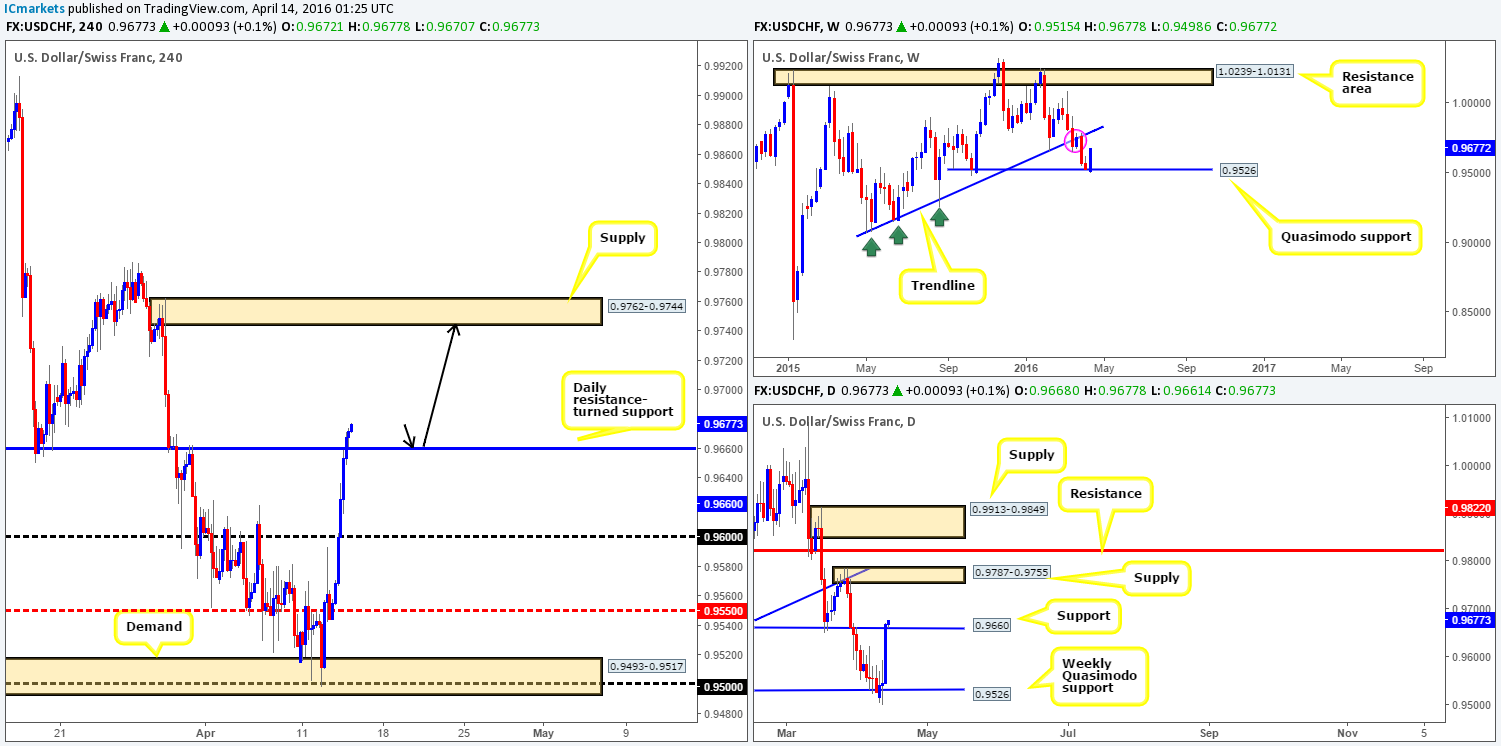
For those who have been following our analysis over the past few days, you may recall that we took a long position around H4 demand at 0.9493-0.9517 from 0.9519 with a stop below at 0.9490. The trade was recently closed a few hours back as price collided with daily resistance at 0.9660 – our final take-profit target. Well done to any of our readers who joined us in this trade!
In light of this recent surge in buying, here is what we’re looking at currently:
- With daily action just closing above resistance at 0.9660 (now acting support), there’s room seen for price to continue advancing up to daily supply chalked in at 0.9787-0.9755. This area is actually located within the extremes of a weekly supply seen marked with a pink circle at 0.9787-0.9695.
- On the H4 chart, the break above the daily resistance looks to have opened up the path north towards H4 supply sitting within the extremes of the above said daily supply at 0.9762-0.9744.
Owing to the above, buying on any retest seen at the recently broken daily resistance line, targeting H4 supply at 0.9762-0.9744 (black arrows) is, in our opinion, a valid setup to keep an eye on today.
Levels to watch/live orders:
- Buys: 0.9660 [Tentative – confirmation required] (Stop loss: dependent on where one confirms this level).
- Sells: Flat (Stop loss: N/A).
DOW 30:
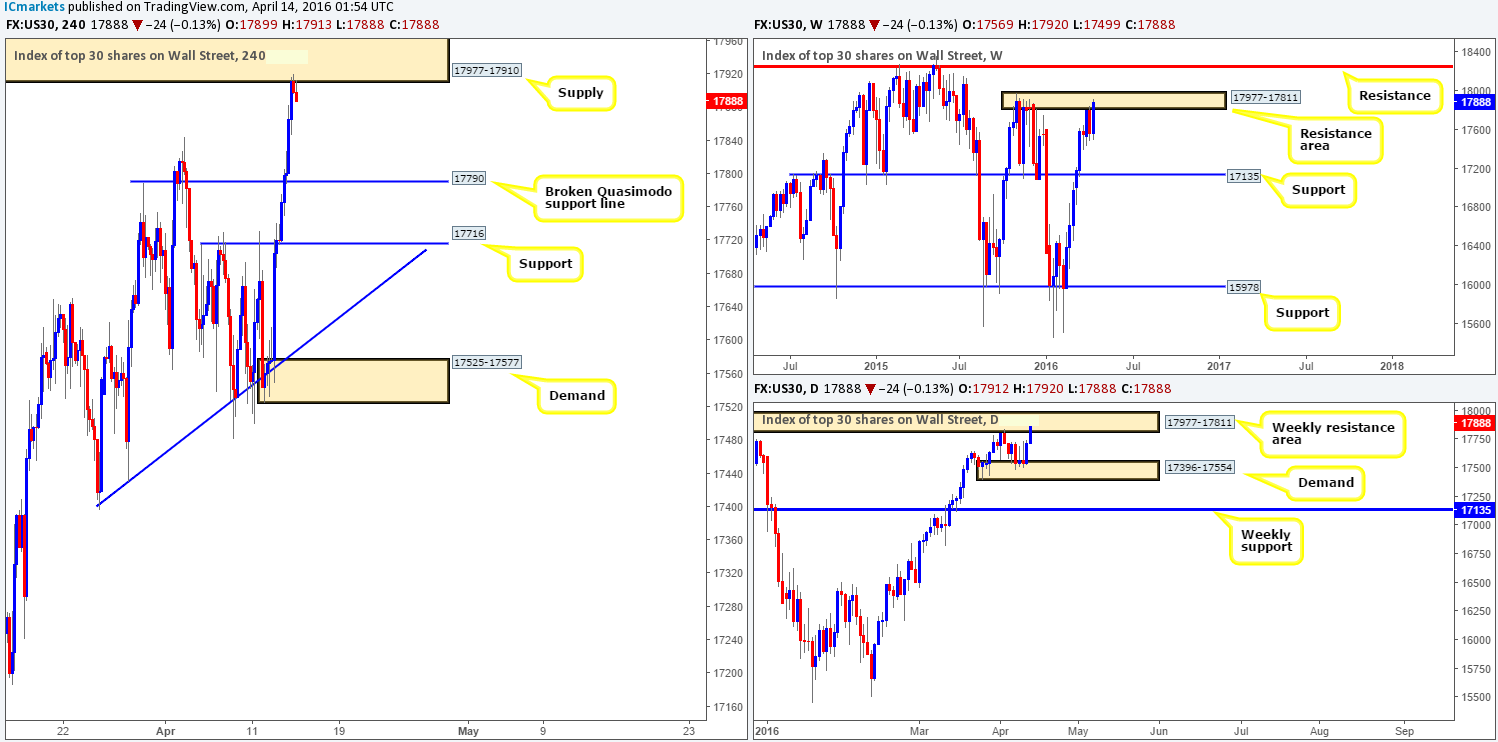
Following the bounce seen from daily demand at 17396-17554 the DOW rose sharply for a second straight day yesterday, consequently driving price into the jaws of a weekly resistance area at 17977-17811. Alongside this, H4 price connected with a nice-looking H4 supply zone drawn from 17977-17910 located within the extremes of the above said weekly resistance area.
From the mentioned structure, we see absolutely no reason why the value of this index will not decline today. However, it appears we may have missed the boat to short the current H4 supply, so we’ll have to resort to entering on lower timeframe price action (a break below and retest of demand, a break below and retest of a trendline or even simply a collection of selling tails around some form of lower timeframe resistance). In regard to taking profits, we’d be looking at the 4th April high at 17844, followed closely by the broken Quasimodo support line at 17790.
Levels to watch/live orders:
- Buys: Flat (Stop loss: N/A).
- Sells: 17977-17910 [Tentative – confirmation required] (Stop loss: dependent on where one confirms this area).
XAU/USD:
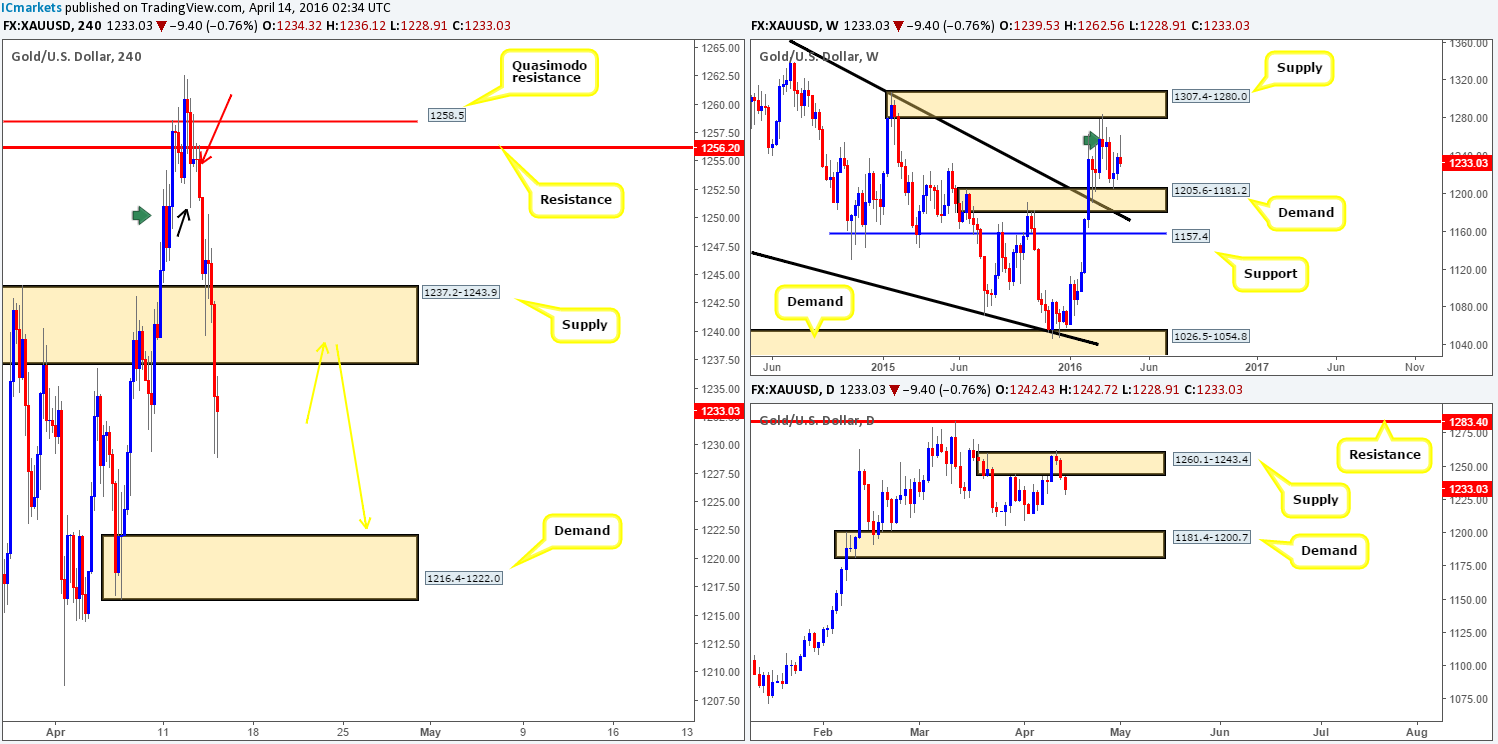
In our previous report we spoke about selling the yellow metal if yesterday’s initial H4 candle seen marked with a red arrow closed on or very near its lows. As you can see, the candle closed with bearish intentions which enabled us to take a very small short position at 1251.6 with our stop placed above at 1257.14. Our reasoning behind this short was as follows:
- The H4 candle of interest retested the underside of H4 resistance at 1256.2.
- Daily was trading from within an area of supply seen at 1260.1-1243.4.
- The weekly chart was showing some active supply around the 1270.8-1250.3 region (see green arrow).
- And finally, Tuesday’s low 1251.0 (black arrow) on the H4 stabbed into the top-side of H4 demand seen marked with a green arrow at 1251.1, removing some bids from this area and clearing the path south.
We closed out our full short position at 1240.94 since we expected bounce from the H4 demand area at 1237.2-1243.9. A bounce was seen, but only managed to reach highs of 1250.3 before driving lower into yesterday’s close.
Going forward, where do we see this market heading today? Well, from a weekly standpoint there appears room to continue lower down to demand coming in at 1205.6-1181.2. Down on the daily chart, there is not really any noteworthy demand seen to the left of current price until we hit the 1181.4-1200.7 region. Owing to this, we now have our eye on at shorting this unit on any retest seen at H4 supply drawn from 1237.2-1243.9, targeting H4 demand coming in at 1216.4-1222.0 as per the yellow arrows.
Levels to watch/live orders:
- Buys: Flat (Stop loss: N/A).
- Sells: 1237.2-1243.9 [Tentative – confirmation required] (Stop loss: dependent on where one confirms this area).


