
A note on lower timeframe confirming price action…
Waiting for lower timeframe confirmation is our main tool to confirm strength within higher timeframe zones, and has really been the key to our trading success. It takes a little time to understand the subtle nuances, however, as each trade is never the same, but once you master the rhythm so to speak, you will be saved from countless unnecessary losing trades. The following is a list of what we look for:
- A break/retest of supply or demand dependent on which way you’re trading.
- A trendline break/retest.
- Buying/selling tails/wicks – essentially we look for a cluster of very obvious spikes off of lower timeframe support and resistance levels within the higher timeframe zone.
- Candlestick patterns. We tend to only stick with pin bars and engulfing bars as these have proven to be the most effective.
We search for lower timeframe confirmation between the M15 the H1 timeframes, since most of our higher timeframe areas begin with the H4 right up to the weekly chart. Stops usually placed 5-10 pips beyond your confirming structures.
EUR/USD:
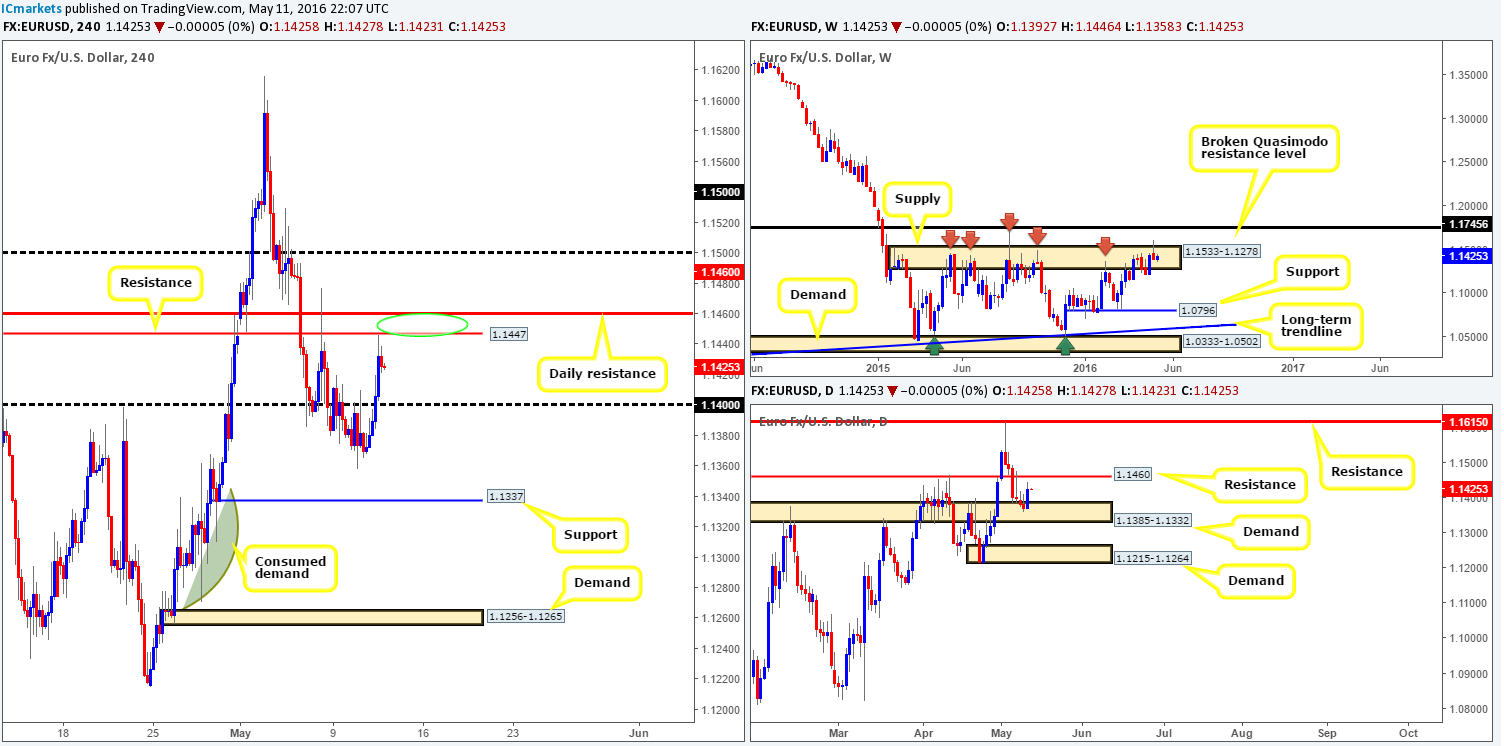
Following six consecutive losing days, a steady wave of bids flooded this market during yesterday’s trading. Consequent to this, the EUR clocked new highs of 1.1446 on the day, just missing the H4 resistance seen at 1.1447 by a mere pip! The reason we believe this bounce took place, other than the fact that the U.S. dollar fell across the board, was price was also trading from within a daily demand base seen at 1.1385-1.1332. With that being said, however, In view of the weekly chart showing price housed within weekly supply at 1.1533-1.1278 we do not imagine this recent surge in buying can be sustained. Technically, price closing beyond the daily resistance line seen at 1.1460 today would be a surprise as this would likely indicate bullish strength within weekly supply!
Ultimately, given the above points, downside movement is favored for the time being! On that account, should a retest of the current H4 resistance and its neighboring daily resistance at 1.1460 be seen (green circle), our team will begin hunting for lower timeframe (confirmed) shorts, targeting the 1.1400 handle as our first take-profit zone. Confirmation could be in the form of either an engulf of demand and subsequent retest, a break/retest of a trendline or simply a collection of selling wicks around a lower-timeframe resistance hurdle. We search for lower timeframe confirmation between the M15 the H1 timeframes, since most of our higher timeframe areas begin with the H4. Stops usually placed 5-10 pips beyond your confirming structures.
Levels to watch/live orders:
- Buys: Flat (Stop loss: N/A).
- Sells: 1.1460/1.1447 [Tentative – confirmation required] (Stop loss: dependent on where one confirms this area).
GBP/USD:
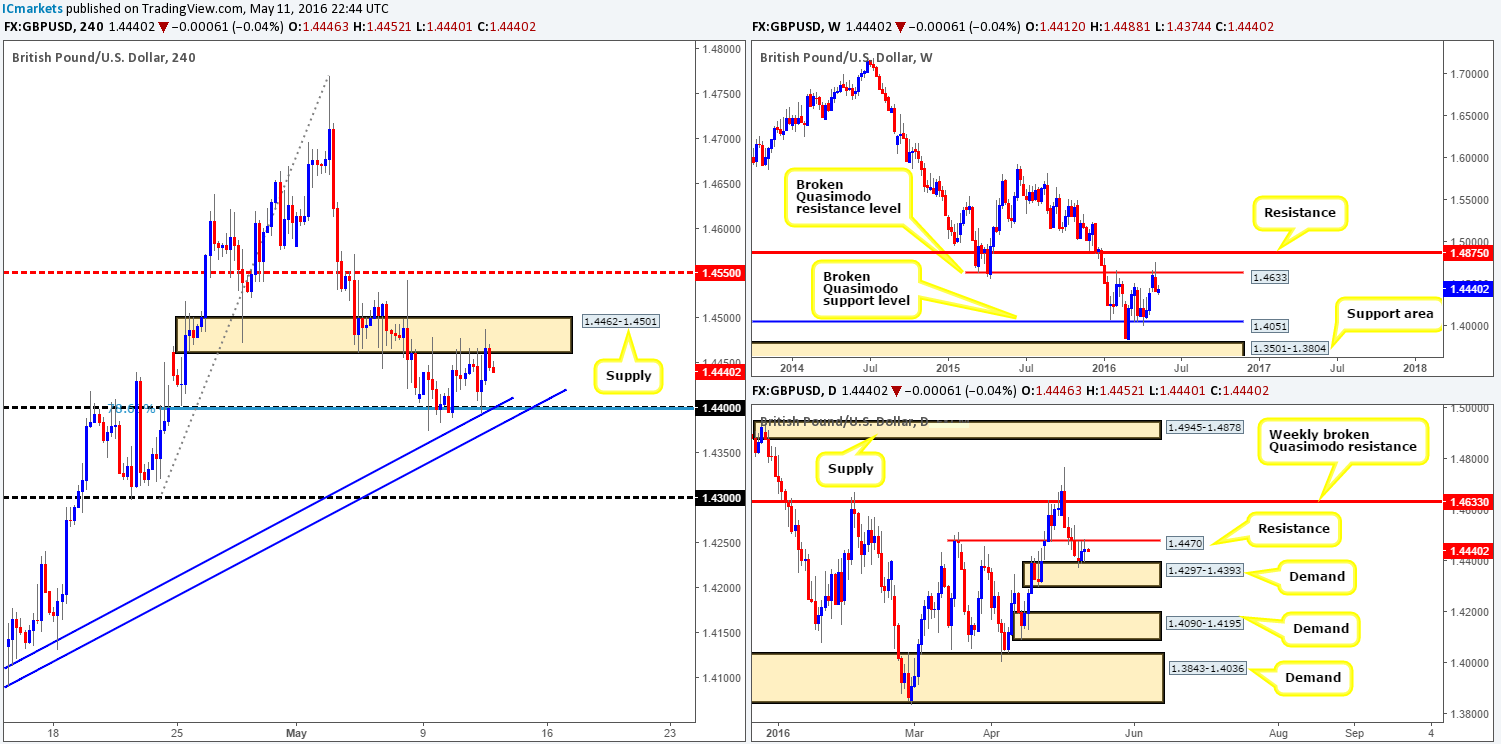
Although Cable rose close to ninety pips yesterday from the 1.4400 hurdle (converges nicely with a H4 trendline taken from lows of 1.4005 and 78.6% H4 Fibonacci support at 1.4399) it was clearly not enough to break free from the current consolidation this pair is in. H4 supply at 1.4462-1.4501 along with the psychological support just mentioned above has capped price since the beginning of the week! It’s likely that this pair will continue to trade within this consolidation ahead of today’s BoE policy meeting.
Technicals over on the weekly chart, however, indicate further selling could be on the cards. Last week’s bearish engulfing candle off the back of a broken weekly Quasimodo resistance line at 1.4633 shows price may be heading down towards support at 1.4051 – another broken weekly Quasimodo line. Daily action on the other hand, is presently sandwiched between daily demand chalked up at 1.4297-1.4393 and daily resistance drawn from 1.4470.
In light of the above information, a break above the current H4 supply will be treated cautiously due to price trading from weekly resistance (see above), whilst a close below 1.4400 could be an important bearish cue. If the pound closes below 1.4400 and retests the underside of this barrier as resistance, selling this market down to the 1.4300 hurdle could be something to consider. Granted, by doing so you’d effectively be shorting into daily demand, but let’s not forget that supporting this trade is both the daily and weekly resistances, as well as the large weekly bearish engulfing candle (see above). To be on the safe side though, we would recommend only pulling the trigger here should one be able to spot a nice-looking lower timeframe sell setup (for confirmation techniques, please see the top of this report) following the retest of 1.4400, since fakeouts are common around fixed psychological numbers such as these!
Levels to watch/live orders:
- Buys: Flat (Stop loss: N/A).
- Sells: Watch for price to close below 1.4400 and look to trade any retest seen thereafter (lower timeframe confirmation required).
AUD/USD:
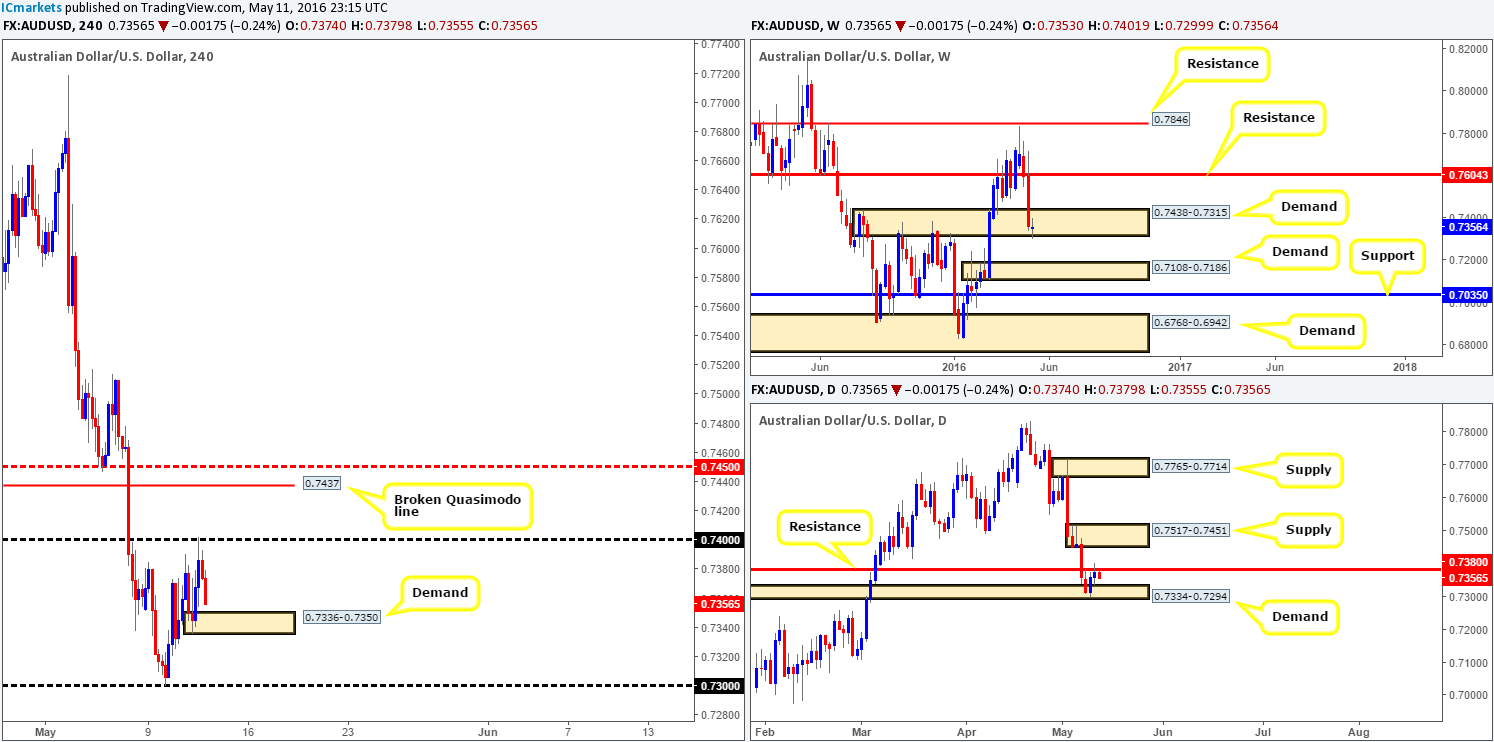
Beginning with a quick look at the weekly chart this morning, we can see that the Aussie dollar remains trading within the confines of weekly demand drawn from 0.7438-0.7315. Quite frankly, however, the reaction from this barrier so far has seen a rather muted response. This could have something to do with daily price currently battling with offers seen around daily resistance coming in at 0.7380. A break beyond this barrier would likely clear the runway north for prices to challenge daily supply at 0.7517-0.7451.
Stepping across to the H4 chart, psychological resistance 0.7400 was, as you can see, very nicely offered going into yesterday’s American session. Assuming that the sellers continue to push lower from here, it looks very much like we’re going to see the commodity currency connect with H4 demand at 0.7336-0.7350 in the next few hours. Buying from this barrier is a risky play in our book. Yes, we do see weekly price in demand, but without a close above the current daily resistance, the H4 demand could very well be ignored (see above). On a more positive note, Gold has just cleared a relatively major H4 resistance at 1269.6 which could propel the Aussie higher today. Nevertheless, we just do not feel comfortable trading this pair today given price structure, therefore we’ll remain flat until more conducive action presents itself.
Levels to watch/live orders:
- Buys: Flat (Stop loss: N/A).
- Sells: Flat (Stop loss: N/A).
USD/JPY:
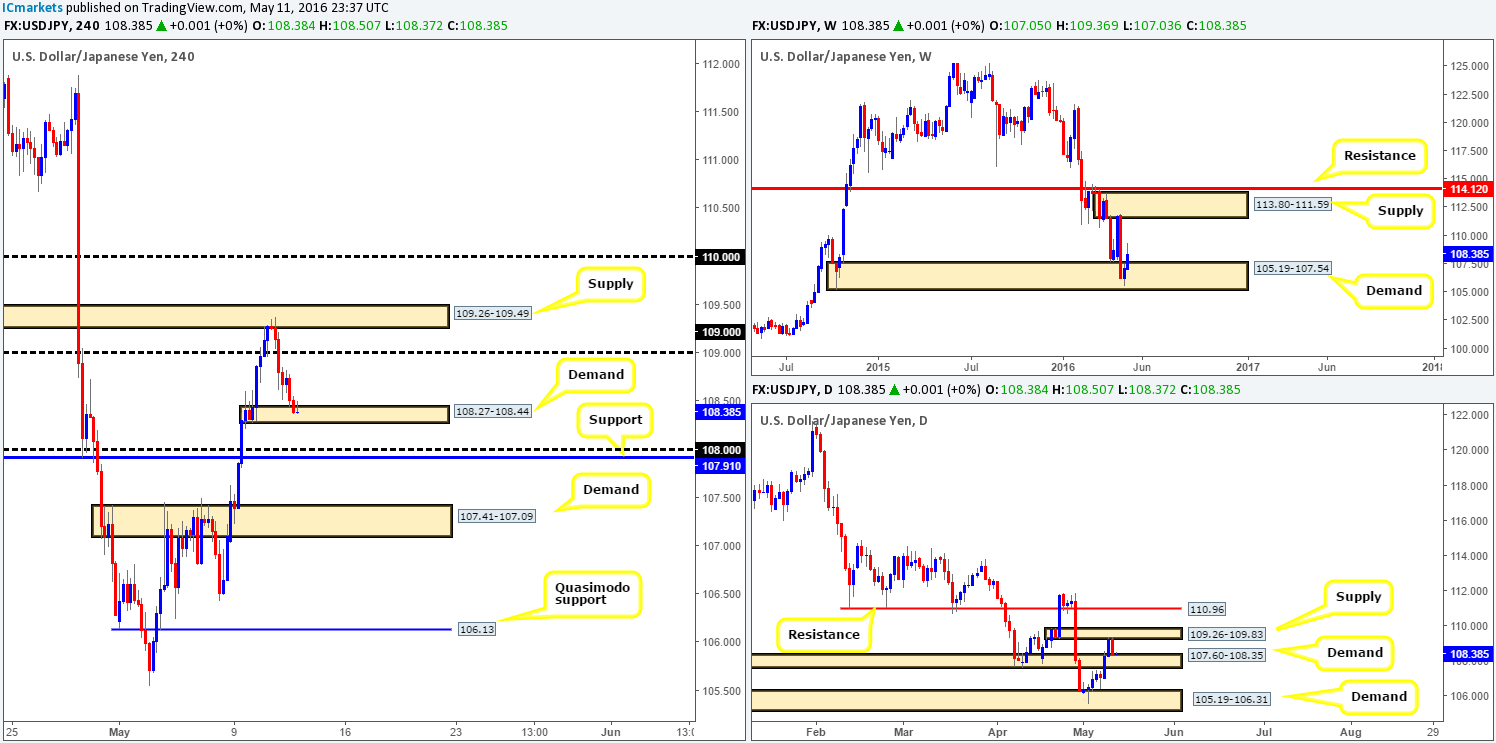
Following Tuesday’s collision with H4 supply at 109.26-109.49, the USD/JPY pushed lower going into yesterday’s sessions on the back of weak market sentiment. This saw price smash through bids around the 109.00 handle and drive into a small H4 demand zone carved from 108.27-108.44 by the day’s end. Although this H4 barrier is small and appears not to have broken anything significant to the left, it does sit on top of daily demand at 107.60-108.35. In addition to this, let’s also be mindful to the fact that the weekly chart shows price is currently involved with a rather large demand base coming in at 105.19-107.54. Under these circumstances, our team has stamped the current H4 demand as a viable zone in which to begin looking for long trades.
Now, it is of course down to the individual trader if he/she deems this area fit for a market entry or not. We, even though the weekly and daily timeframes support this zone, are still going to wait for lower timeframe confirmation for the simple reason that price may fake lower to connect with the 108.00 handle before driving higher (for confirmation techniques, please see the top of this report). Remember, 27 pips is not a big move on the H4 chart especially with a JPY pair!
Levels to watch/live orders:
- Buys: 108.27-108.44 [Tentative – confirmation required] (Stop loss: dependent on where one confirms this area).
- Sells: Flat (Stop loss: N/A).
USD/CAD:
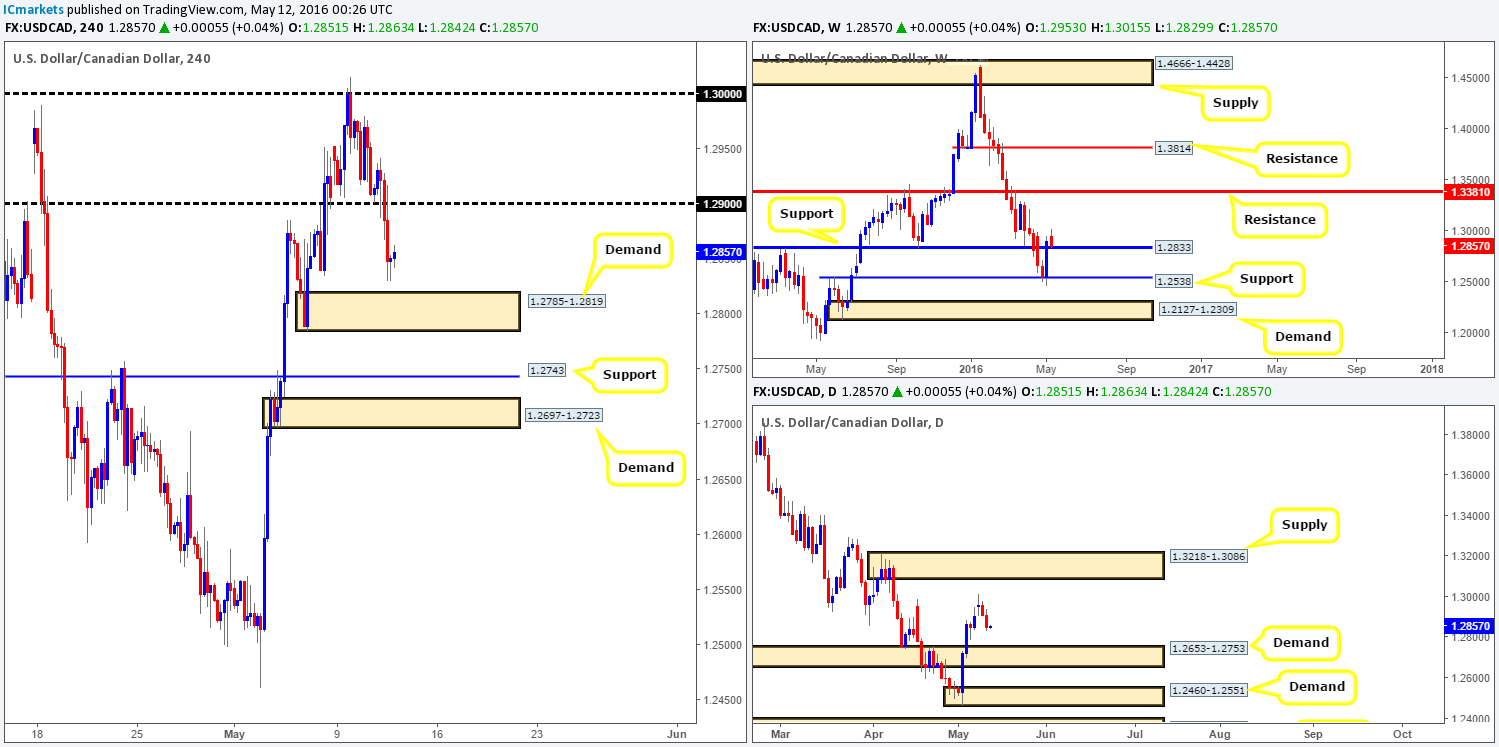
The USD/CAD pair, as you can see, fell yesterday following a drop in U.S. Oil inventories, consequently strengthening the Canadian dollar. However, with Oil now trading within shouting distance of daily supply seen at 48.33-46.53 and weekly support at 1.2833 on the USD/CAD now being retested, we may see this pair bounce back today. Looking down to the daily chart, nevertheless, price appears free to continue dropping lower until daily demand at 1.2653-1.2753. Meanwhile, over on the H4 chart, other than minor support currently being seen from the 1.2830 mark, H4 demand sits just below at 1.2785-1.2819.
With the above in mind, our team is going to be looking to buy at the following areas today:
- H4 demand at 1.2785-1.2819. This zone sits directly beneath the current weekly support at 1.2833, so do keep a close eye on this barrier!
- H4 support at 1.2743. This line is positioned within the current daily demand base at 1.2653-1.2753.
- H4 demand at 1.2697-1.2723. Also is located within the current daily demand base at 1.2653-1.2753.
Due to there being three possible entry points, we are not going to be placing pending orders. Instead, we plan to set alerts at each zone and analyse the lower timeframe price action before deciding whether or not to take a trade (for confirmation techniques, please see the top of this report).
Levels to watch/live orders:
- Buys: 1.2785-1.2819 [Tentative – confirmation required] (Stop loss: dependent on where one confirms this area). 1.2743 region [Tentative – confirmation required] (Stop loss: dependent on where one confirms this area). 1.2697-1.2723 [Tentative – confirmation required] (Stop loss: dependent on where one confirms this area).
- Sells: Flat (Stop loss: N/A).
USD/CHF:
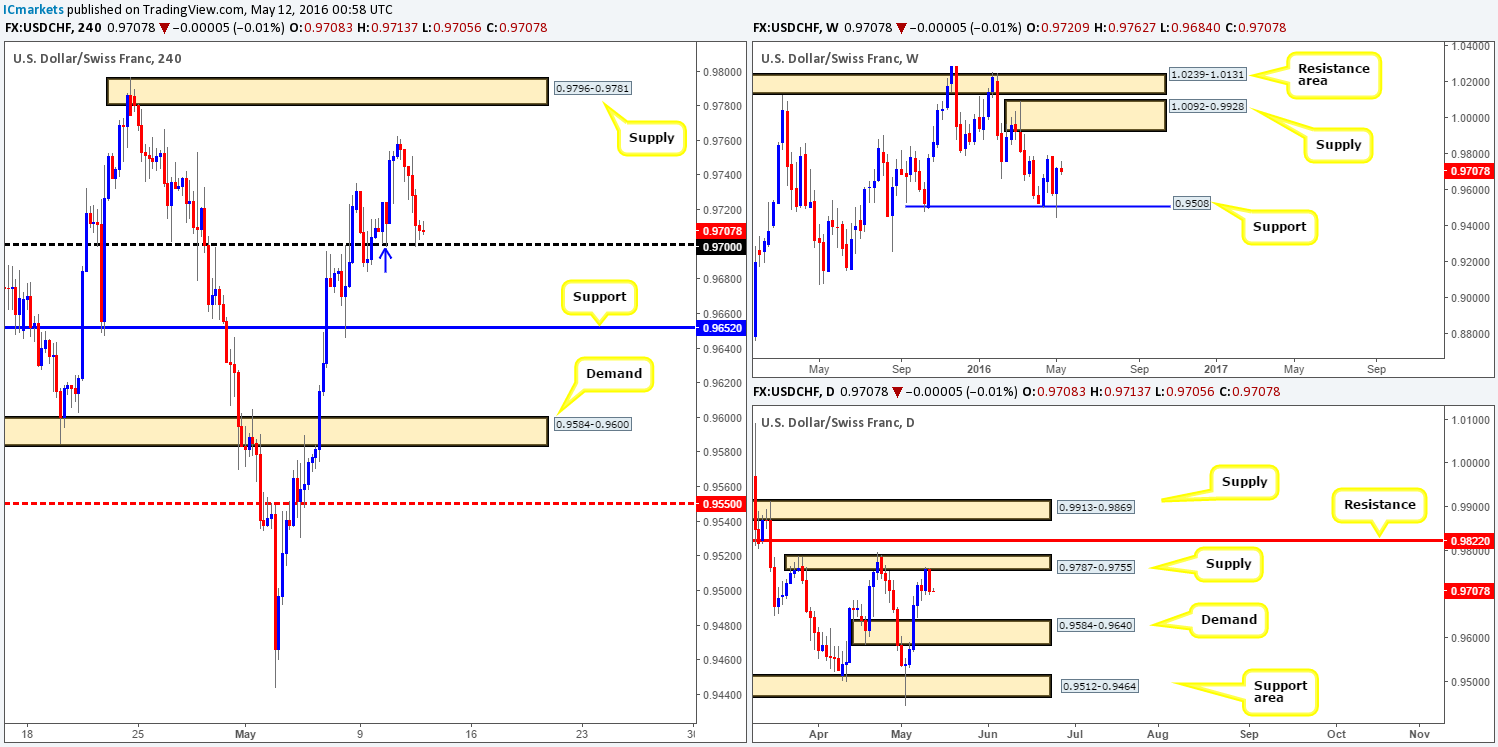
Amid yesterday’s trading, the Greenback sold off against the Swiss Franc, resulting in price clawing back all of yesterday’s gains. The pair then settled around the 0.9700 handle going into to the close which for now appears to be holding firm.
In that price is trading around a line that was used to push prices higher on the 10th May (see blue arrow), would we consider this a suitable area in which to look for buy trades today? Well, with yesterday’s selling likely accountable to the daily supply area at 0.9787-0.9755, 0.9700 could give way today and head down to H4 support at 0.9652. Granted, weekly price did recently bounce from weekly support at 0.9508, but judging by the reaction seen from the aforementioned daily supply yesterday, we may see the sellers take over. Therefore, instead of looking to buy from 0.9700, we’re going to be watching for H4 price to break below and retest 0.9700 as resistance for a possible (confirmed) short trade down to the above said H4 support (for confirmation techniques, please see the top of this report).
Levels to watch/live orders:
- Buys: Flat (Stop loss: N/A).
- Sells: Watch for price to close below 0.9700 and look to trade any retest seen thereafter (lower timeframe confirmation required).
DOW 30:
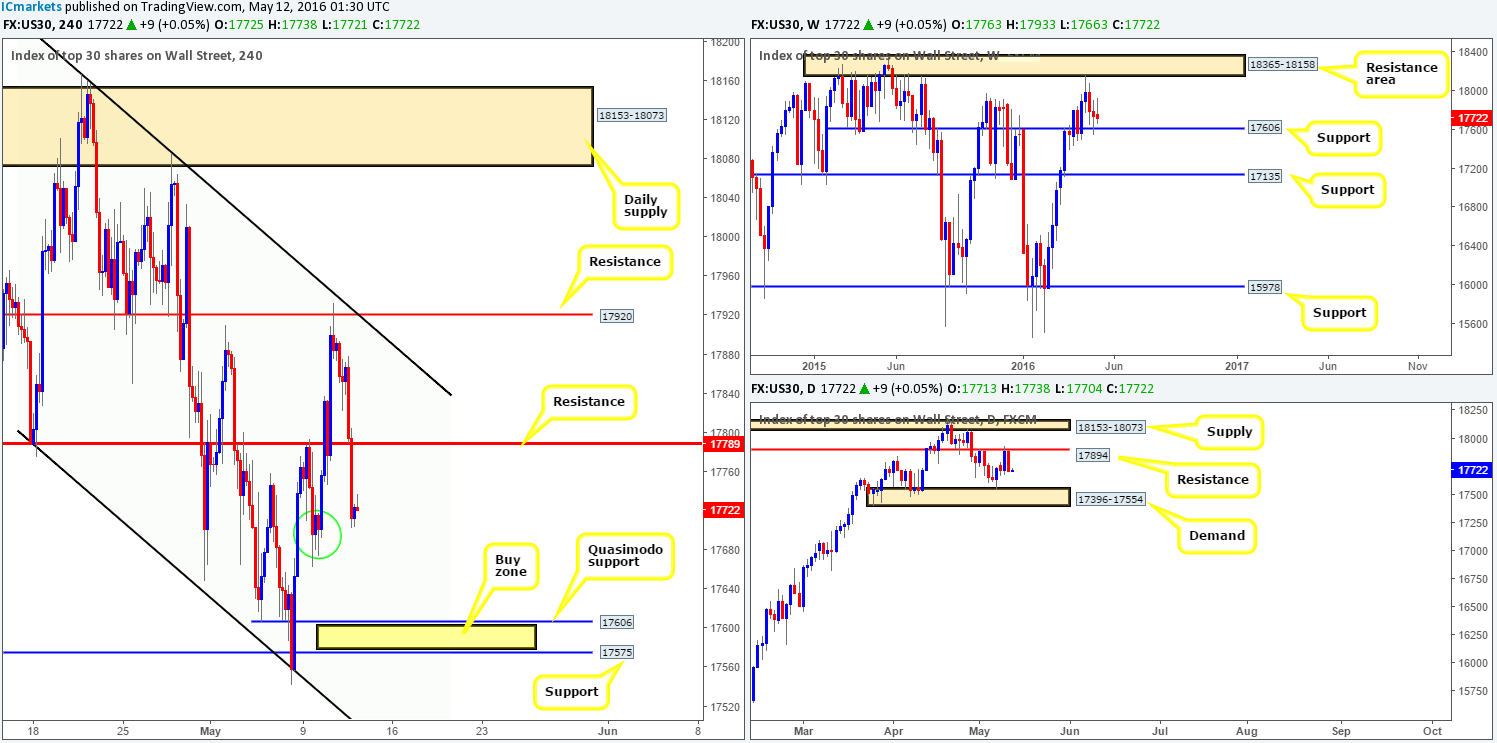
U.S. stocks took a right clobbering going into yesterday’s American session, dropping around 140 points by the session’s end. In our previous report on the DOW, our team highlighted that they were interested in shorting from the H4 resistance line at 17920, but would not commit to a position unless there was lower timeframe confirmation to support a sell. Unfortunately, there was little price action, at least as far as we saw, to permit a short. Well done to any of our readers who jumped in on this one!
From the H4 chart, you’ll notice that price is now beginning to bottom out around H4 demand seen marked with a green circle at 17663-17702. Although price is currently holding here, we feel it may be short-lived due to the more attractive zone sitting just below. Check out the H4 Quasimodo support at 17606 which ties in perfectly with weekly support. Furthermore, directly below this level sits demand at 17575 which is positioned only a few points above daily demand at 17396-17554. These two higher-timeframe barriers form a very nice buy zone (yellow area) in our opinion, and is certainly somewhere our team will consider buying should price reach this low this week. Whether we enter at market here or not though will depend on how price approaches the buy zone and also the time of day. However, more than likely we’ll wait for a lower timeframe entry within our buy zone due to the possibility that price may fake slightly lower to connect with the aforementioned daily demand. To see how we look for lower timeframe confirmation, please see the link below and follow our techniques written at the top of the report.
Levels to watch/live orders:
- Buys: 17575/17606 [Tentative – confirmation required] (Stop loss: dependent on where one confirms this area).
- Sells: Flat (Stop loss: N/A).
GOLD:
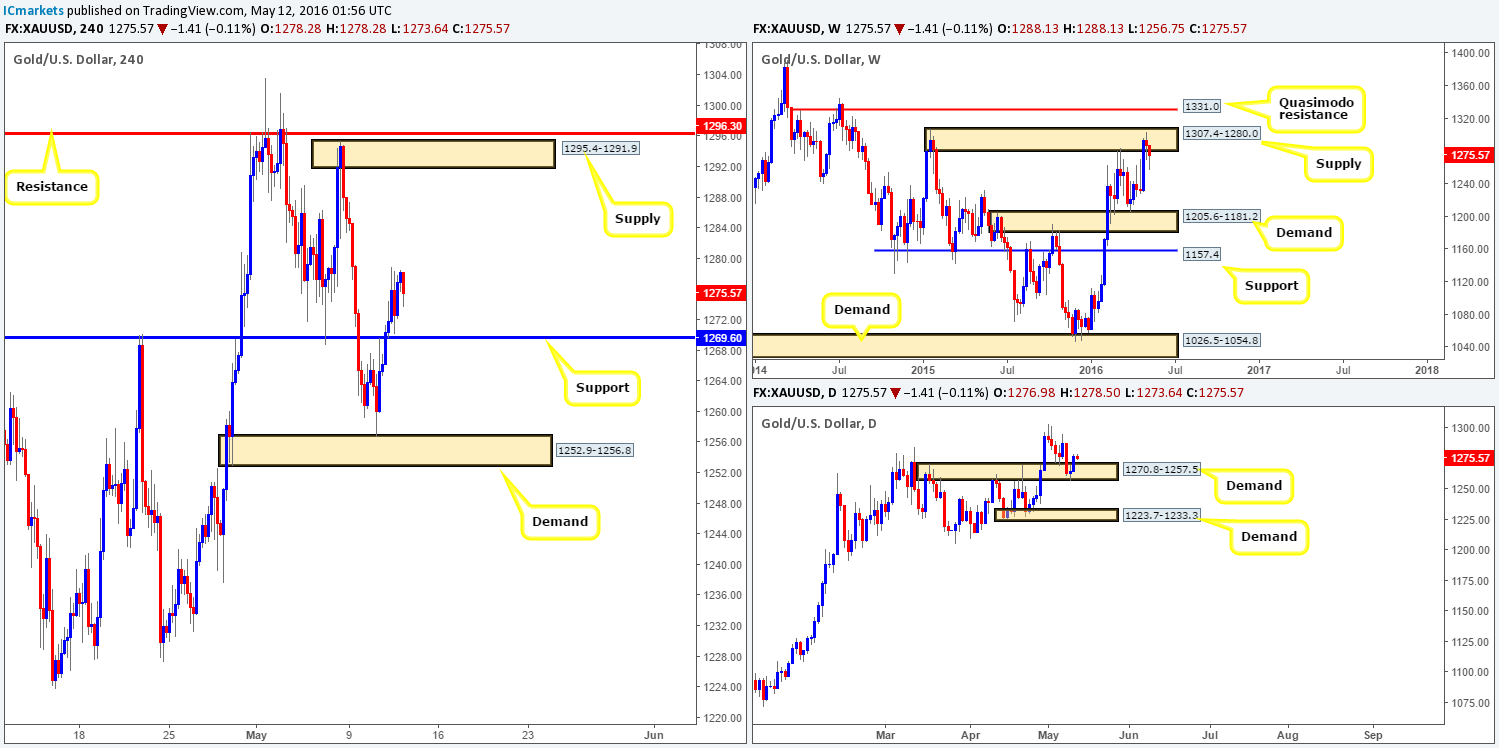
Benefiting from a weak dollar yesterday, the yellow metal climbed to highs of 1278.9 mid-ways through London trading. Following this, price sold-off which saw this market come within a few pips of retesting 1269.6 – a H4 resistance-turned support.
To our way of seeing things right now, the path north on the H4 chart appears relatively free up until H4 supply coming in at 1295.4-1291.9. This – coupled with daily action seen recovering from daily demand at 1270.8-1257.5, a bullish advance could possibly take place. BUT, there seems to always be a ‘but’ at the moment – looking up to the weekly chart this market has been capped by a weekly supply chalked in at 1307.4-1280.0 for nearly two weeks now. So buying into this area from the lower timeframe zones discussed above may not be such a good idea unless you’re considering intraday positions.
Similar to the AUD/USD which is highly correlated with this market, our team has come to a general consensus that remaining flat for the time being is the best path to take.
Levels to watch/live orders:
- Buys: Flat (Stop loss: N/A).
- Sells: Flat (Stop loss: N/A).


