
EUR/USD:
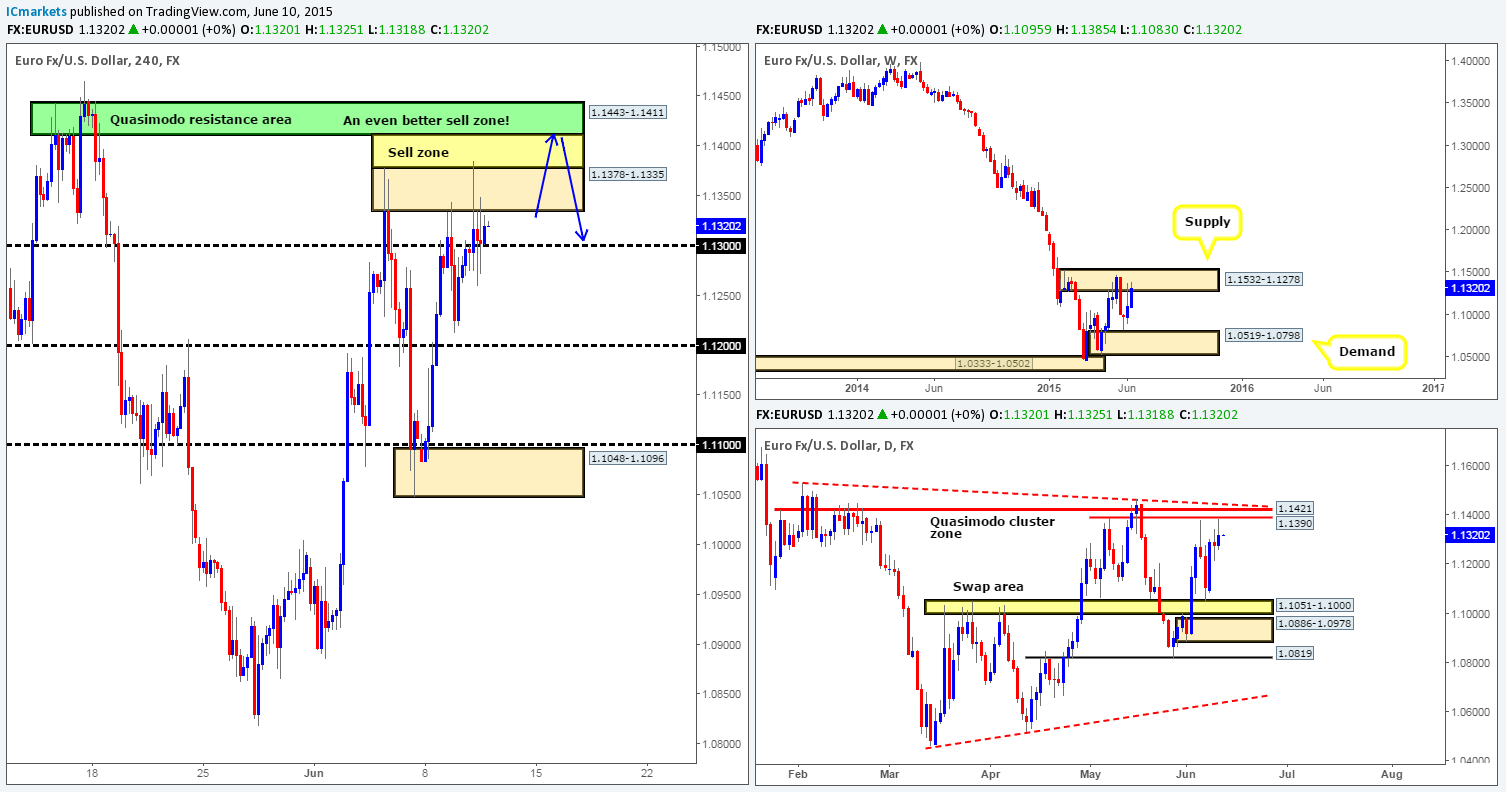
Weekly view – From the weekly timeframe, we can see that price is now crossing swords with the weekly supply area coming in at 1.1532-1.1278 again. This supply zone is a very significant hurdle in our opinion since if there is a sustained break above this area, our long-term bias on this pair will very likely shift north.
Daily view: Yesterday’s daily action shows that price came within FIVE pips of hitting the daily Quasimodo cluster zone coming in at 1.1390/1.1421 (located relatively deep within the aforementioned weekly supply area) before selling off.
4hr view: During the course of yesterday’s sessions, price aggressively pushed above the round number 1.1300, and attacked our first sell zone seen in yellow (between the 4hr supply area at 1.1378-1.1335 and a 4hr Quasimodo base at 1.1443-1.1411). As you can see, the rebound from this yellow sell zone was violent, and as a result pushed price back down to the 1.1300 region.
Given the fact that price is trading not only within a clear weekly supply zone, but at the same time is also loitering so very close to a daily Quasimodo cluster area (see above) at the moment, we believe this market will eventually sell off. Now that price has tagged our first sell zone in yellow (no confirming signal was seen to short unfortunately), the only place we’d feel confident in selling this pair is around the aforementioned 4hr Quasimodo base (located deep within both higher timeframe resistances). A pending sell order has been set just below at 1.1407 with a stop placed above at 1.1469.
One may be thinking that if we’re expecting price to rally up to the 4hr Quasimodo base today, would it be an idea to enter long up to this area? We’re afraid that is down to each individual trader. For us personally, however, we do not like the idea (even though we expect a rally) of entering long into clear higher timeframe opposition.
Levels to watch/live orders:
- Buys: Flat (Stop loss: N/A).
- Sells: 1.1407 (Stop loss: 1.1469).
GBP/USD:
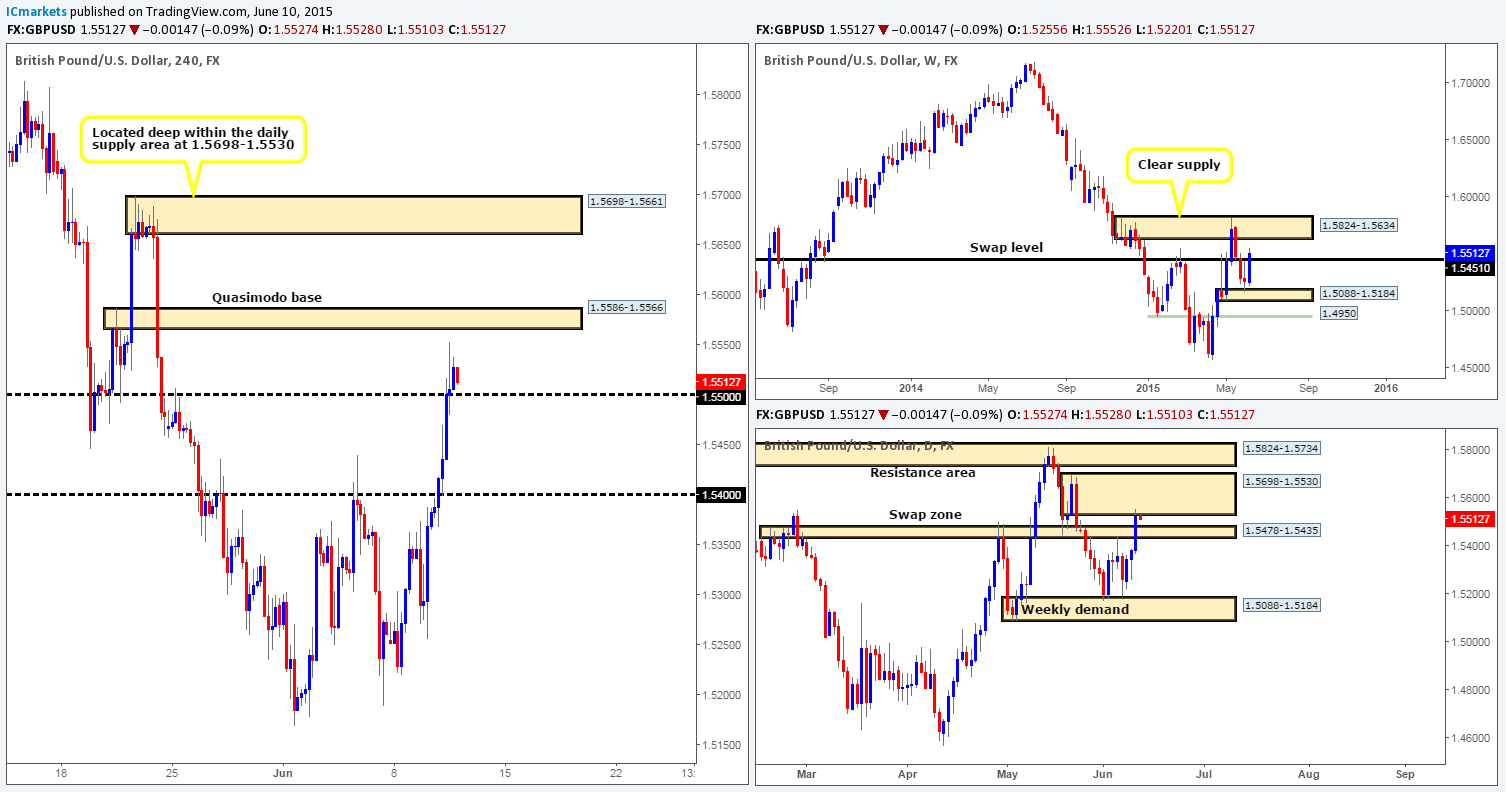
Weekly view – Recent events reveal that the GBP has edged its way above a major weekly swap level coming in at 1.5451. In the event that the buyers can maintain their position above this number, it is likely price will be shaking hands with the weekly supply area seen just above at 1.5824-1.5634 sometime soon.
Daily view: From the daily timeframe, we can see that price strongly broke above a daily swap zone at 1.5478-1.5435 during yesterday’s sessions. This, as a result, saw price connect with a rather sturdy looking daily supply area coming in at 1.5698-1.5530 (located just below the aforementioned weekly supply area).
4hr view: Sterling’s recent advance took out 1.5400 with little trouble, and if you look to a low enough timeframe, you’ll also see there was a beautiful trading opportunity on the retest. Price, as you can see, continued marching north from here and broke above 1.5500 going into yesterday’s close 1.5527.
With price now touching the lower limits of a daily supply area at 1.5698-1.5530, there is a good chance that the market may decline in value – when and by how far is anyone’s guess at the moment. The reason we say this is simply because we’re not sure what to make of the weekly chart at the minute. If price closes above the weekly swap level at 1.5451, then we’d be quite confident further buying will take place. If a close higher is not seen, however, then we believe price is likely going to fall going into next week.
Regarding today’s movement and possibly tomorrows, we are going to be closely watching the following areas for potential (confirmed) selling opportunities. The first comes in at 1.5586-1.5566, a 4hr Quasimodo base. The second is a clear 4hr supply area seen at 1.5698-1.5661. Both of these above zones are located within the aforementioned daily supply area.
Levels to watch/ live orders:
- Buys: Flat (Stop loss: N/A).
- Sells: 1.5586-1.5566 [Tentative – confirmation required] (Stop loss: 1.5610) 1.5698-1.5661[Tentative – confirmation required] (Stop loss: 1.5710).
AUD/USD:
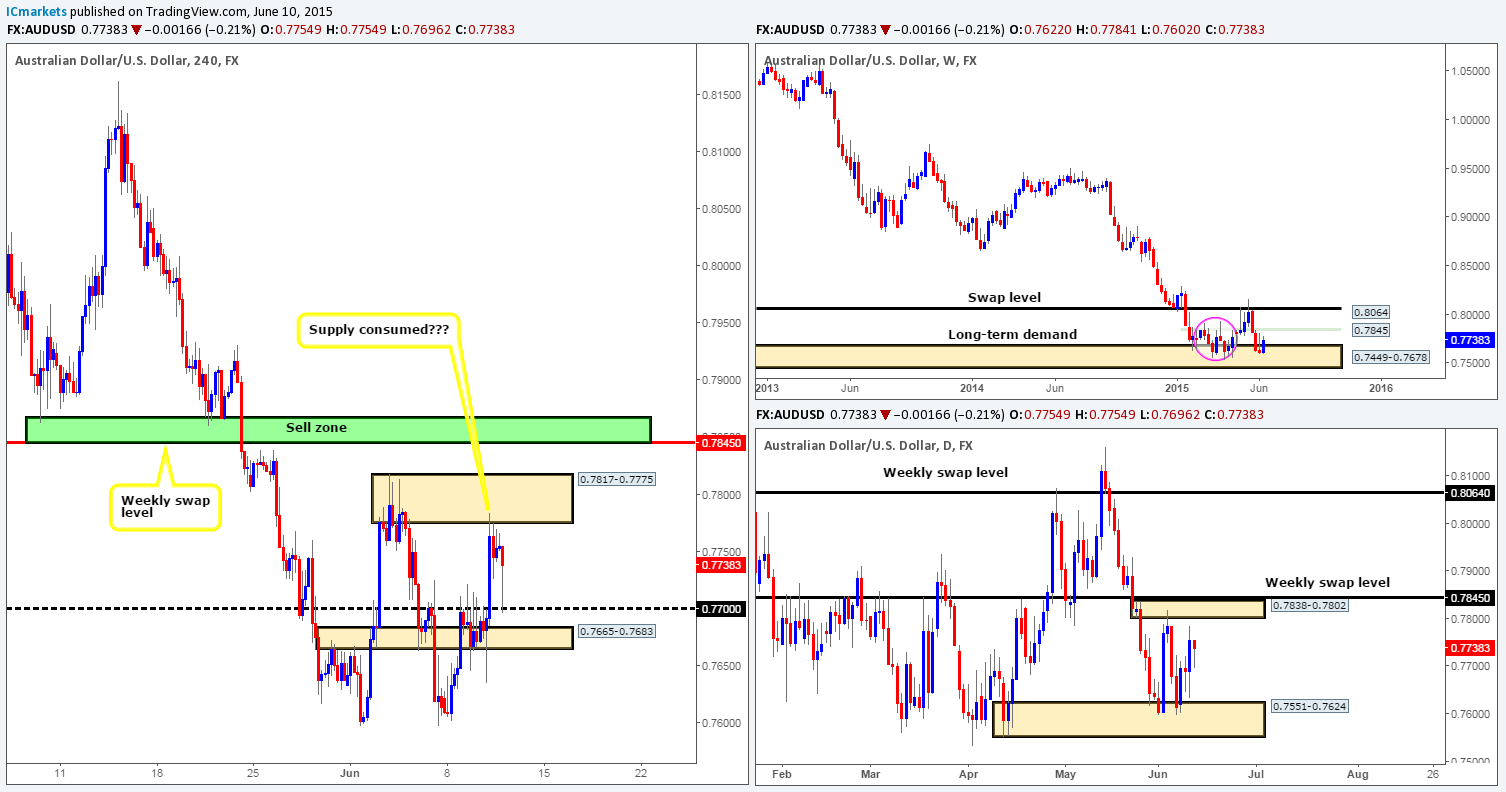
Weekly view – Following the push seen into the weekly demand area at 0.7449-0.7678, last week’s trading action shows that price printed an inverted weekly pin-bar candle. To some traders this may be a sign that the market wants higher prices – a reversal signal, and they could very well be right considering where the candle pattern formed. Nevertheless, Judging by the sloppy reaction seen (pink circle – 02/02/15-06/04/15) at this zone a few months earlier, things could potentially get messy here before we see any decisive move take place. From a long-term perspective, the trend direction on this pair is still very much south in our opinion, and will remain this way until we see a convincing break above 0.8064.
Daily view: Yesterday’s daily action propelled the AUD/USD pair north to a high of 0.7784. On the condition that this buying continues, we might, just might, see price challenge the small daily supply area at 0.7838-0.7802 (positioned just below a minor weekly swap level at 0.7845) sometime soon.
4hr view: For those who read yesterday’s report, you may recall that we were watching for price to break above 0.7700, since we saw very little resistance above this number to our final take-profit target – the 4hr supply area at 0.7817-0.7775 (positioned just below the aforementioned daily supply area). As you can see, our target was hit and our trade from 0.76230 has now been closed with very favorable risk/reward.
The rebound from the aforementioned 4hr supply zone, however, aggressively pushed price back down to retest the 0.7700 handle, which at the time of writing is just as aggressively being defended. Assuming that most of the selling pressure has been consumed around the current 4hr supply area, and the buyers can continue with this tempo today, we may see price continue to advance up to the weekly swap sell zone seen in green at 0.7867-0.7845. This barrier would be the only place we’d consider shorting this pair for the time being.
Levels to watch/ live orders:
- Buys: Flat (Stop loss: N/A).
- Sells: 0.7867-0.7845 [Tentative – confirmation required] (Stop loss: 0.7875).
USD/JPY:
Weekly view – From this angle, we can see that price is currently selling off nicely from a weekly swap level seen at 125.44. On the assumption that the sellers continue with this intensity, it is likely price will greet the minor weekly swap level at 121.57 sometime soon. Despite this recent decline in value, however, the long-term uptrend on this pair is still very much intact, and will remain that way in our opinion until the weekly swap level 115.50 is consumed.
Daily view: From this viewpoint, we recently witnessed price take out a daily swap area seen at 123.65-123.20, which in turn has likely cleared the path south down towards a daily swap level coming in at 121.83.
4hr view: During the beginning of yesterday’s sessions, price aggressively sold off from a small 4hr supply area at 124.72-124.46. Our long trade from 123.94 was obviously a failure, and in hindsight, a really silly mistake on our part when we were already short the U.S Dollar from our previous Aussie trade.
The recent descent took out several 4hr technical barriers during its onslaught. It was only once price tapped the mid-level number 122.50 did the market begin to stabilize. Buying from 122.50 is considered a risky trade in our book due to very little supportive structure being seen from the higher timeframes at the moment (see above). With regards to selling, however, we’d be relatively comfortable shorting in between 123.00 and 123.20 (pink line). The reason for why is simply because 123.20 is the lower limit of the aforementioned daily swap area, and on top of this, there is no weekly support seen at least until 121.57 – meaning there is room for price to move south. For anyone considering selling between 123.00 and 123.20 if price reaches this high, we would strongly advise waiting for lower timeframe confirming price action here on the grounds that price could spike higher into the daily swap area just mentioned.

Levels to watch/ live orders:
- Buys: Flat (Stop loss: N/A).
- Sells: 123.00/123.20 (Stop loss: dependent on where one confirms this area).
USD/CAD:
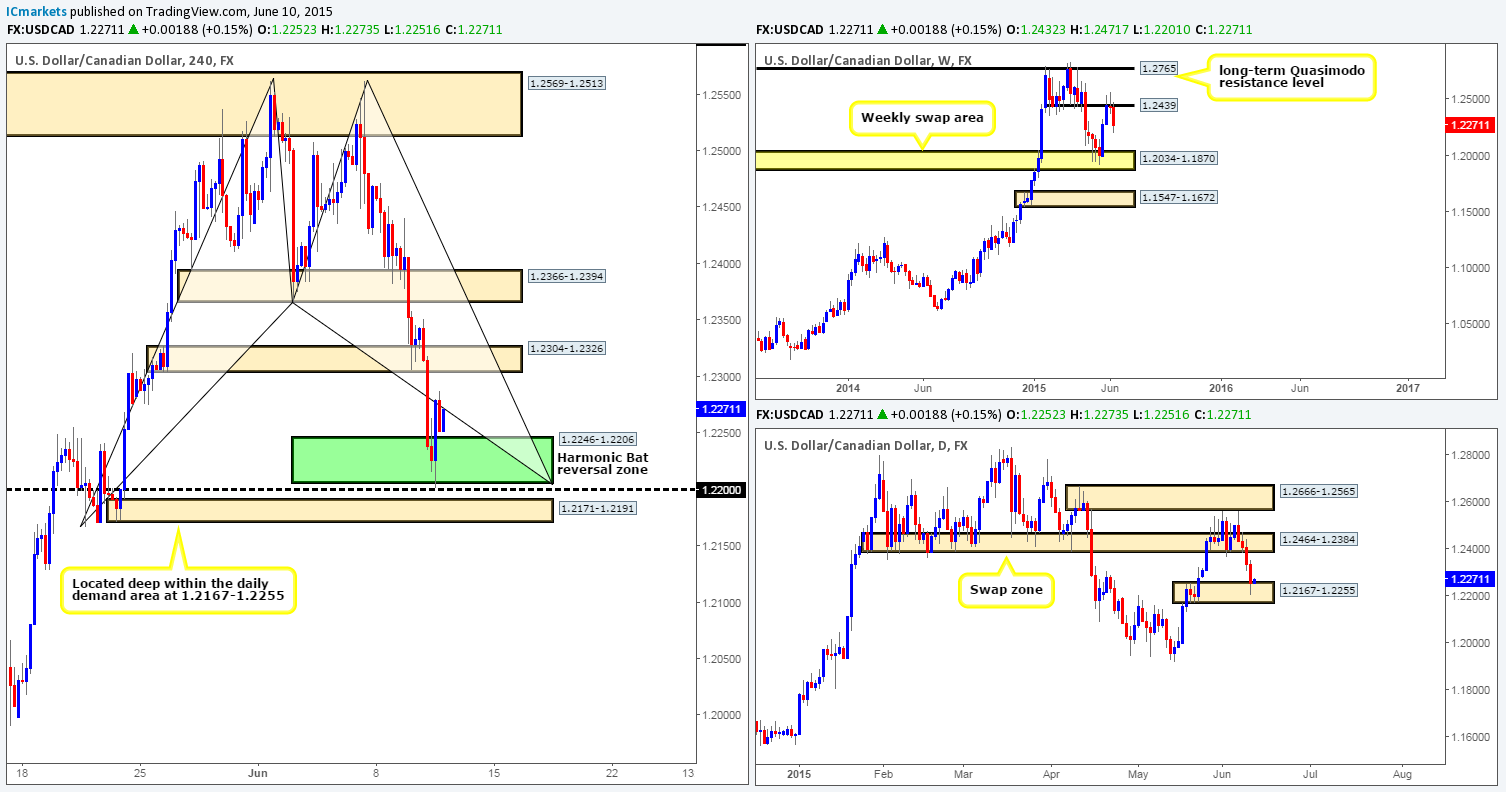
Weekly view – After a little tug-of-war around the weekly swap level 1.2439, the sellers, at this point in time, appear to be taking control. Overall though, our long-term bias on this pair is long. It will only be once we see a break below the aforementioned weekly swap area would our present bias likely shift.
Daily view: From this viewpoint, we can see that price has now crossed swords with a fresh daily demand area coming in at 1.2167-1.2255.
4hr view: The 4hr timeframe shows price recently rebounded from the Harmonic Bat reversal zone seen in green at 1.2246-1.2206 (located deep within the aforementioned daily demand area). However, if you look closely, the Harmonic zone was actually faked by a few pips into the round number below at 1.2200. At the time of writing, we do not have a position long from this Harmonic zone. We have seen confirmation on the lower timeframes mind you, but until price retraces to the 1.2223 region, we will not be placing any long orders. In the event that 1.2223 is indeed hit today, our stop would be placed below the aforementioned daily demand area at 1.2155, and our first take-profit target is likely going to be set around the1.2300 mark, just below the 4hr swap area at 1.2304-1.2326.
Levels to watch/ live orders:
- Buys: 1.2223 (Stop loss: 1.2155).
- Sells: Flat (Stop loss: N/A).
USD/CHF:
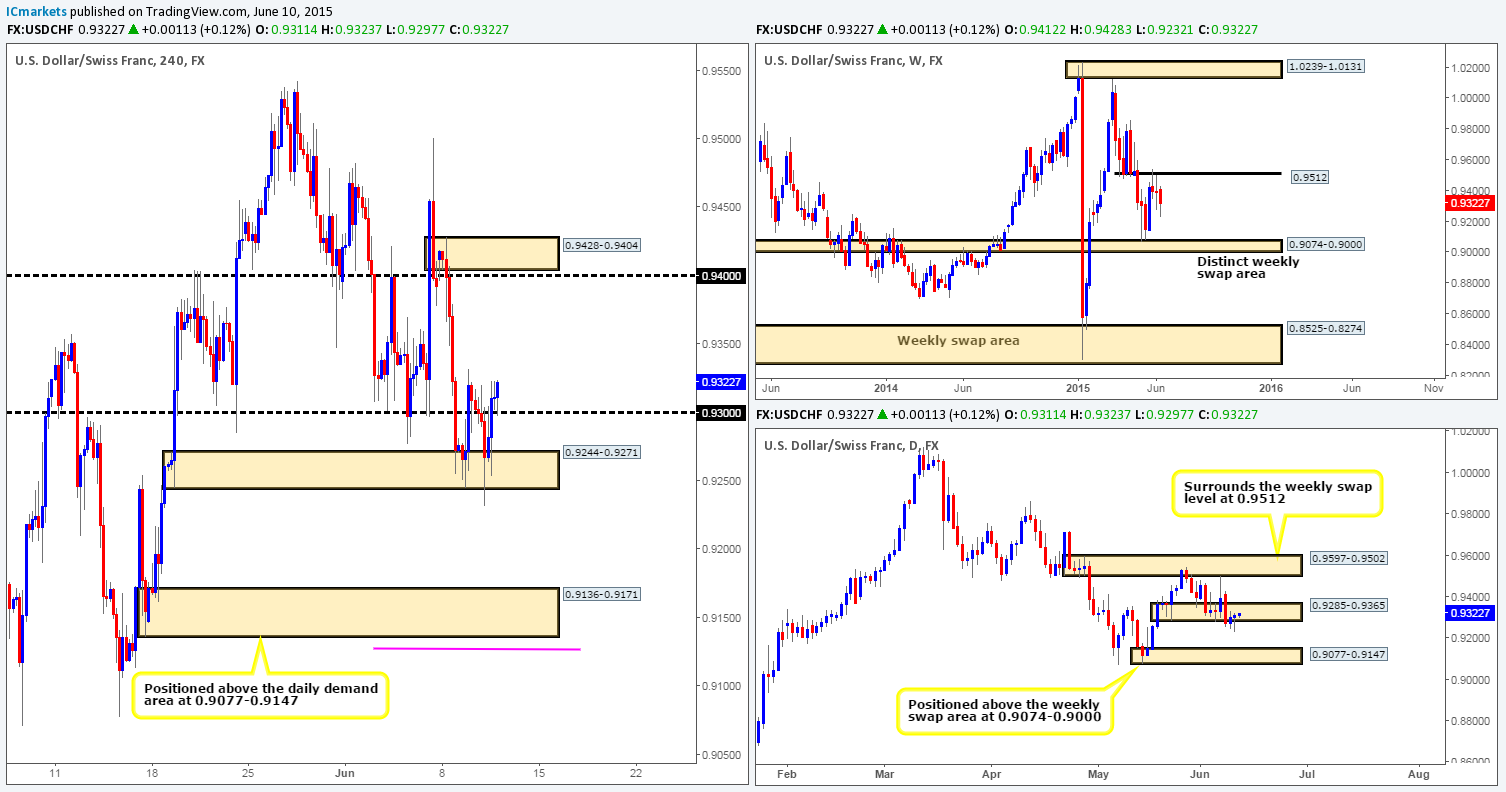
Weekly view – Last week’s trading shows that the USD/CHF pair managed to hold out below the weekly swap level at 0.9512, which as you can probably see formed a weekly indecision candle in the process. So far this week, however, the sellers appear to have regained control of this market. If this continues, its likely price will connect with the weekly swap area seen at 0.9074-0.9000.
Daily view: Following Monday’s push below the daily demand area at 0.9285-0.9365, we can see that price is currently retesting this zone as supply.
4hr view: From the pits of the 4hr timeframe, we can see that price recently faked below the 4hr demand area at 0.9244-0.9271, which as a result, propelled this market north back above 0.9300. As such, much of today’s analysis will be the same as the previous.
Should 0.9300 hold going into the more liquid sessions today, we see very little resistance on this timeframe until price reaches 0.9400.However, in buying from this round-number barrier, you would in all likelihood be going up against not only supply from the daily timeframe, but also weekly sellers from the weekly swap level (see above). Therefore, as far as we can see, unless traders are willing to risk buying from 0.9300, there is no immediate opportunity to trade this pair.
Given the points made above, our team has come to a general consensus that remaining on the sidelines is by far the best position for us to take today.
Levels to watch/ live orders:
- Buys: Flat (Stop loss: N/A).
- Sells: Flat (Stop loss: N/A).
US 30:
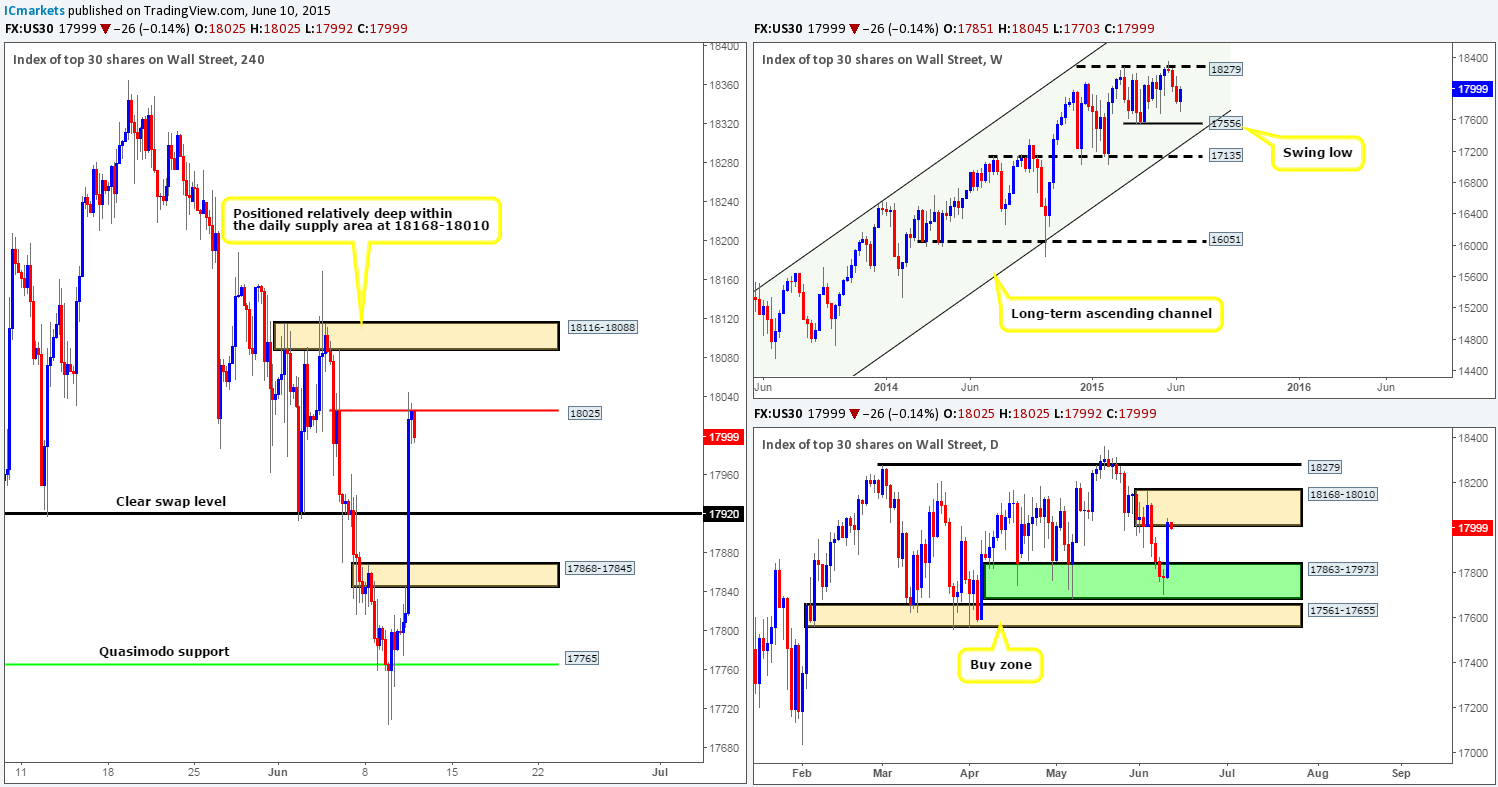
Weekly view – Following the sell off from 18279, recent buying interest has begun to come into the market from 17703. From a long-term perspective, however, the overall uptrend on this index is still very strong, and will remain this way until see a convincing push below 16051.
Daily view (Slightly revised): From this timeframe, we can see that the recent buying came about during yesterday’s session from within a daily buy zone marked in green at 17863-17973. The move from here consequently drove price into the jaws of a daily supply area coming in at 18168-18010.
4hr view: The DOW’s recent advance on this timeframe took out multiple 4hr roadblocks during its assault. It was only once price connected with 18025 did the market begin to slow down.
Considering price is currently dancing around the lower limits of daily supply at 18168-18010 at present, selling from 18025 is most certainly a valid trade in our book. However, rather than just jumping into the market now and hoping for the best, we’d much prefer to see some sort of lower timeframe confirming signal here before – preferably an engulf of demand. Even with confirmation at this 4hr level though, one would need to remain vigilant to the fact that if the market wants to continue rallying higher, there is very little resistance seen on the weekly scale to stop it until back up at 18279. Therefore, closely monitoring any shorts taken from this 4hr level is highly recommended.
In the event that a break above 18025 is seen on the other hand, the 4hr Quasimodo base at 18116-18088 (located deep within the aforementioned daily supply area) would likely be the next objective to reach. Nevertheless, trading this move would require not only a retest of 18025 as support, but also a lower timeframe buying signal which allowed a logical, but small stop loss.
Levels to watch/ live orders:
- Buys: Flat (Stop loss: N/A).
- Sells: 18025 [Tentative – confirmation required] (Stop loss: dependent on where one confirms this level).
XAU/USD (Gold)
Weekly view – The weekly timeframe shows there is strong buying currently being seen from the upper limits of a weekly demand area sitting at 1142.5-1167.3. From a long-term perspective, however, gold is still trending south in our opinion. For this bias to be invalidated, a push above the weekly trendline extended from the high 1488.0 would need to be seen.
Daily view: Following Friday’s fakeout below a proven daily buy zone at 1170.3-1184.0, price extended higher during yesterday’s session, consequently touching gloves with a small daily supply area at 1196.2-1188.9.
4hr view: Throughout the course of yesterday’s sessions on this timeframe, the gold market launched itself north breaking above a 4hr supply area seen at 1187.0-1184.3, that just missed connecting with the 4hr supply zone at 1196.2-1192.6 (positioned deep within the aforementioned daily supply area) by a few pips before selling off.
At the time of writing, price is currently dancing within the recently broken 4hr supply area, which of course, is now acting demand. If the buyers can hold out within this zone, we may see gold continue to rally going into today’s sessions, at least until the 4hr supply area mentioned above at 1196.2-1192.6. Our only concern with regards to buying from here is that the daily supply area at 1196.2-1188.9 is presently holding the market lower.
With everything taken into consideration, here is how we intend to play this market today. Our team is going to keep a very close eye on the lower timeframe structure within the current 4hr swap area. If we happen to spot a lower timeframe buy signal here, we would likely take the long on the basis that we’re seeing buying pressure from the weekly demand area at 1142.5-1167.3. First take-profit target would likely be placed at 1192.3 and our stop set at 1183.5.
On the flip side, should this swap area give way today, it is likely price will dive down to test 1180.3, a near-term 4hr swap level. As you can see, the distance between these two zones is small, thus to trade the break, one would have to enter with a very small stop to make it worthwhile from a risk/reward perspective , which in all honesty is not something we’d be comfortable taking part in.

Levels to watch/ live orders:
- Buys: 1187.0-1184.3 [Tentative – confirmation required] (Stop loss: 1183.5).
- Sells: Flat (Stop loss: N/A).