
A note on lower timeframe confirming price action…
Waiting for lower timeframe confirmation is our main tool to confirm strength within higher timeframe zones, and has really been the key to our trading success. It takes a little time to understand the subtle nuances, however, as each trade is never the same, but once you master the rhythm so to speak, you will be saved from countless unnecessary losing trades. The following is a list of what we look for:
- A break/retest of supply or demand dependent on which way you’re trading.
- A trendline break/retest.
- Buying/selling tails – essentially we look for a cluster of very obvious spikes off of lower timeframe support and resistance levels within the higher timeframe zone.
- Candlestick patterns. We tend to only stick with pin bars and engulfing bars as these have proven to be the most effective.
For us, lower timeframe confirmation starts on the M15 and finishes up on the H1, since most of our higher timeframe areas begin with the H4. Stops usually placed 5-10 pips beyond your confirming structures.
EUR/USD:
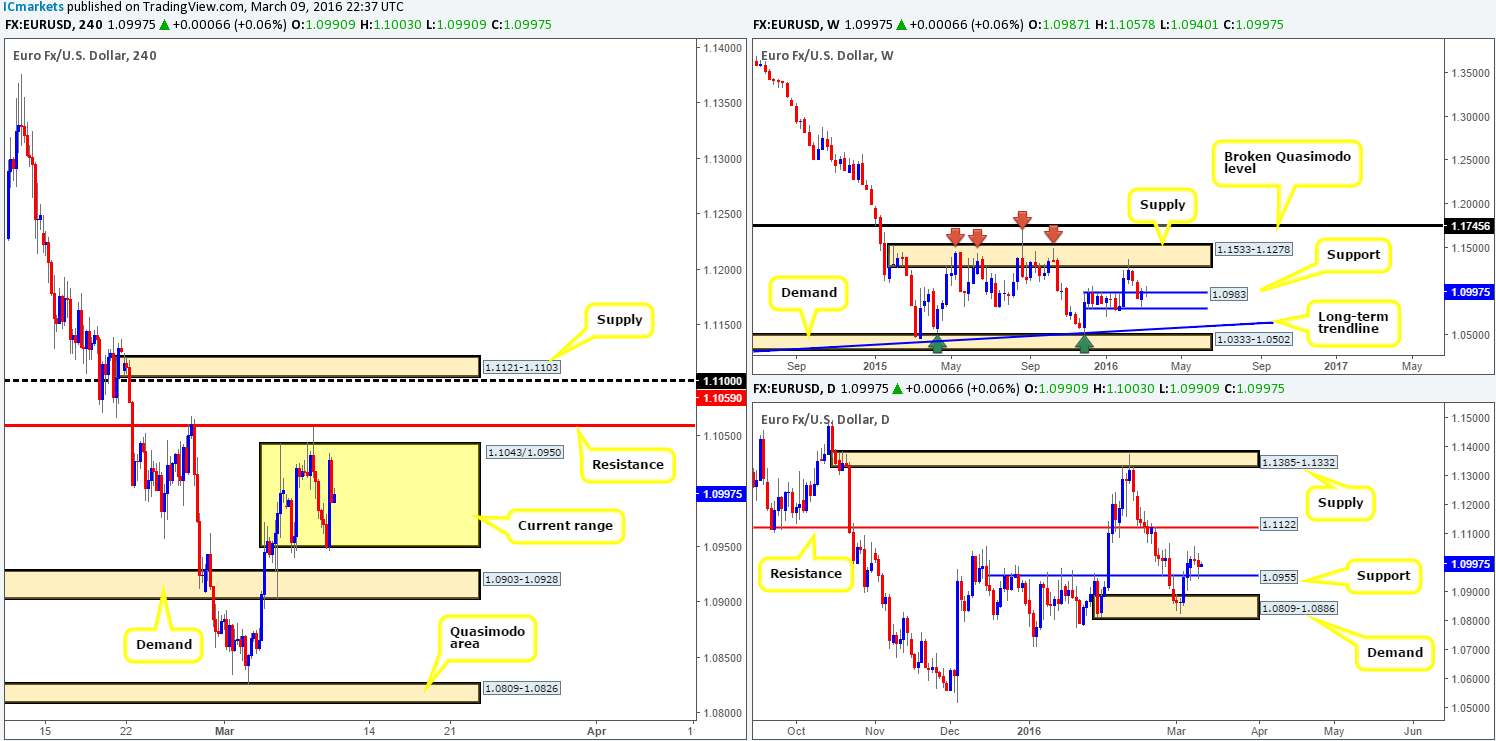
As can be seen on the H4 chart this morning, the EUR aggressively bounced from the mid-level number 1.0950 going into the U.S. session yesterday with little fundamental data backing this move. Consequent to this, price has chalked up a consolidation zone fixed between 1.0950 and 1.1043 ahead of the ECB press conference today at 1.30 pm GMT.
From a technical standpoint, we can see uncertainty around weekly support at 1.0983, whilst on the daily chart price bounced from support at 1.0955 but failed to close higher than its prior close. On the H4 chart, there is a good chance that the current range will remain intact ahead of the ECB meeting, but we’re expecting to see a break once Draghi takes the stage.
Beyond this range, here are the levels we have our eyes on today (due to possible volatility, each barrier requires confirmation from the lower timeframes before a trade can be taken):
- H4 resistance at 1.0959, which has fantastic history.
- H4 supply at 1.1121-1.1103. This area has strong momentum and is located just above the 1.1100 figure. In addition, it is also bolstered by a daily resistance chalked up at 1.1122.
- H4 demand at 1.0903-1.0928 – sits just above daily demand at 1.0809-1.0886 and also surrounds the 1.0900 figure.
- H4 Quasimodo area at 1.0809-1.0826 which sits deep within the extremes of the above said daily demand zone.
Levels to watch/live orders:
- Buys: 1.0903-1.0928 [Tentative – confirmation required] (Stop loss: dependent on where one confirms this area). 1.0809-1.0826 [Tentative – confirmation required] (Stop loss: dependent on where one confirms this area).
- Sells: 1.0959 [Tentative – confirmation required] (Stop loss: dependent on where one confirms this level). 1.1121-1.1103 [Tentative – confirmation required] (Stop loss: dependent on where one confirms this area).
GBP/USD:
Throughout the course of yesterday’s sessions, Cable saw relatively subdued price action on the H4 chart as the market whipsawed back and forth through the 1.4200 figure. This made little change to the weekly chart which shows price continues to hover above a broken Quasimodo line at 1.4051. Down on the daily chart, however, an indecision candle formed around the underside of a resistance level drawn from 1.4231. In the event that this level holds ground, the next downside target to keep a tab on is support coming in at 1.4079.
Similar to Wednesday’s report, we’re still not keen on trading this pair today due to there being little space for price to move on the H4. Directly above 1.4200 lurks daily resistance at 1.4231 followed closely by mid-level resistance at 1.4250 and supply at 1.4305-1.4271. Below 1.4200 on the other hand there’s a clear barrier of support around the 1.4150 region (pink circle), before price is free to challenge daily support at 1.4079.

Levels to watch/live orders:
- Buys: Flat (Stop loss: N/A).
- Sells: Flat (Stop loss: N/A).
AUD/USD:
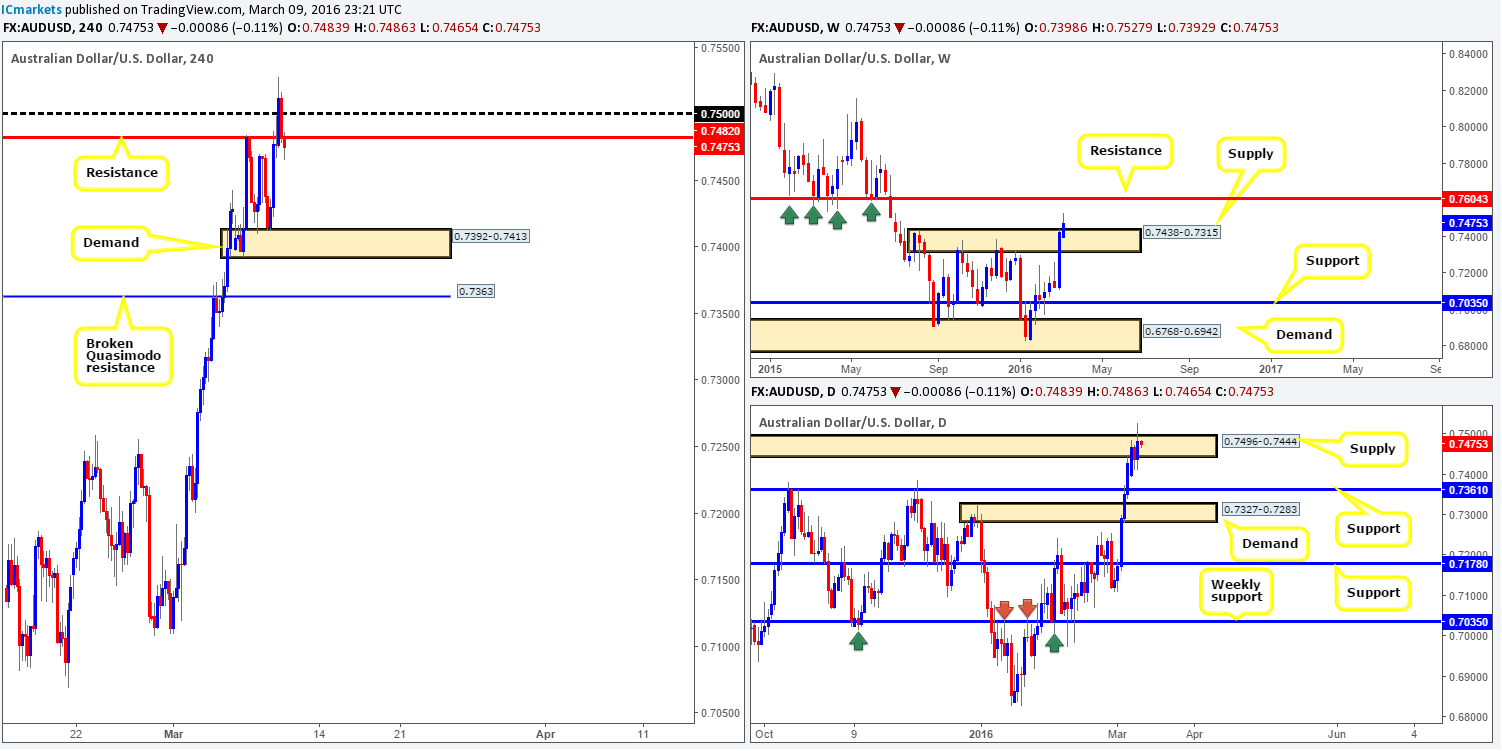
Based on recent H4 action, we can see that strong buyers stepped in from demand at 0.7392-0.7413 early on yesterday, consequently driving the commodity currency to fresh highs of 0.7527. However, before traders begin looking to ‘buy the dip’, one has to take into consideration that going into the U.S. session, price whipsawed through the 0.7500 figure and is, at the time of writing, trading beneath resistance at 0.7482. In addition to this, daily supply at 0.7496-0.7444, although it suffered a break yesterday, still remains intact suggesting a fakeout could be on the horizon to drive prices back down to H4 demand at 0.7392-0.7413 today. The only grumble here is that weekly action is now trading ABOVE weekly supply at 0.7438-0.7315. However, as we mentioned yesterday, we’d really like to see this weekly candle close up shop before making any further judgment on this timeframe.
With the above points noted, we are going to be watching for price to close below and retest the current H4 resistance. This, along with a lower timeframe sell signal, could be a nice opportunity to short down to the aforementioned H4 demand.
Levels to watch/live orders:
- Buys: Flat (Stop loss: N/A).
- Sells: 0.7482 [Tentative – confirmation required] (Stop loss: dependent on where one confirms this level).
USD/JPY:
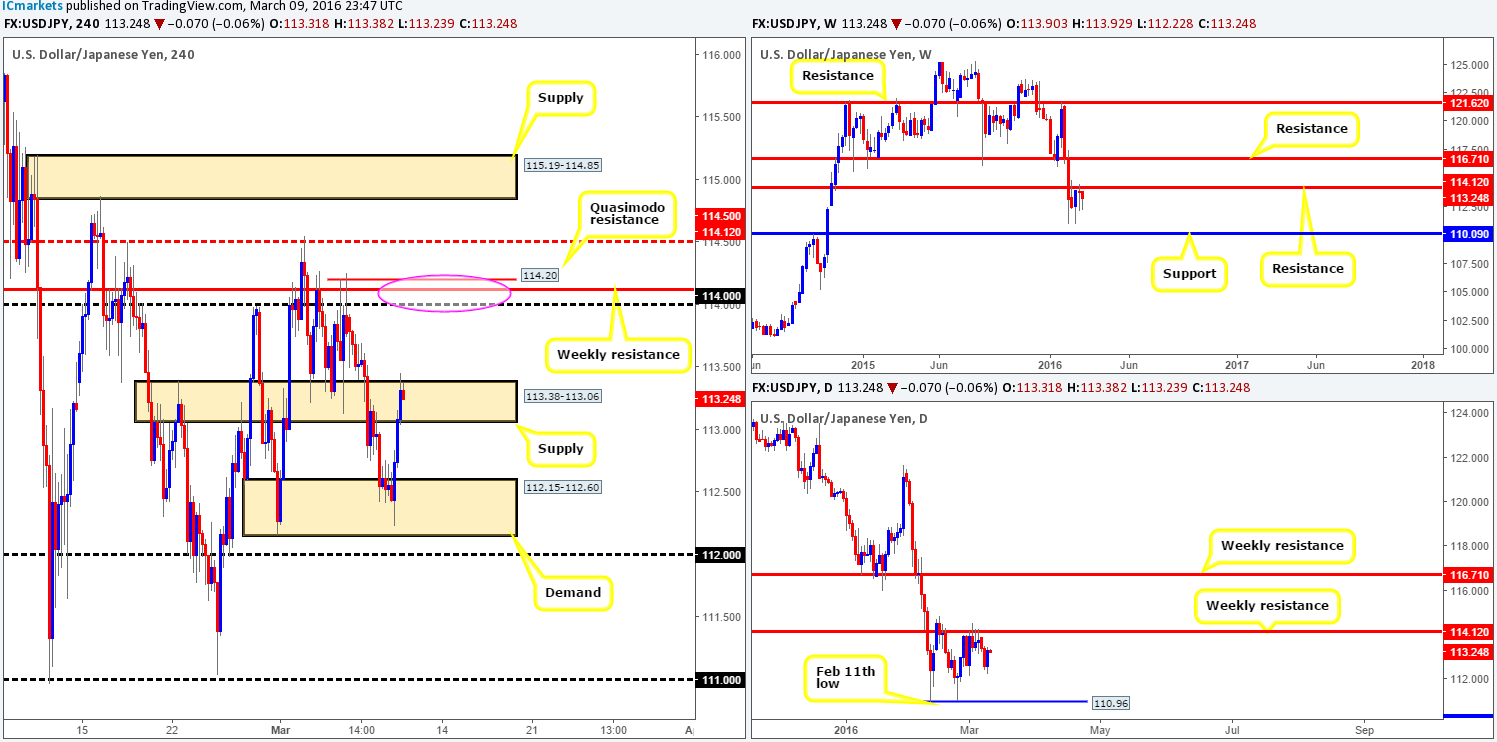
Going into the early hours of yesterday’s U.S. session, the USD/JPY, as you can see, was heavily bid from H4 demand chalked up at 112.15-112.60. As a result, H4 supply at 113.38-113.06 was attacked and eventually breached by the close 113.31. Some traders will be looking to short this break back down to the aforementioned H4 demand today, and that is fine as long as they are aware that price may continue driving north back up to the weekly resistance line at 114.12. This higher-timeframe level boasts not only a H4 Quasimodo resistance line at 114.20, but also a psychological resistance number drawn from 114.00 (pink circle).
Being conservative traders, we’re opting to wait and see if price can tag the above said weekly level before looking to sell this pair. Dependent on the time of day and how the action approaches the 114.00 region, a market entry is valid in our book due to the confluence seen here. Stops, at least for us, would be placed above 114.50 since this pair is notorious for faking levels before reversing!
Levels to watch/live orders:
- Buys: Flat (Stop loss: N/A).
- Sells: 114.00 region [Tentative – confirmation required] (Stop loss: dependent on where one confirms this area).
USD/CAD:
Following the BoC’s decision to leave interest rates unchanged, the Loonie snowballed south, engulfing several H4 support barriers during the onslaught. It was only once price connected with a H4 support area at 1.3224-1.3260 did we see the pair begin to stabilize.
Despite this recent decline in value, the weekly ascending channel support line extended from the low 1.0620 remains intact but is beginning to look fragile. Assuming this line caves in, the next limit to reach can be seen at 1.2833 – a support level. Daily action on the other hand printed a bearish engulfing candle yesterday that smothered the current demand area at 1.3293-1.3396 and potentially opened the path south towards demand at 1.3038-1.3165.
Given the above points, Entering long from the current H4 support area alongside sluggish higher-timeframe support (discussed above) is not something we’d feel comfortable taking part in. Selling this market, however, could be possible should a close below and retest of the H4 demand be seen. Be that as it may, even then one would need to be careful since you’d effectively be selling into the 1.3200 figure! That being the case, opting to stand on the sidelines here may very well be the best path to take today.

Levels to watch/live orders:
- Buys: Flat (Stop loss: N/A).
- Sells: Flat (Stop loss: N/A).
USD/CHF: (Similar to Wednesday’s report)
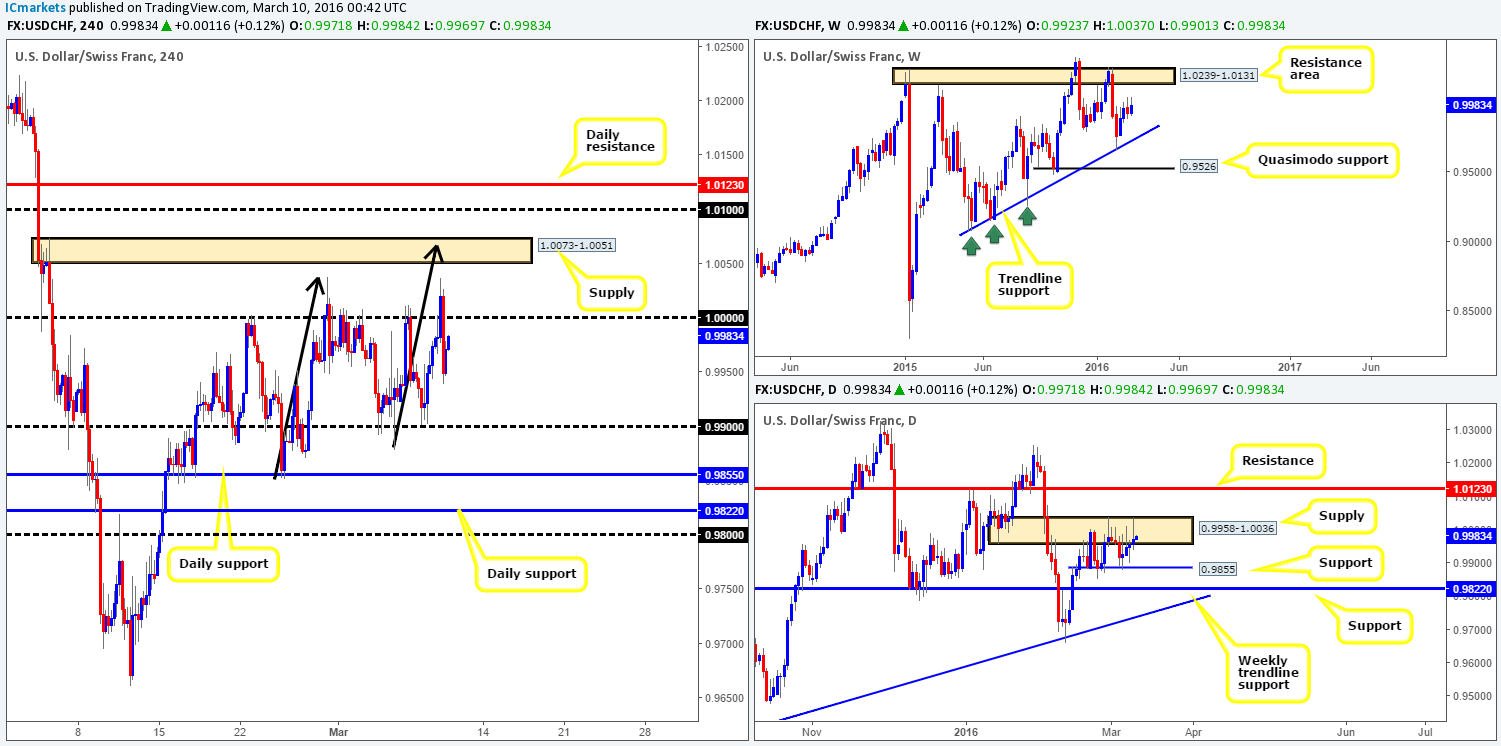
Although this pair saw considerable range yesterday, our outlook remains unchanged. On the daily chart, we can see that the buyers and sellers continue to battle for position between supply at 0.9958-1.0036 and support drawn from 0.9855. In the case that this supply area is engulfed, the river north should be ripple free up to resistance coming in at 1.0123 which lies just below a weekly resistance area seen at 1.0239-1.0131. Conversely, a push below the current support would almost immediately place this market within touching distance of support penciled in at 0.9822.
Climbing across to the H4 chart, it is clear to see that parity was aggressively whipsawed yesterday, consequently forcing price down to lows of 0.9934 by the day’s end. Parity and the 0.9900 figure have proved to be critical levels for this pair since the 29th Feb, so do keep an eye on lower timeframe price action around these numbers for potential trades today.
In addition to these barriers, we also have our eye on the following:
For shorts:
- There is a possibility that a 1:1 Harmonic move could take place up to just above H4 supply at 1.0073-1.0051 (see black arrows). Should one be looking to short this area, you may also want to take note of the 1.0100 handle above, followed closely by daily resistance at 1.0123 since a fakeout to these levels is very possible before sellers step in.
For longs:
- Daily supports 0.9855 and 0.9822 are levels we are expecting some sort of reaction to be seen. We would not be surprised to see price aggressively fake below 0.9855 to collect stops to trade from 0.9822, so do keep this scenario in mind.
Levels to watch/live orders:
- Buys: 09855 [Tentative – confirmation required] (Stop loss: dependent on where one confirms this level). 0.9822 [Tentative – confirmation required] (Stop loss: dependent on where one confirms this level). 0.9900 [Tentative – confirmation required] (Stop loss: dependent on where one confirms this level).
- Sells: 1.0073-1.0051 [Tentative – confirmation required] (Stop loss: dependent on where one confirms this area). 1.0100 [Tentative – confirmation required] (Stop loss: dependent on where one confirms this level). 1.0123 [Tentative – confirmation required] (Stop loss: dependent on where one confirms this level). 1.0000 [Tentative – confirmation required] (Stop loss: dependent on where one confirms this level).
DOW 30:
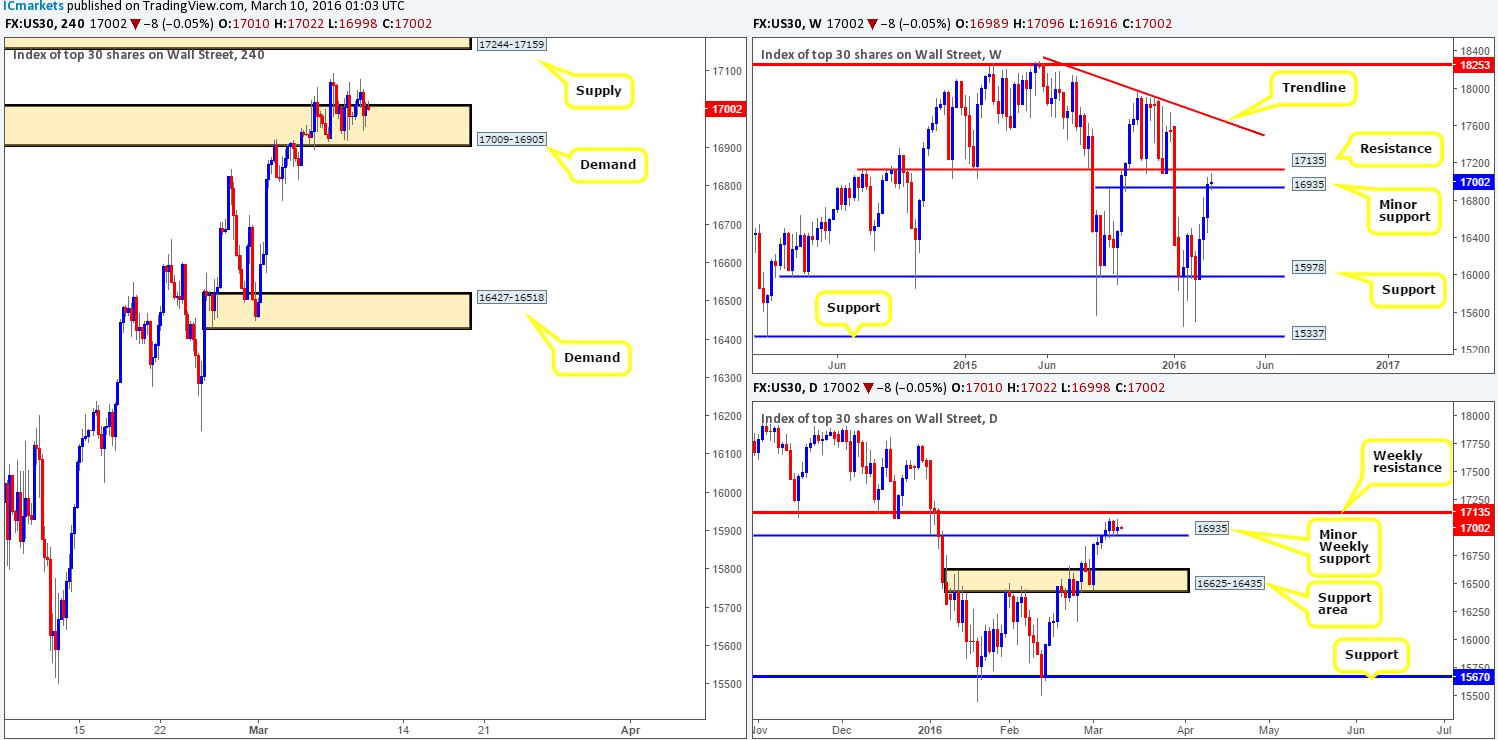
Due to price remaining in a consolidation, our outlook for this market remains unchanged
As can be seen from the H4 chart this morning, the DOW remains consolidating within demand at 17009-16905 ahead of today’s ECB meeting which should stir things up a little bit! In spite of this area being bolstered by a minor weekly support level at 16935, strong sellers are likely in wait just above. Not only is there a H4 supply at 17244-17159 to contend with, but there is also a long-term weekly resistance line seen at 17135 that stretches back to July 2014.
Considering there is likely to be some volatility come into this market today, coupled with the fact that price has come so very close to connecting with the weekly resistance level mentioned above at 17135, long trades are going to be difficult today. Ultimately, what we’d like to see is a sustained move below the current H4 demand base followed by a retest of this area as supply. Not only would this confirm bearish strength from the weekly resistance level but it could possibly force price to close below the minor weekly support at 16935 on the daily timeframe. This would, along with a lower timeframe sell setup, be a nice place to short targeting H4 demand at 16427-16518 (located within daily demand at 16625-16435).
Levels to watch/live orders:
- Buys: Flat (Stop loss: N/A).
- Sells: Watch for price to consume the 17009-16905 area and look to trade any retest seen thereafter (lower timeframe confirmation required).
XAU/USD: (Gold)
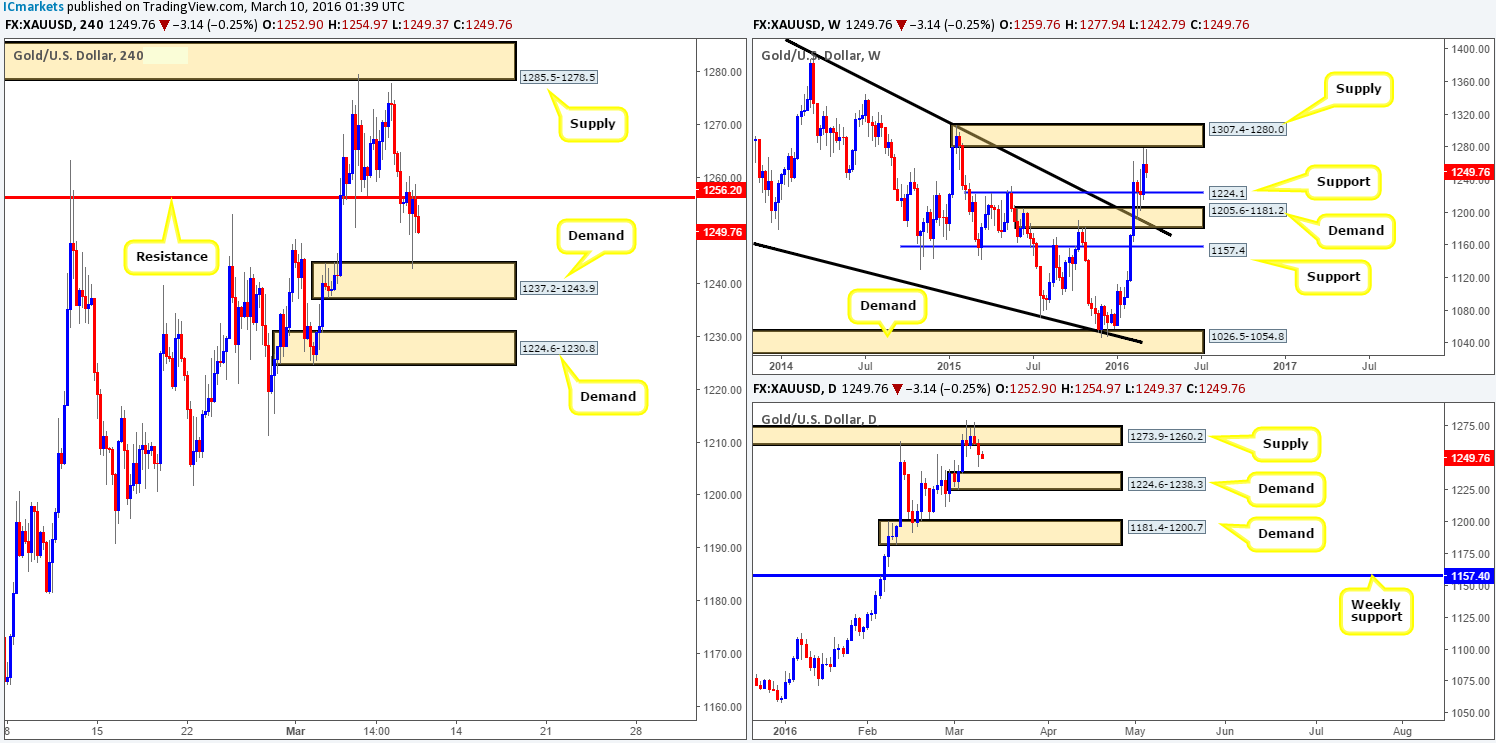
From the weekly chart, the yellow metal has clearly taken on a more bearish tone following the rebound from supply at 1307.4-1280.0, which has the potential to force prices down to support chalked up at 1224.1. In-line with weekly flow, daily action also shows room for this unit to continue driving lower today down to demand given at 1224.6-1238.3.
It came as no surprise to us that the H4 demand at 1237.2-1243.9 bounced yesterday since this area sits on top of the aforementioned daily demand zone. For all that though, we do not expect this barrier to hold out long-term as the more attractive zone is sitting below. H4 demand at 1224.6-1230.8 is not only housed within the extremes of the above said daily demand zone, but it is also bolstered by the weekly support level mentioned above at 1224.1. Due to this, we’re expecting this H4 demand area to hold firm and produce a healthy bounce. However, considering that the weekly level sits just beneath the H4 demand, there is a high probability that a fakeout will take place before buyers step in. That being the case, we would only enter within this zone alongside lower timeframe confirmation i.e. a break of supply or a collection of lower timeframe buying tails around a lower timeframe support etc…
Levels to watch/live orders:
- Buys: 1224.6-1230.8 [Tentative – confirmation required] (Stop loss: dependent on where one confirms this area).
- Sells: Flat (Stop loss: N/A


