Waiting for lower timeframe confirmation is our main tool to confirm strength within higher timeframe zones, and has really been the key to our trading success. It takes a little time to understand the subtle nuances, however, as each trade is never the same, but once you master the rhythm so to speak, you will be saved from countless unnecessary losing trades. The following is a list of what we look for:
- A break/retest of supply or demand dependent on which way you’re trading.
- A trendline break/retest.
- Buying/selling tails/wicks – essentially we look for a cluster of very obvious spikes off of lower timeframe support and resistance levels within the higher timeframe zone.
We typically search for lower-timeframe confirmation between the M15 and H1 timeframes, since most of our higher-timeframe areas begin with the H4. Stops are usually placed 1-3 pips beyond confirming structures.
EUR/USD:
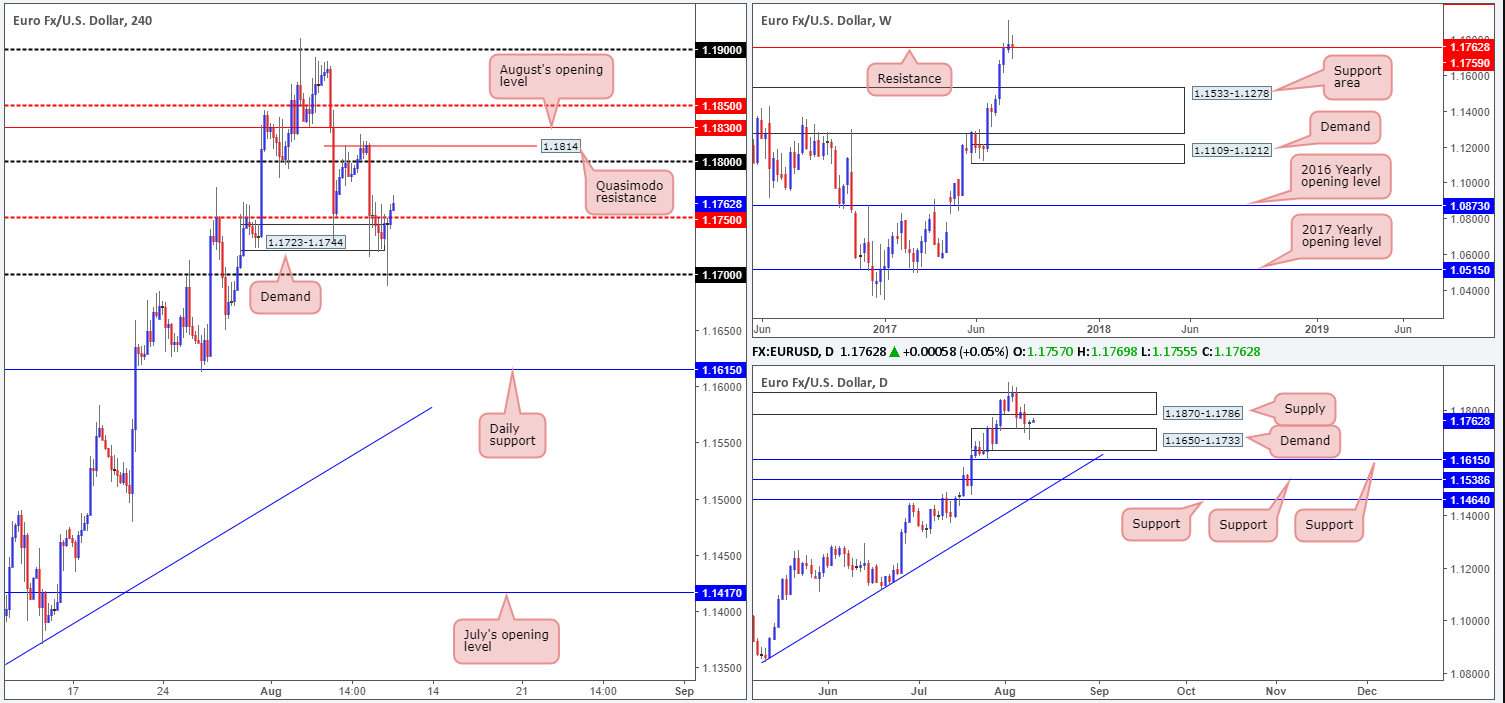
EUR/USD bulls seem to have a slight edge this morning. After rather aggressively whipsawing through the lower edge of H4 demand at 1.1723-1.1744 and testing the 1.17 handle, the H4 candles ended the day marginally closing above the mid-level resistance pegged at 1.1750.
With room seen for price to extend north up to 1.18 (followed closely by a H4 Quasimodo resistance at 1.1814), and daily action recently printing a mouthwatering buying tail from within demand at 1.1650-1.1733, further buying is likely to be seen. However, one thing to keep in mind here is weekly price. Last week’s trade chalked up a strong-looking selling wick just above a resistance located at 1.1759. Although we have seen little bearish intent from here, it is still worth keeping an eyeball on.
Our suggestions: A retest of 1.1750 as support today could bring about a buying opportunity. Should the retest be accompanied by a lower-timeframe buying signal (see the top of this report), an intraday long targeting the 1.18 neighborhood has potential. Be that as it may, do remain aware of the nearby daily supply at 1.1870-1.1786, specifically the lower edge positioned at 1.1786. This could halt buying and prevent H4 price from reaching 1.18.
Data points to consider: US PPI figures and weekly unemployment claims at 1.30pm, followed by FOMC member Dudley taking the stage at 3pm GMT+1.
Levels to watch/live orders:
- Buys: 1.1750 region ([waiting for a lower-timeframe confirming signal to form is advised before pulling the trigger] stop loss: dependent on where one confirms the area).
- Sells: Flat (stop loss: N/A).
GBP/USD:
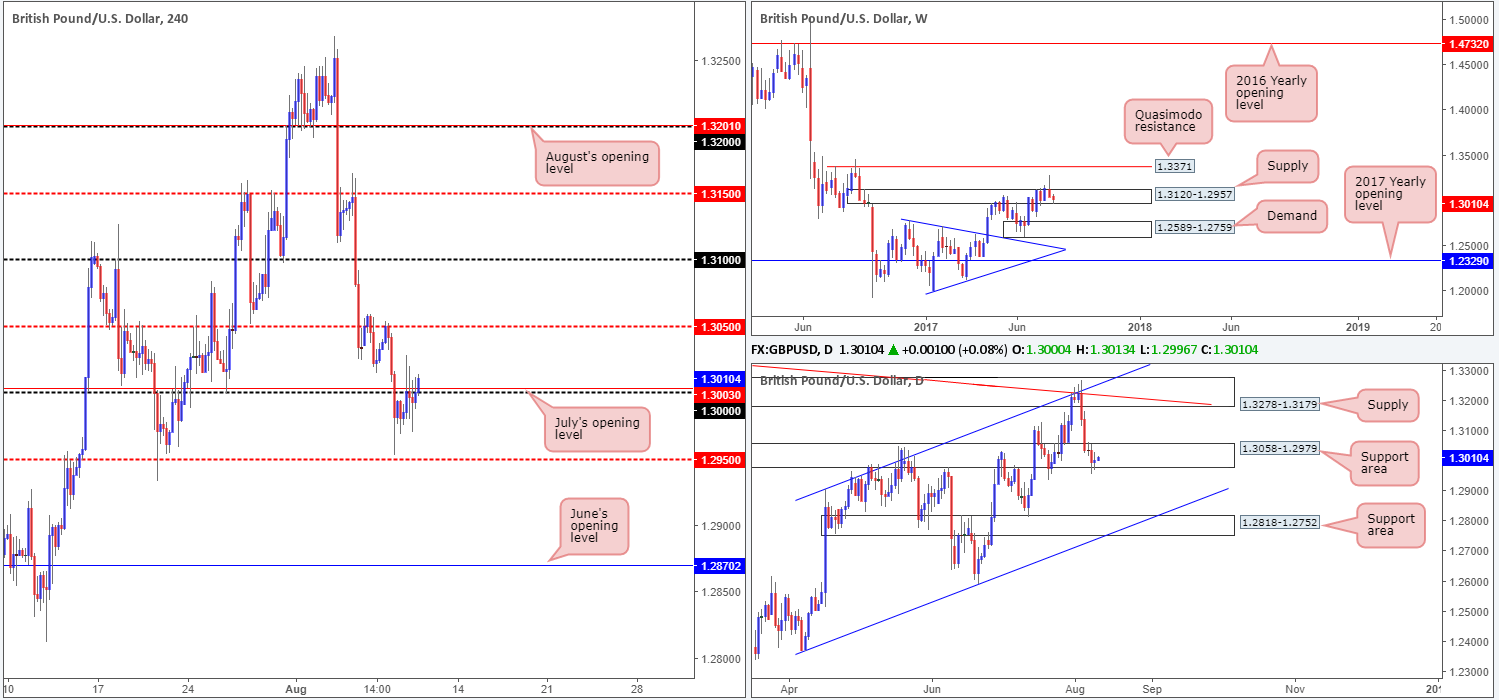
Following Tuesday’s low of 1.2952, the GBP/USD staged a moderate recovery and, as far as we can see, looks poised to now close above the large psychological boundary 1.30 and July’s opening level at 1.3003. The next upside target beyond 1.30 can be seen at the mid-level resistance drawn from 1.3050, which did a superb job in holding the unit lower on Tuesday.
Over on the bigger picture, weekly price is currently trading within the walls of a supply zone coming in at 1.3120-1.2957. On the other side of the field, however, daily flow remains loitering within a support area fixed at 1.3058-1.2979. With that being said, it may be worth noting that daily candlestick action has printed very little in terms of bullish intent. In fact, the latest movement chalked in an indecision candle.
Our suggestions: With conflicting signals being seen between the weekly and daily charts at the moment, this leaves traders in a somewhat precarious position: either buy into potential weekly selling or sell into possible daily buying. On account of this, a trade above the 1.30 handle is challenging and not really something we want to get involved in.
Data points to consider: UK Manufacturing production at 9.30am. US PPI figures and weekly unemployment claims at 1.30pm, followed by FOMC member Dudley taking the stage at 3pm GMT+1.
Levels to watch/live orders:
- Buys: Flat (stop loss: N/A).
- Sells: Flat (stop loss: N/A).
AUD/USD:
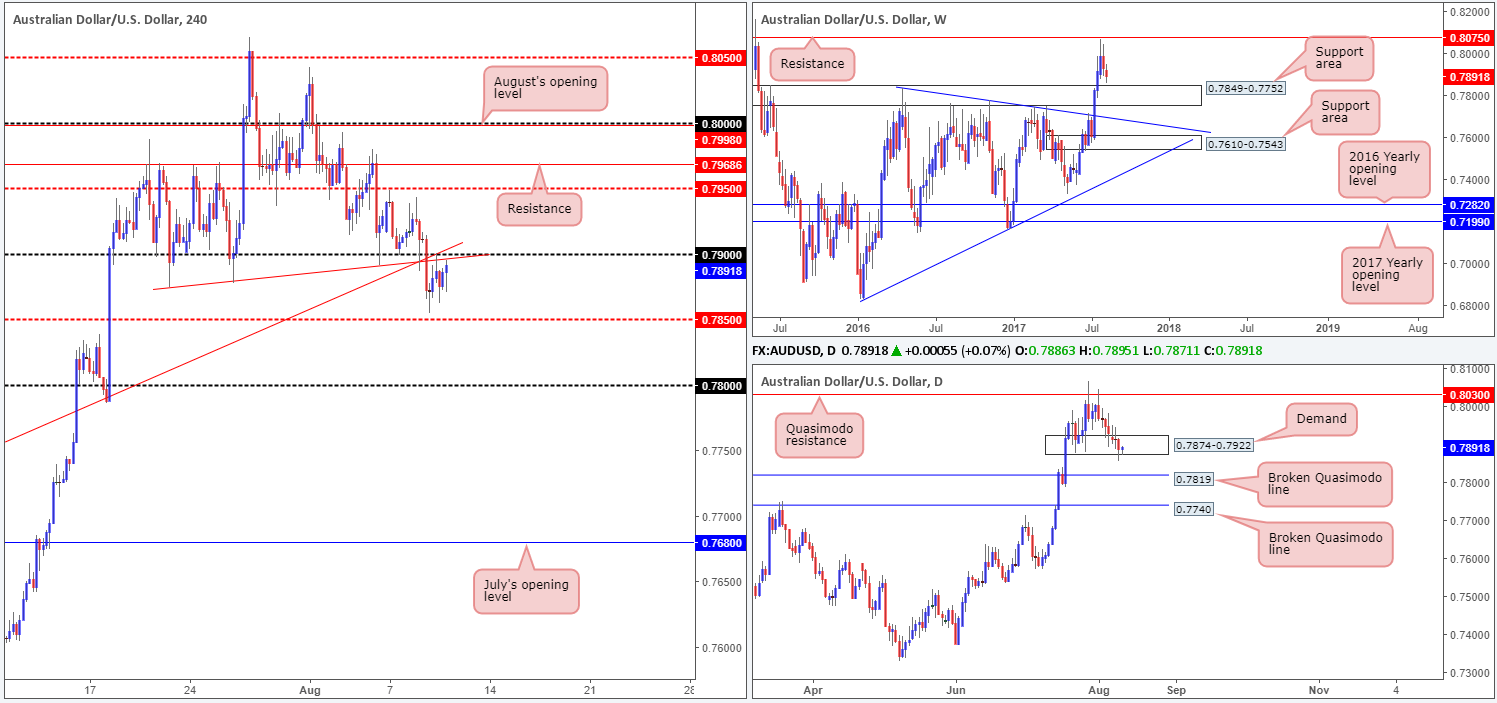
In recent trading, we saw the H4 candles dive below the 0.79 boundary and bottom just ahead of the mid-level support at 0.7850. Shortly after this, price retested the underside of 0.79 which fuses beautifully with two H4 trendline resistances (0.7874/0.7635). Should the bears continue to defend this line, 0.7850 is likely going to see some action sometime today.
In support of further selling, the daily timeframe shows price recently pierced beneath the lower edge of demand at 0.7874-0.7922, likely triggering a truckload of sell stops and clearing the path south down to a broken Quasimodo line at 0.7819. In addition to this, on the weekly timeframe price shows space for the market to trade down to a support area coming in at 0.7849-0.7752.
Our suggestions: On account of the above notes, we are watching for H4 price to print a reasonably sized bearish candle from 0.79 in the shape of a full, or near-full-bodied candle. The first take-profit zone would, for us, be the H4 mid-level support at 0.7850 (largely because this denotes the top edge of the noted weekly support area), followed closely by a daily broken Quasimodo line mentioned above at 0.7819.
Data points to consider: US PPI figures and weekly unemployment claims at 1.30pm, followed by FOMC member Dudley taking the stage at 3pm GMT+1.
Levels to watch/live orders:
- Buys: Flat (stop loss: N/A).
- Sells: 0.79 region ([waiting for a H4 bearish candle, preferably a full, or near-full-bodied candle, to form is advised] stop loss: ideally beyond the candle’s wick).
USD/JPY:
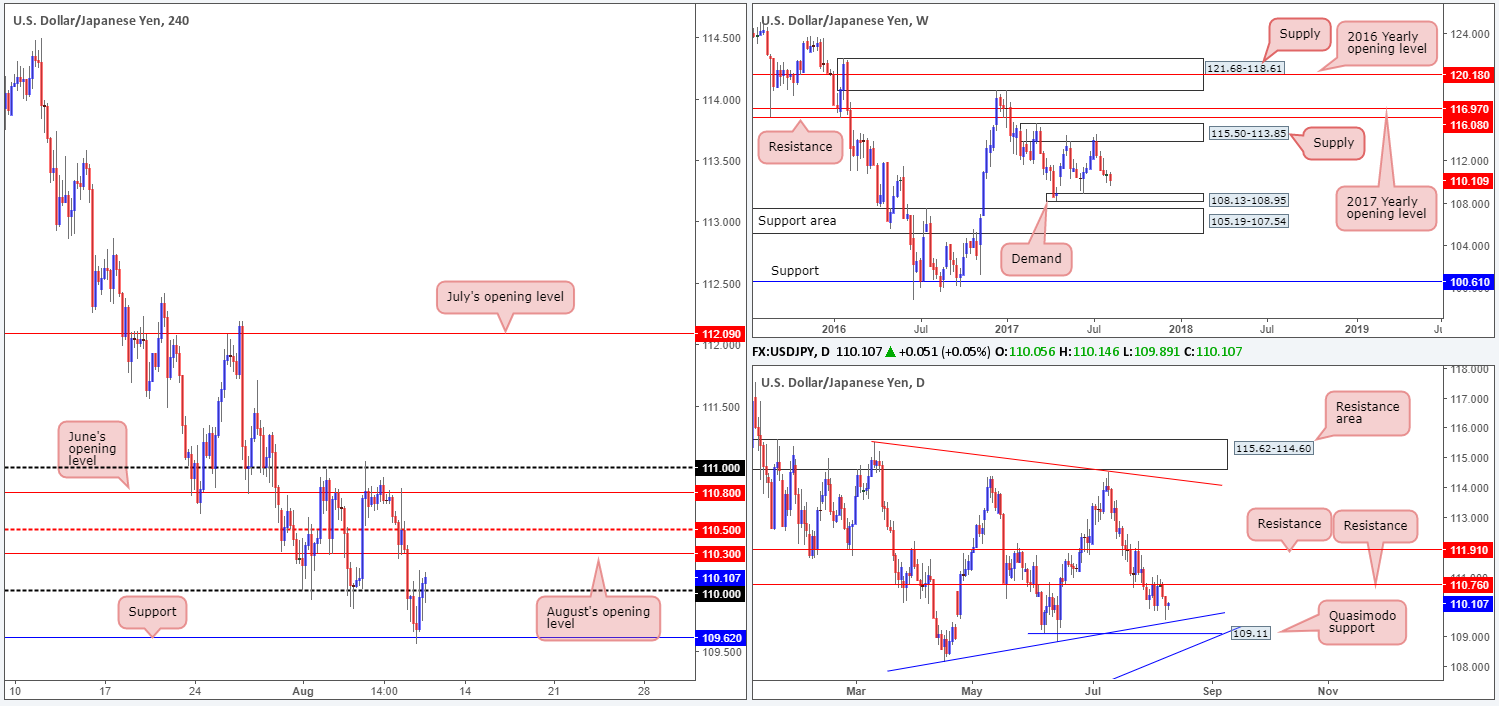
After dropping sharply over the past couple of days, the pair managed to find a floor of bids around a H4 support level at 109.62 on Wednesday. The response to this level helped break and eventually close above the 110 handle, leaving the path north free up to August’s opening line at 110.30, followed closely by the H4 mid-level resistance at 110.50 and then the H4 channel resistance extended from the high 111.71.
While near-term action shows the possibility of further buying, weekly price continues to head south in the direction of a small demand pegged at 108.13-108.95. The daily candles on the other hand, recently came within touching distance of a trendline support taken from the low 108.13 after selling off from resistance marked at 110.76.
Our suggestions: Seeing as H4 structure is rather cluttered above 110 at the moment, along with both weekly and daily price still showing room for further downside, we will not be considering any trades in this market today.
Data points to consider: US PPI figures and weekly unemployment claims at 1.30pm, followed by FOMC member Dudley taking the stage at 3pm GMT+1.

Levels to watch/live orders:
- Buys: Flat (stop loss: N/A).
- Sells: Flat (stop loss: N/A).
USD/CAD:
The US dollar, as you can see, pushed higher against its Canadian counterpart on Wednesday, bringing price up to within a few pips of the underside of a H4 supply seen at 1.2747-1.2722. According to weekly price, further upside should not really come as much of a surprise as the pair recently rebounded from a support area coming in at 1.2433-1.2569. Conversely, however, the daily timeframe shows that although further buying was seen, price remains within the confines of a resistance area carved from 1.2654-1.2734.
As we highlighted in previous reports, our desk would not consider becoming buyers in this market until a close above the current daily resistance area is seen. Despite what the weekly timeframe suggests, buying into the current daily structure is a risk we’re just not willing to take here. In Wednesday’s report, we also showed interest in selling should price tag the H4 supply and close back below 1.27, which recently came to fruition.
Our suggestions: The move below 1.27 from the H4 supply, for us, confirms lower prices down to at least the 1.26 neighborhood. As such, we have sold at 1.2696 and positioned our stop at 1.2723 (27 pips) and are looking to take partial profits around the 1.2650 region (46 pips). We understand that we have effectively sold into potential weekly buying here, but the evidence of a move lower is strong given the current trend and daily resistance area.
Data points to consider: US PPI figures and weekly unemployment claims at 1.30pm, followed by FOMC member Dudley taking the stage at 3pm GMT+1.

Levels to watch/live orders:
- Buys: Flat (stop loss: N/A).
- Sells: 1.2696 ([live] stop loss: 1.2723).
USD/CHF:
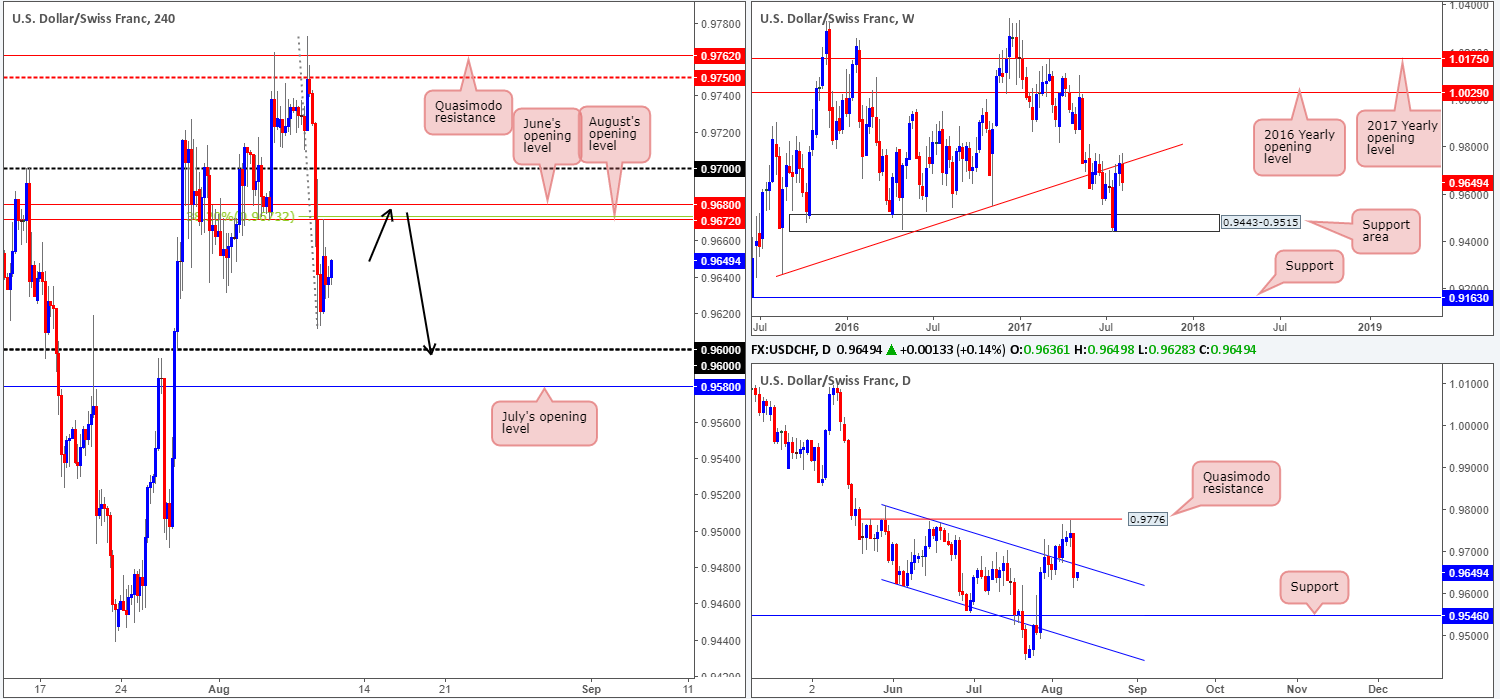
In recent sessions the USD/CHF plunged lower, following Tuesday’s reaction to the H4 Quasimodo resistance at 0.9762 and the H4 mid-level resistance at 0.9750. Both June and August’s opening levels at 0.9680/0.9672 were easily cleared with price ultimately going on to bottom just ahead of the 0.96 handle. Shortly after this, price retested 0.9672 beautifully as resistance and held lower into the close.
Technically speaking, the move lower should have not really come as much of a surprise, as weekly price is seen trading from a major trendline resistance extended from the low 0.9257. Also noteworthy is daily price is now seen trading back into the walls of a daily descending channel (0.9808/0.9622).
Our suggestions: Basically, our team is watching 0.9680/0.9672 on the H4 chart for a potential shorting opportunity today, targeting the 0.96 line as an initial take-profit level. Not only has 0.9672 already proved its ability to hold price lower, the small area also houses a H4 38.2% Fib resistance at 0.9673 taken from the high 0.9772. However, due to the threat of a potential fakeout up to 0.97, we would strongly advise against placing pending orders here. Instead, wait for the candles to confirm bearish intent. What we personally look for is a candle response in the shape of a full, or near-full-bodied candle to confirm seller interest.
Data points to consider: US PPI figures and weekly unemployment claims at 1.30pm, followed by FOMC member Dudley taking the stage at 3pm GMT+1.
Levels to watch/live orders:
- Buys: Flat (stop loss: N/A).
- Sells: 0.9680/0.9672 ([waiting for a H4 bearish candle to form, preferably either a full, or near-full-bodied candle, is advised] stop loss: ideally beyond the candle’s wick).
DOW 30:
It was a quiet day in the US equity market yesterday, with price ranging no more than 85 points. Given the rather lackluster performance, much of the following report will echo thoughts put forward in Wednesday’s analysis.
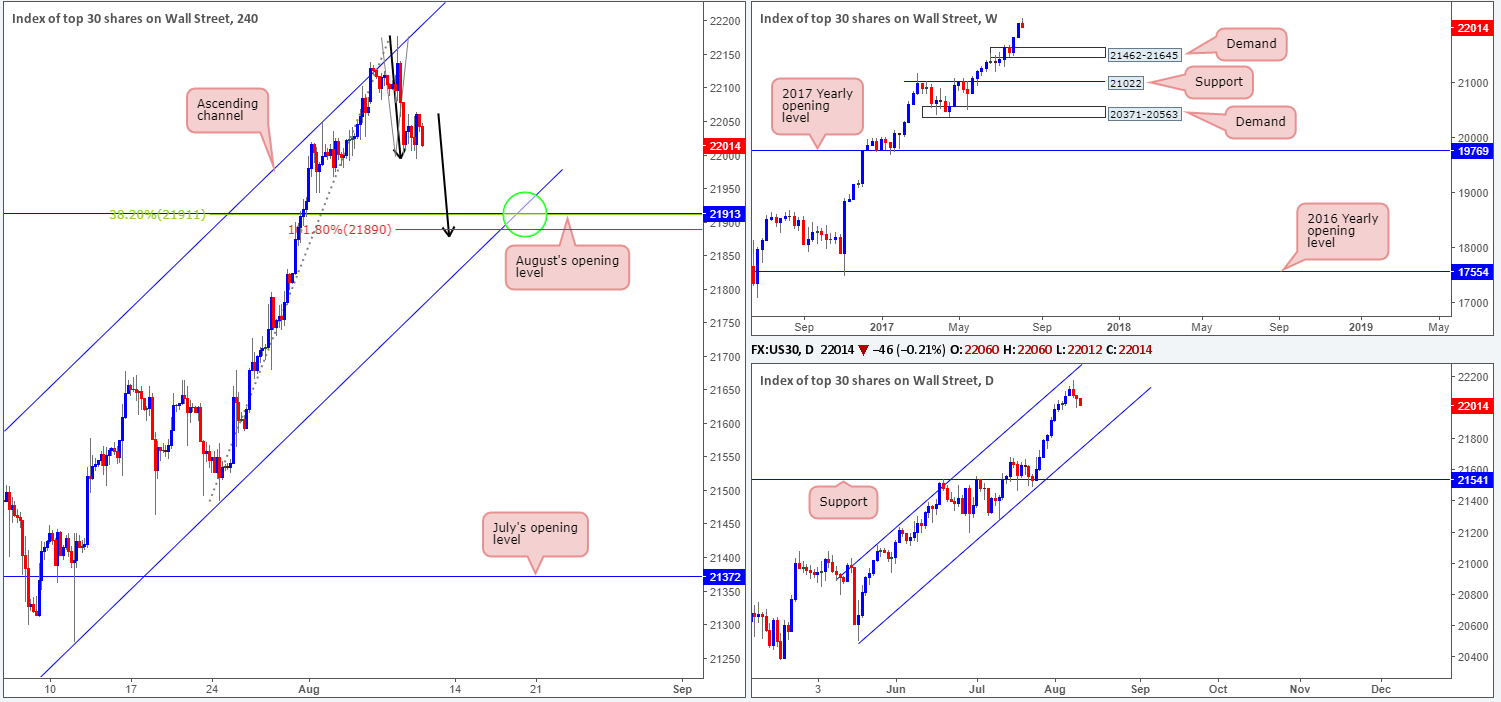
On Tuesday, H4 action once again challenged the ascending channel resistance drawn from a high of 21556. Currently, we do not see much in the way of support until August’s opening level at 21913, so further selling could be on the cards today. As 21913 fuses almost perfectly with a H4 38.2% Fib support at 21911 (taken from the low 21484), we feel a bounce from this neighborhood could be on the cards.
Our suggestions: With this market currently entrenched within an incredibly strong uptrend which shows little sign of decelerating, a buy from the 21913 vicinity is of interest to our desk.
Just to be clear though, we would only consider a buy if one of the following takes shape:
- H4 price tests 21913 once the market is in line with the neighboring channel support extended from the low 21273 (green circle).
- The unit chalks up a H4 AB=CD approach as per the black arrows (161.8 Fib ext. point at 21890).
To avoid any fakeout through 21913, nonetheless, we would also strongly recommend waiting for H4 price to chalk up a bullish candle in the shape of a full, or near-full-bodied candle. This, of course, will not guarantee a winning trade, but what it will do is show buyer intent from a high-probability reversal zone.
Data points to consider: US PPI figures and weekly unemployment claims at 1.30pm, followed by FOMC member Dudley taking the stage at 3pm GMT+1.
Levels to watch/live orders:
- Buys: 21913 region ([waiting for a H4 bullish candle to form, preferably either a full, or near-full-bodied candle, is advised] stop loss: ideally beyond the candle’s tail).
- Sells: Flat (stop loss: N/A).
GOLD:
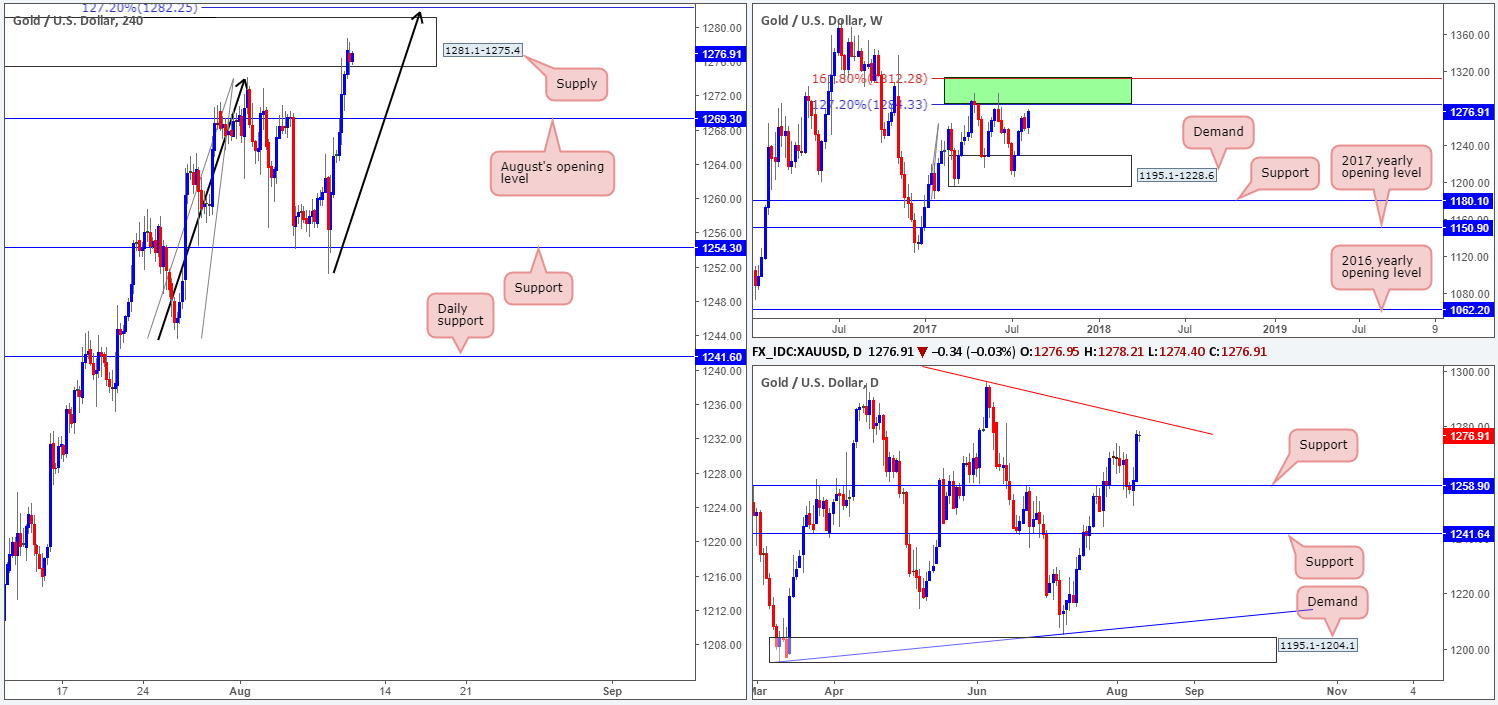
The yellow metal sported another wave of buying during Wednesday’s segment, running through August’s opening level at 1269.3 and testing H4 supply at 1281.1-1275.4. Although the market has stalled within this boundary, we feel further buying may be upon us!
Over on the weekly chart, we can see that the market shows room for the metal to extend up to the green resistance zone comprised of two Fibonacci extensions 161.8/127.2% at 1312.2/1284.3 taken from the low 1188.1. What’s also interesting is that daily action also shows space for the unit to extend up to a trendline resistance taken from the high 1337.3. Not only do we have the higher timeframes suggesting a punch higher is likely on the cards, but H4 price also shows that a drive above the H4 supply could happen, as price attempts to complete the current AB=CD move (black arrows –127.2% ext. at 1282.2).
Our suggestions: In view of the above, we have absolutely zero interest in selling the piece right now. A buy on the other hand, would become interesting if the unit retested August’s opening level mentioned above at 1269.3. Apart from this, we see little else to hang our hat on until we reach the aforementioned daily trendline resistance and weekly resistance zone.
Levels to watch/live orders:
- Buys: 1269.3 region is interesting for a buy ([waiting for a H4 bullish candle to form, preferably either a full, or near-full-bodied candle, is advised] stop loss: ideally beyond the candle’s tail).
- Sells: Flat (stop loss: N/A).


