
Waiting for lower timeframe confirmation is our main tool to confirm strength within higher timeframe zones, and has really been the key to our trading success. It takes a little time to understand the subtle nuances, however, as each trade is never the same, but once you master the rhythm so to speak, you will be saved from countless unnecessary losing trades. The following is a list of what we look for:
- A break/retest of supply or demand dependent on which way you’re trading.
- A trendline break/retest.
- Buying/selling tails/wicks – essentially we look for a cluster of very obvious spikes off of lower timeframe support and resistance levels within the higher timeframe zone.
We typically search for lower-timeframe confirmation between the M15 and H1 timeframes, since most of our higher-timeframe areas begin with the H4. Stops are usually placed 1-3 pips beyond confirming structures.
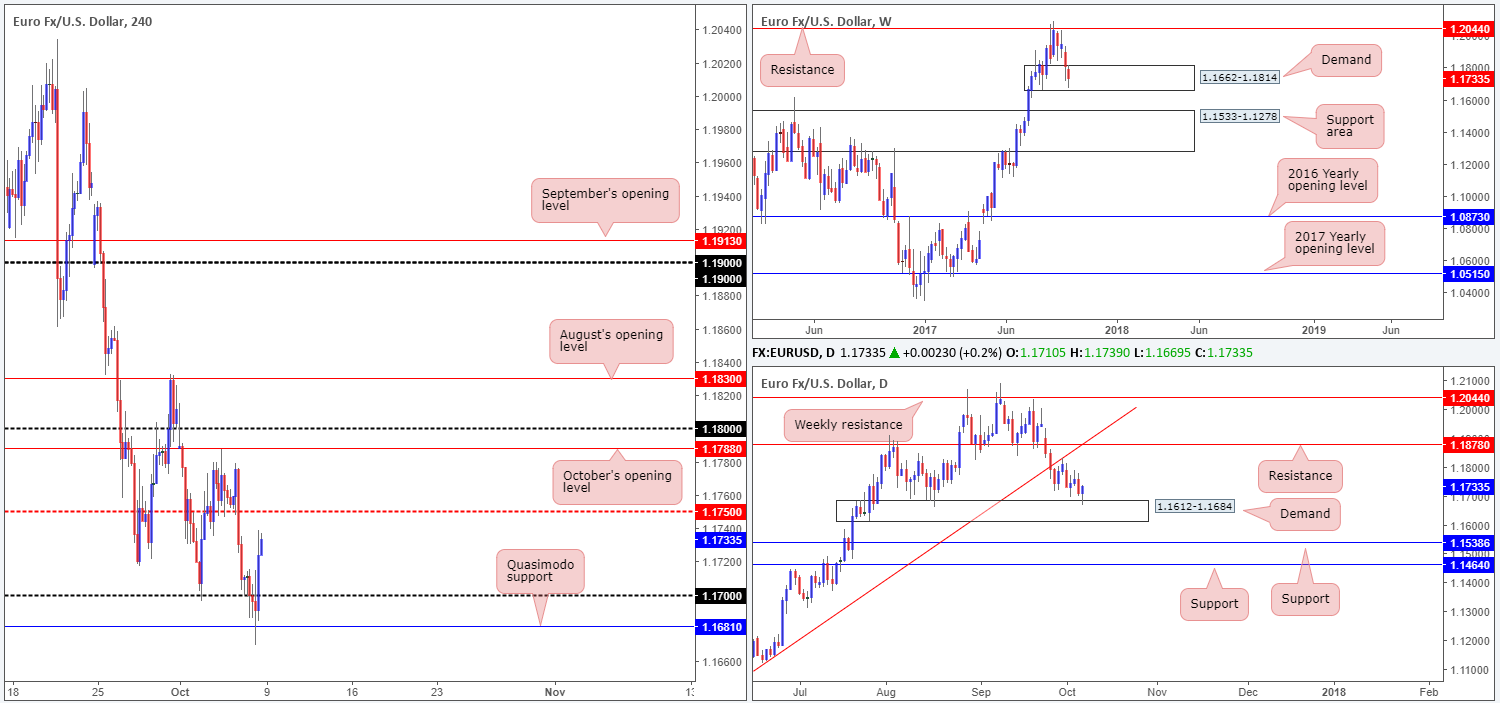
EUR/USD:
Weekly gain/loss: – 78 pips
Weekly closing price: 1.1733
Over the last week, the single currency sustained further losses against its US counterpart, consequently pulling the unit deeper into nearby demand at 1.1662-1.1814. In the event that this zone eventually gives way, the large support area seen directly below it at 1.1533-1.1278 will likely be challenged.
From the daily timeframe, nevertheless, we witnessed price action test the top edge of demand positioned at 1.1612-1.1684 and form a strong-looking buying tail. Assuming that the bulls remain in the driving seat here, the next upside target can be seen at resistance drawn from 1.1878.
As can be seen from the H4 timeframe, the euro moved lower in the immediate aftermath of Friday’s job’s report (average hourly earnings increased by 0.5% and unemployment fell to 4.2%). Despite briefly slipping below the Quasimodo support at 1.1681, the pair managed to recover relatively quickly and end the day marginally in the green.
For those who read Friday’s report, we highlighted a possible buy from the above noted Quasimodo support with stops planted below the current weekly demand base. Well done to any of our readers who managed to jump aboard this move. Unfortunately, we passed given the level hit during news.
Suggestions: On the grounds that the unit remains trading within a weekly demand, and also recently shook hands with a daily demand, further buying is still likely we believe.
Near-term resistance stands at 1.1750. Once/if price crosses above this hurdle, October’s opening level at 1.1788/1.18 handle, followed closely by August’s opening level at 1.1830 will be next in line.
Data points to consider: No high-impacting news events on the docket – US banks closed in observance of Columbus Day.
Levels to watch/live orders:
- Buys: Watch for H4 price to engulf 1.1750 and then look to trade any retest seen thereafter ([waiting for a lower-timeframe confirming signal to form following the retest is advised – see the top of this report] stop loss: dependent on where one confirms this level).
- Sells: Flat (stop loss: N/A).
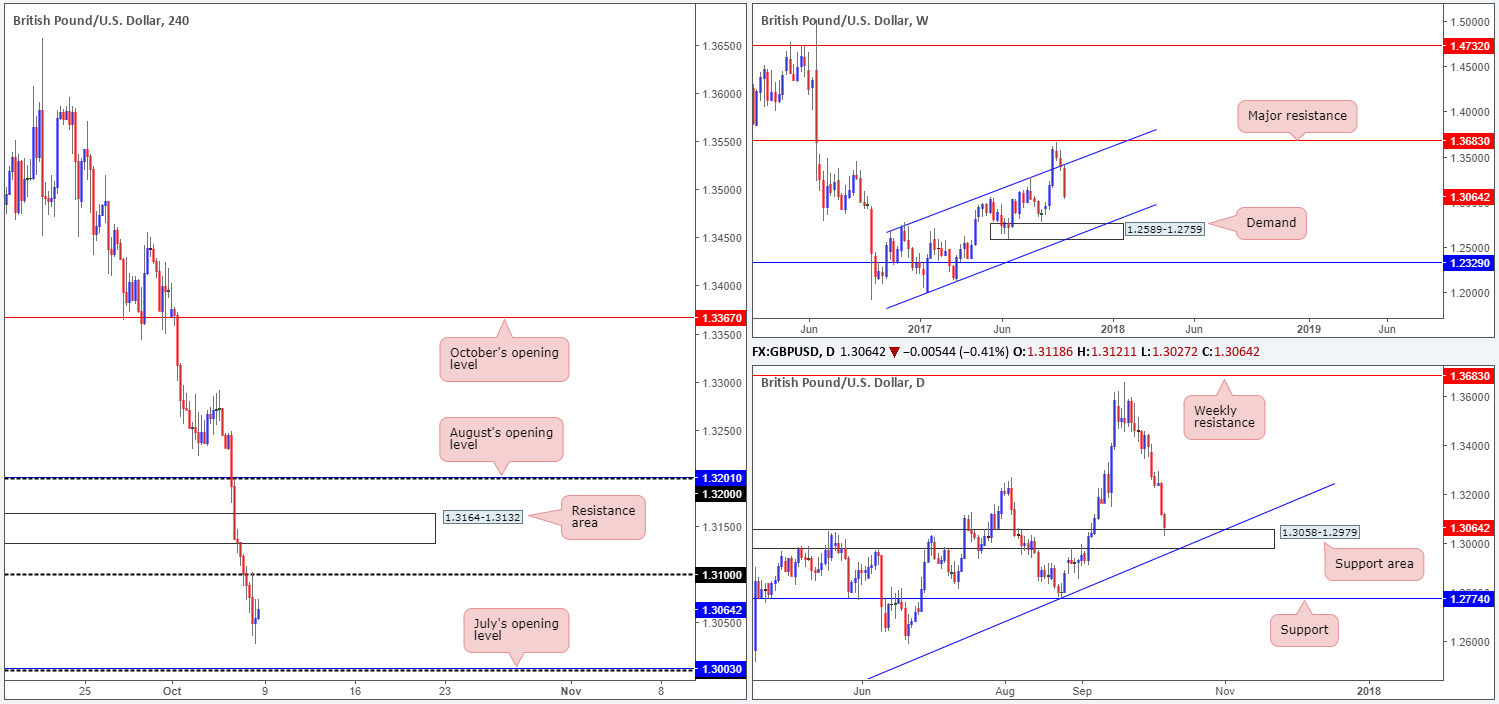
GBP/USD:
Weekly gain/loss: – 331 pips
Weekly closing price: 1.3064
Last week’s sharp run to the downside pushed the British pound into further losses, stripping a whopping 300 pips off its value!
Weekly price, as you can see, recently re-entered the ascending channel formation (1.1986/1.2673), potentially opening up downside to as low as the demand area positioned at 1.2589-1.2759, which happens to merge with the noted channel support.
Meanwhile, daily activity recently crossed swords with a nice-looking support area marked at 1.3058-1.2979 that merges closely with a trendline support etched from the low 1.2108. A violation of this area, as the weekly timeframe suggests, would likely send the pair down to support coming in at 1.2774 – essentially the top edge of the noted weekly demand base.
Friday’s job’s report failed to harvest much of a reaction from the GBP/USD. Both average hourly earnings and the unemployment rate came in hotter than expected, with a negative headline seen in payrolls. As of the week’s close, the pair is seen lurking mid-range between the 1.31 handle and the key 1.30 support/July’s opening level at 1.3003.
Suggestions: A long from 1.30 is interesting. Not only does it have July’s opening level backing it up, it is also positioned within the walls of the aforementioned daily support area and nearby trendline support. The only grumble, of course, is that weekly price portends further selling. Therefore, for anyone considering a buy at 1.30 today/this week, we would strongly advise waiting for a reasonably sized H4 bull candle (preferably in the shape of a full or near-full-bodied candle) to take form, before pulling the trigger. This will not guarantee a winning trade, but what it will do is show buyer intent at a high-probability buy zone.
Data points to consider: No high-impacting news events on the docket – US banks closed in observance of Columbus Day.
Levels to watch/live orders:
- Buys: 1.30 region ([waiting for a reasonably sized H4 bullish candle to form – preferably a full, or near-full-bodied candle – is advised] stop loss: ideally beyond the candle’s tail).
- Sells: Flat (stop loss: N/A).
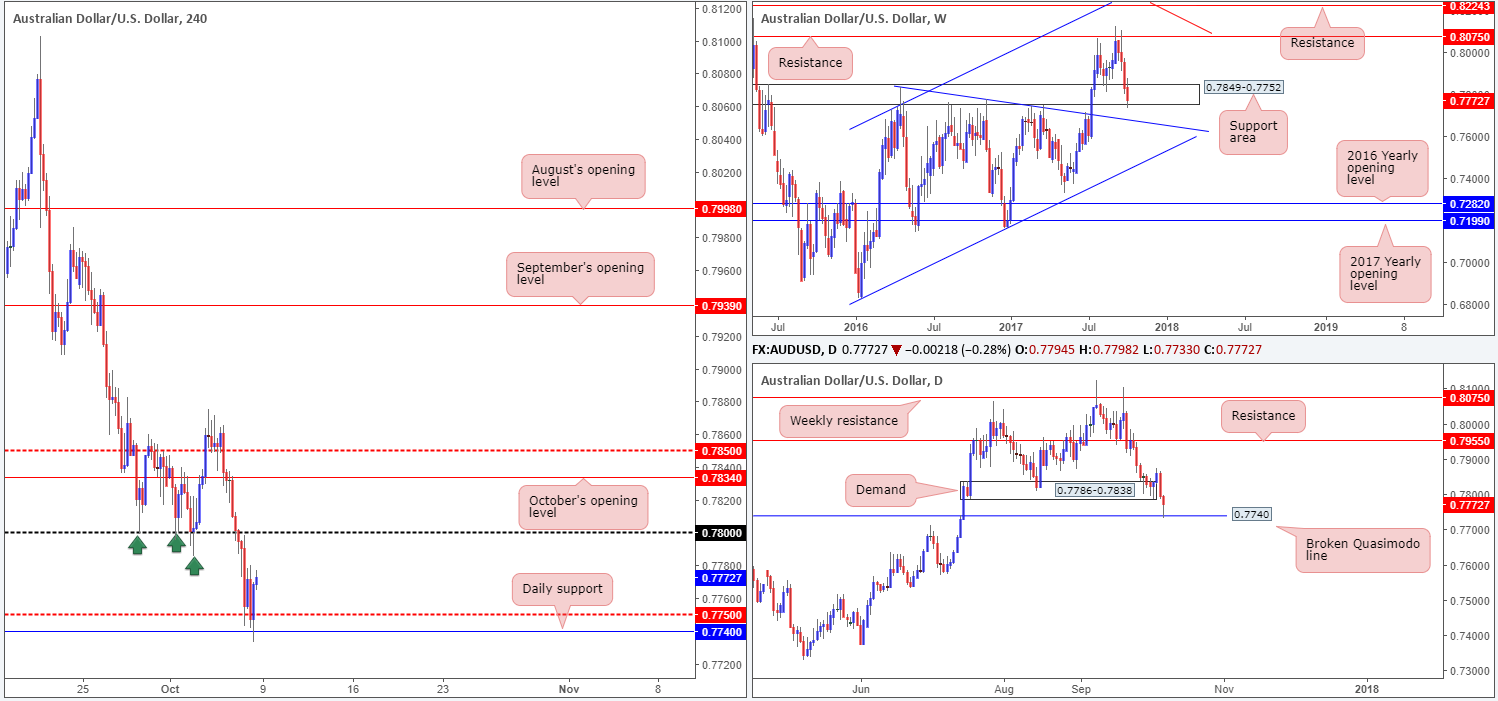
AUD/USD:
Weekly gain/loss: – 56 pips
Weekly closing price: 0.7772
Over the last month, the commodity currency suffered a string of losses after connecting with weekly resistance pegged at 0.8075. The current weekly support area at 0.7849-0.7752, as you can see, has been unable to register anything of note and may indicate that a push down to the nearby weekly trendline support (extended from the high 0.7835) might be on the cards. Daily demand at 0.7786-0.7838 failed to hold ground on Friday, allowing the unit to shake hands with a broken daily Quasimodo line seen at 0.7740 which held firm into the week’s end.
The impact of Friday’s job’s report saw the AUD/USD immediately selloff and test the H4 mid-level support at 0.7750. After a brief spell below this number to connect with the noted daily broken Quasimodo level, the bulls regained composure and ended the day forming a reasonably strong-looking H4 bullish candle.
Suggestions: In view of the current structure this market is offering (see above in bold), a move up to the 0.78 handle is highly likely to be seen today. With this psychological band having been a strong support (see green arrows), however, you may find active offers in waiting here. Therefore, it would be impractical to attempt a buy in this market at current price, unless, of course, you’re able to drill down to the lower timeframes and pin down a setup that requires a small enough stop to accommodate reasonable risk/reward up to 0.78.
Data points to consider: No high-impacting news events on the docket – US banks closed in observance of Columbus Day.
Levels to watch/live orders:
- Buys: Flat (stop loss: N/A).
- Sells: Flat (stop loss: N/A).
USD/JPY:
Weekly gain/loss: + 14 pips
Weekly closing price: 112.60
Despite the USD/JPY registering its fourth consecutive bullish close last week, the weekly candles appear somewhat exhausted ahead of supply coming in at 115.50-113.85. Although we believe dollar bulls will still likely challenge the noted supply, the back-to-back weekly selling wicks may encourage sellers into the market this week.
In conjunction with weekly flow, the picture on the daily timeframe also reveals space for the bulls to push north this week up to the trendline resistance extended from the high 115.50 (merges nicely with the noted weekly supply). With that being said though, Friday’s bearish selling wick looks somewhat threatening and therefore could force price back down to retest support at 111.91.
The dollar, as you can see on H4 timeframe, moved higher in the immediate aftermath of Friday’s job’s report, breaking out of its current range at 113.21/112.32 and testing nearby supply at 113.57-113.38, which held firm. The push lower from the area was aggressive, almost immediately reclaiming NFP-induced gains and closing the day marginally below October’s opening level at 112.64.
Suggestions: In light of this recent downside push, the 112 handle is back in the spotlight. For those of you who follow our reports on a regular basis you may recall we have been banging the drum about 112 for a while now. Here’s why:
- Positioned directly above daily support at 111.91.
- Located just below July’s opening level at 112.09.
- Sited nearby a Fibonacci cluster comprised of a 38.2% support at 111.96 taken from the low 109.54, a 61.8% support at 112 from the low 111.09 and a 78.6% support at 111.90 drawn from the low 111.47.
- The stop-loss orders planted below the range edge at 112.32. When these stops are triggered they, along with breakout sellers’ orders, become sell orders and thus help provide traders with deep pockets the liquidity required to buy.
Suggestions: With space seen for both weekly and daily action to push higher, coupled with the 112 handle’s surrounding confluence mentioned above, a long from the green H4 buy zone is worthy of attention. As psychological levels are prone to fakeouts, however, you may want to wait for H4 price to confirm buyer intent before pulling the trigger. For us, this would simply be a full or near-full-bodied bullish candle seen within the green zone, which would, in our view, provide enough evidence to hold the position up to at least October’s opening level at 112.64/113 handle.
Data points to consider: No high-impacting news events on the docket – both US and Japanese banks closed today.

Levels to watch/live orders:
- Buys: 111.91/112.09 ([waiting for a reasonably sized H4 bullish candle to form – preferably a full, or near-full-bodied candle – is advised] stop loss: ideally beyond the candle’s tail).
- Sells: Flat (stop loss: N/A).
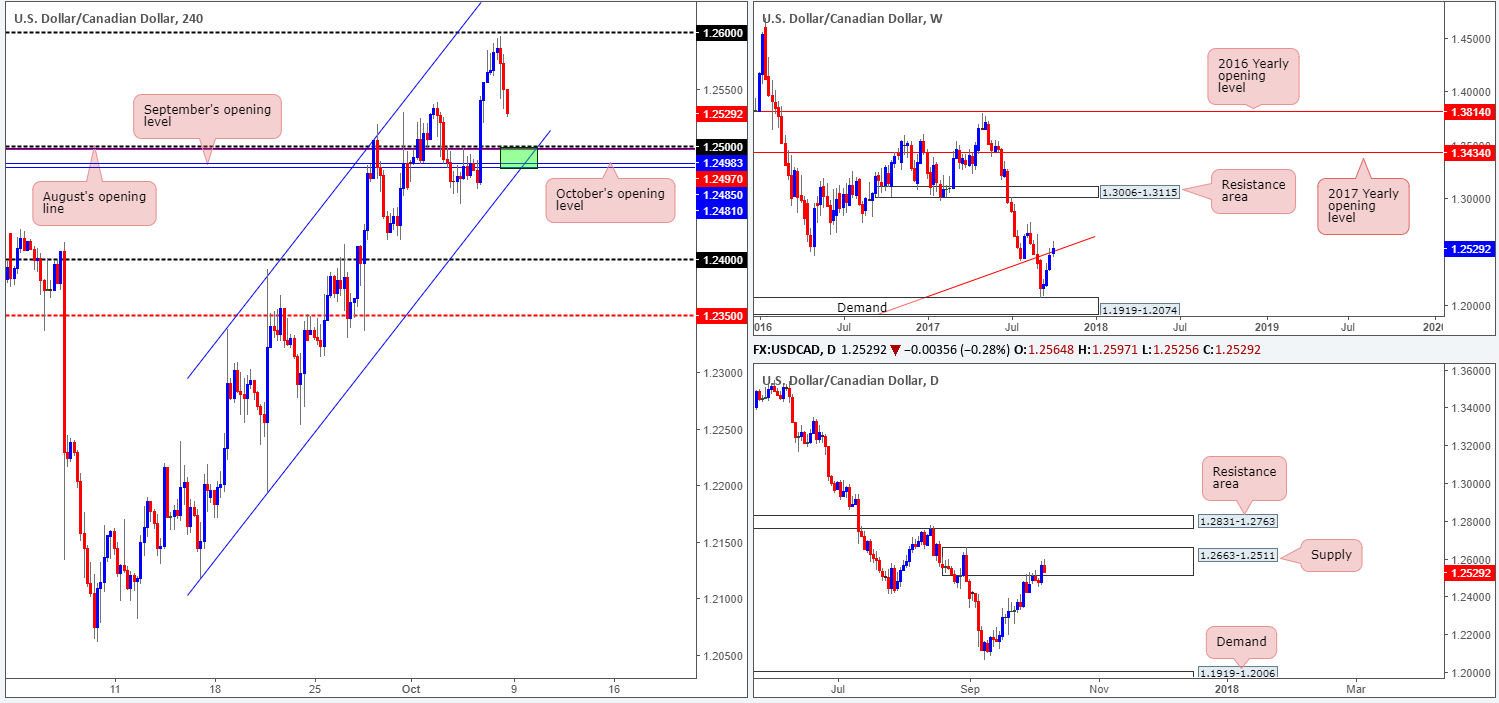
USD/CAD:
Weekly gain/loss: + 66 pips
Weekly closing price: 1.2529
The US dollar punched higher for a fourth straight week in recent dealings, clocking a high of 1.2597. In consequence to this, weekly flow marginally closed above a trendline resistance taken from the low 0.9633. Despite this, the daily candles, as you can see, remain fixed within a strong-looking supply at 1.2663-1.2511.
On Friday, US job’s figures saw a less-than-stellar payrolls number, but was supported by upbeat unemployment and average hourly earnings. In Canada, employment rose less than expected and the unemployment rate came in a little lower than forecasted. In response to these figures, the USD/CAD sold off and ended the day closing 30 pips ahead of the 1.25 handle, which happens to be surrounded by striking confluence!
Suggestions: 1.25 has the potential to bounce price, in our humble opinion. Not only does the level converge with a H4 channel support etched from the low 1.2194, it also boasts August (1.2498), September (1.2481) and October’s (1.2485) monthly opening levels (see H4 green zone). Why we believe these supports will only bounce price is simply due to where the candles are trading on the bigger picture (see above), along with the strong downtrend this market is in at the moment. As such, we would strongly advise waiting for at least a reasonably sized H4 bull candle to take shape from here, preferably in the form of a full or near-full-bodied candle. This will, of course, not guarantee a successful trade, but what it will do is show buyer intent around a high-probability buy zone.
Data points to consider: No high-impacting news events on the docket – both US and Canadian banks closed today.
Levels to watch/live orders:
- Buys: 1.25 region ([waiting for a reasonably sized H4 bullish candle to form – preferably a full, or near-full-bodied candle – is advised] stop loss: ideally beyond the candle’s tail).
- Sells: Flat (stop loss: N/A).
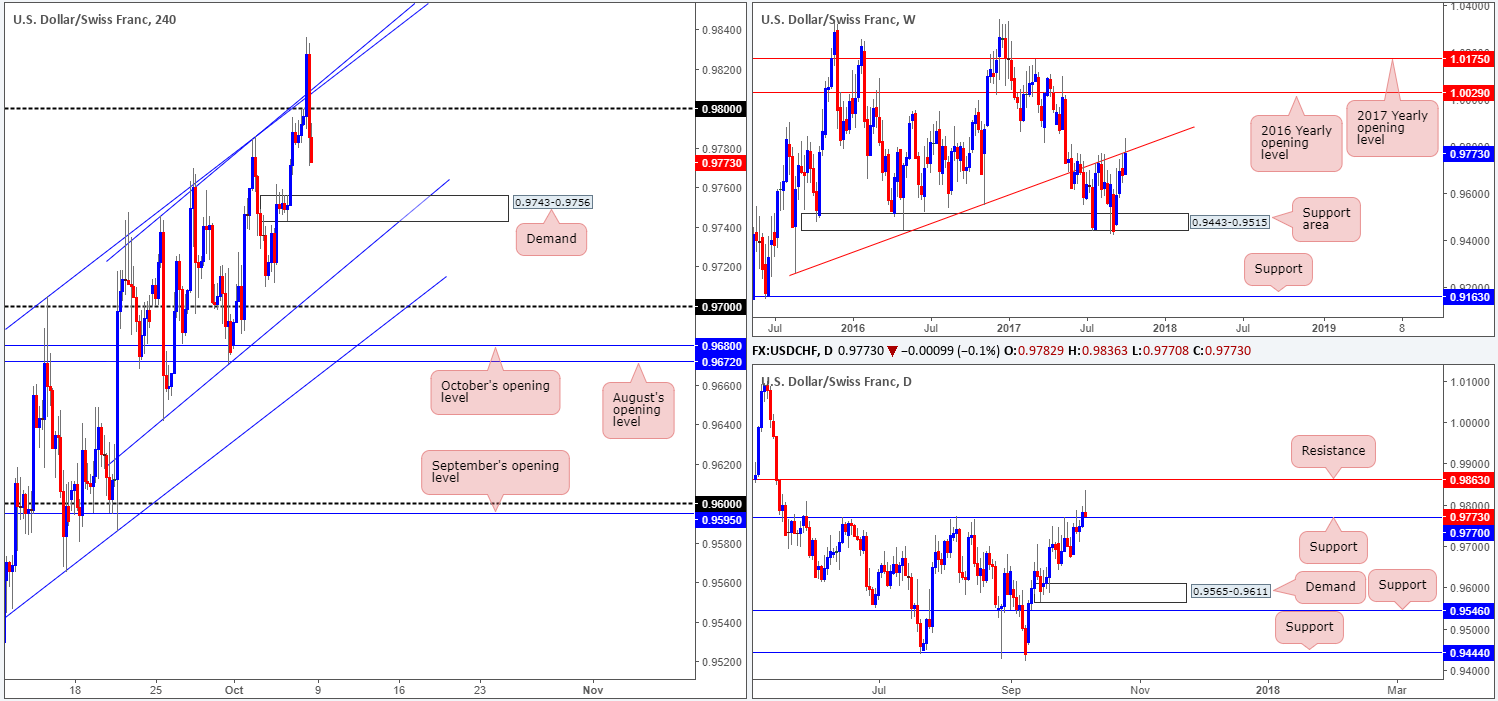
USD/CHF:
Weekly gain/loss: + 97 pips
Weekly closing price: 0.9773
Trade update: small loss taken at 0.9810.
The USD/CHF gained close to 100 pips during last week’s trading, bringing weekly price up to the underside of a trendline resistance extended from the low 0.9257. This line has proven its worth over the past couple of months, and therefore could send the unit lower this week.
The story on the daily timeframe shows price marginally closed above resistance at 0.9770 and formed a bearish selling wick. Remember, support and resistance levels should be viewed as areas rather than fixed numbers in the market. As such, the minor close above the noted resistance is not a bullish cue, in our view, especially given the weekly trendline resistance in play!
Across on the H4 timeframe, the pair immediately rose to fresh highs of 0.9836 on the back of Friday’s job’s data. The move, as you can see though, was a short-lived one as price turned red and concluded the session closing sub 0.98. As of current price, the next downside target on the H4 scale comes in at demand drawn from 0.9743-0.9756.
Suggestions: As of now, we do not see much to hang our hat on – certainly not enough to warrant a trade anyway. For that reason we’ll remain flat in this market and reassess going into tomorrow’s open.
Data points to consider: No high-impacting news events on the docket – US banks closed in observance of Columbus Day.
Levels to watch/live orders:
- Buys: Flat (stop loss: N/A).
- Sells: Flat (stop loss: N/A).
DOW 30:
Weekly gain/loss: + 351 points
Weekly closing price: 22742
US stocks continued to extend gains last week, recording a fresh record high of 22790. What this recent upside move also did, as we highlighted in Friday’s report, was establish a reasonably strong-looking H4 demand area at 22635-22672, which fuses with a recently broken H4 channel resistance extended from the high 22431 (now acting support).
Suggestions: With the uptrend in this market clearly strong and intact, we’re now looking for H4 price to pullback and connect with the said H4 demand at the point where the H4 channel support converges (yellow marker). Should a reasonably sized H4 bull candle take shape from this area (preferably a full or near-full-bodied candle), we would have little hesitation in pulling the trigger here.
Data points to consider: No high-impacting news events on the docket – US banks closed in observance of Columbus Day.
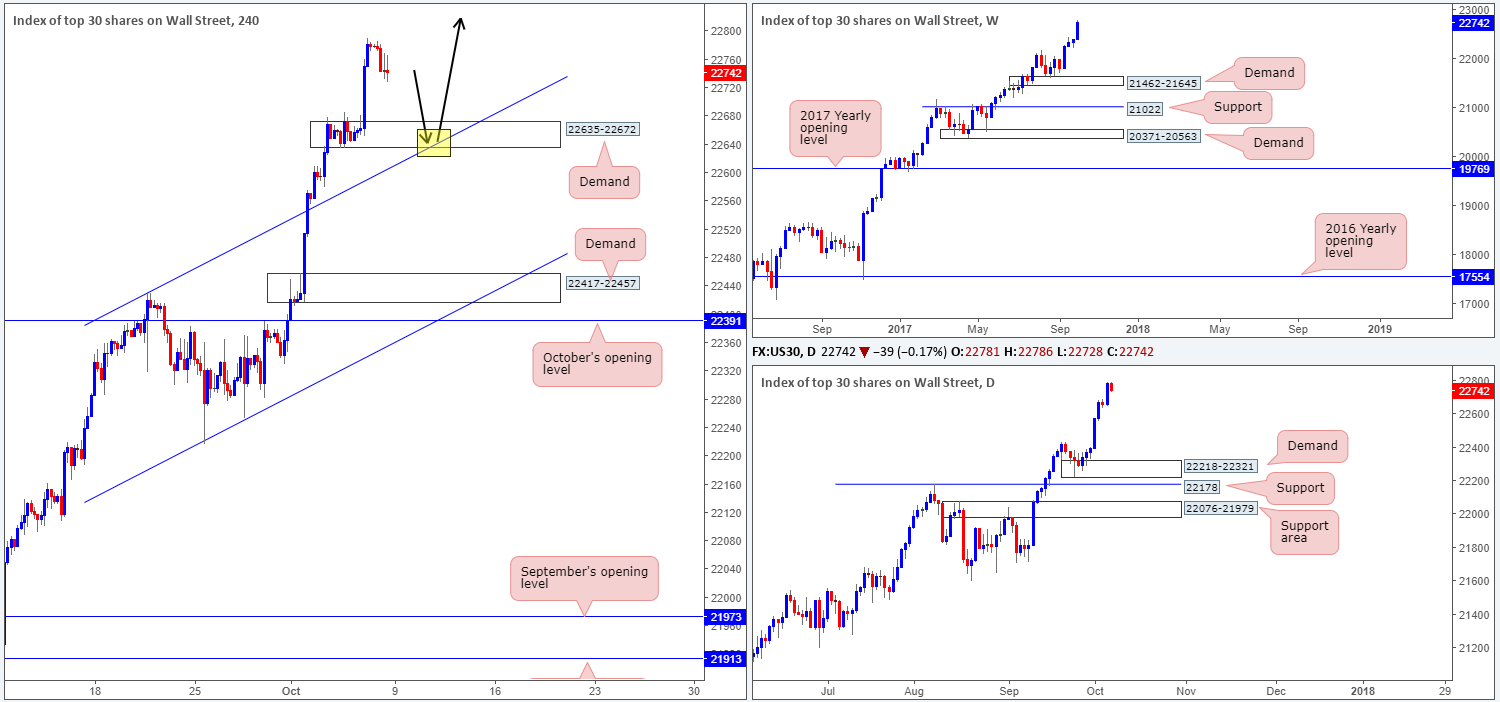
Levels to watch/live orders:
- Buys: Watch for H4 price to test the channel support/demand at 22635-22672 for a long ([waiting for a reasonably sized H4 bullish candle to form – preferably a full, or near-full-bodied candle – is advised] stop loss: ideally beyond the candle’s tail).
- Sells: Flat (stop loss: N/A).
GOLD:
Weekly gain/loss: – $3.5
Weekly closing price: 1276.2
Although the yellow metal ended last week in the red, weekly candle action printed a nice-looking buying tail. While this might excite candlestick traders, we do not see much bolstering the candlestick signal and therefore still believe the unit could head lower and test the weekly channel support extended from the low 1122.8. Zooming for a closer look at daily price, we can see that demand at 1251.7-1265.2 was brought into play on Friday, pushing the metal north to challenge the nearby resistance area at 1275.3-1291.2.
Consequent to Friday’s rally, H4 price is now seen within shouting distance of a notable sell zone marked in yellow at 1280.7/1279.2. The area is comprised of the following structures:
- H4 resistance at 1280.4.
- H4 channel resistance extended from the high 1357.5.
- October’s opening level at 1279.1.
- Fib 38.2% (1280.7)/61.8% (1279.2) taken from highs of 1313.6/1290.3.
Couple the above with price testing a daily resistance area, weekly price showing promise to the downside and the current downtrend, 1280.7/1279.2 makes for a high-probability sell zone.
Suggestions: Put simply, watch for H4 price to strike the yellow H4 sell zone at 1280.7/1279.2 and sell with a stop-loss order planted at 1283.3. The first take-profit target can be seen at August’s opening level carved from 1269.3.

Levels to watch/live orders:
- Buys: Flat (stop loss: N/A).
- Sells: 1280.7/1279.2 (stop loss: 1283.3).


