
A note on lower timeframe confirming price action…
Waiting for lower timeframe confirmation is our main tool to confirm strength within higher timeframe zones, andhas really been the key to our trading success. It takes a little time to understand the subtle nuances, however, as each trade is never the same, but once you master the rhythm so to speak, you will be saved from countless unnecessary losing trades. The following is a list of what we look for:
- A break/retest of supply or demand dependent on which way you’re trading.
- A trendline break/retest.
- Buying/selling tails – essentially we look for a cluster of very obvious spikes off of lower timeframe support and resistance levels within the higher timeframe zone.
- Candlestick patterns. We tend to only stick with pin bars and engulfing bars as these have proven to be the most effective.
EUR/USD:
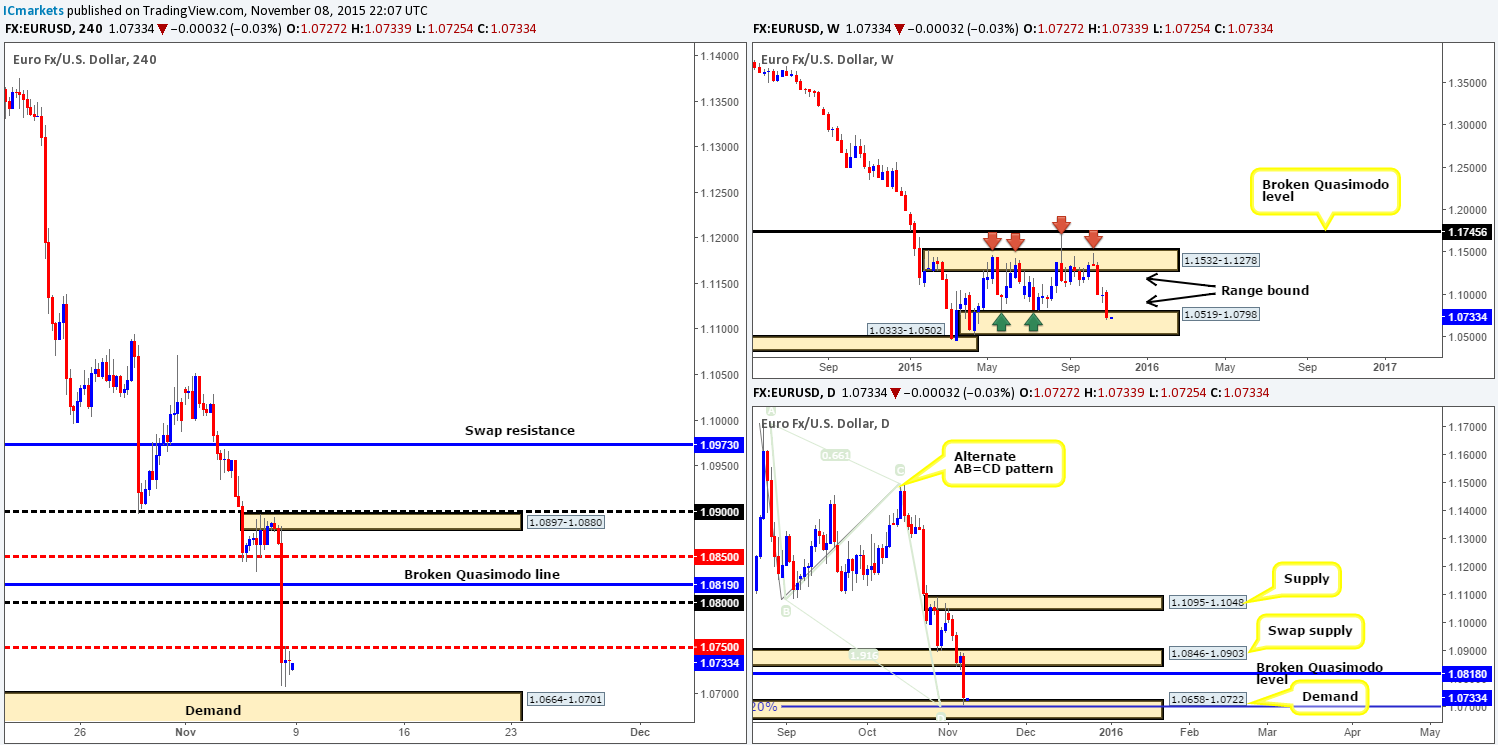
Weekly view:Following the indecision candle painted two weeks ago, the EUR currency continued lower last week, losing around 260 pips in value and driving itself into range demand at 1.0519-1.0798 by the close 1.0736. Therefore, at least from a technical standpoint, we could see this pair possibly advance from here this week.
Weekly levels to watch this week fall in at:1.0519-1.0798.
Daily view:Moving down to the daily timeframe, we can see that other than the somewhat pitiful attempt made by the bulls on Thursday, the EUR did indeed trade in the red for the entire week. The bearish onslaught ended with price shaking hands with demand coming in at 1.0658-1.0722. This area not only sits within the above said weekly range demand, but also coincides nicely with a bullish alternate AB=CD pattern at 1.0697.Should we see a rebound from this region, areas to keep an eye on come in at the broken Quasimodo line at 1.0818, followed closely by the swap supply seen at 1.0846-1.0903. In the event the bears continue punishing this pair south this week, however, we’ll then be looking down to demand drawn from 1.0519-1.0583 (sits within the extreme of the aforementioned weekly range demand).
Daily levels to watch this week fall in at:1.0658-1.0722/1.0818/1.0846-1.0903/1.0519-1.0583.
4hr view:Friday’s nonfarm payrolls number came in positive at 271k versus 181k expected, whilst the unemployment rate dropped to 5% against an expected 5.1%. This, as you can imagine, saw the EUR/USD spiral south taking out numerous 4hr technical levels along the way. As we entered into the final few hours of trade, nonetheless, price begun to consolidate between demand seen at 1.0664-1.0701 (located within the daily demand area mentioned above at 1.0658-1.0722) and mid-level resistance 1.0750.
Pushing forward, this morning’s open 1.0727 made very little difference to the overall technical position of this market. As such, taking into account that price is currently trading around both weekly and daily demand (see above) at present, today’s spotlight will be on either the demand below at 1.0664-1.0701, or a break above or retest of 1.0750 for confirmed longs. Target’s to keep an eye on should one manage to spot an entry long from these barriers today come in at psychological resistance 1.0800, followed closely by the broken Quasimodo line at 1.0819 and mid-level resistance 1.0850.
Levels to watch/live orders:
- Buys:1.0664-1.0701 [Tentative – confirmation required] (Stop loss: dependent on where one confirms this area) watch for offers to be consumed around 1.0750 and then look to trade any retest seen at this level (confirmation required).
- Sells:Flat (Stop loss: N/A).
GBP/USD:
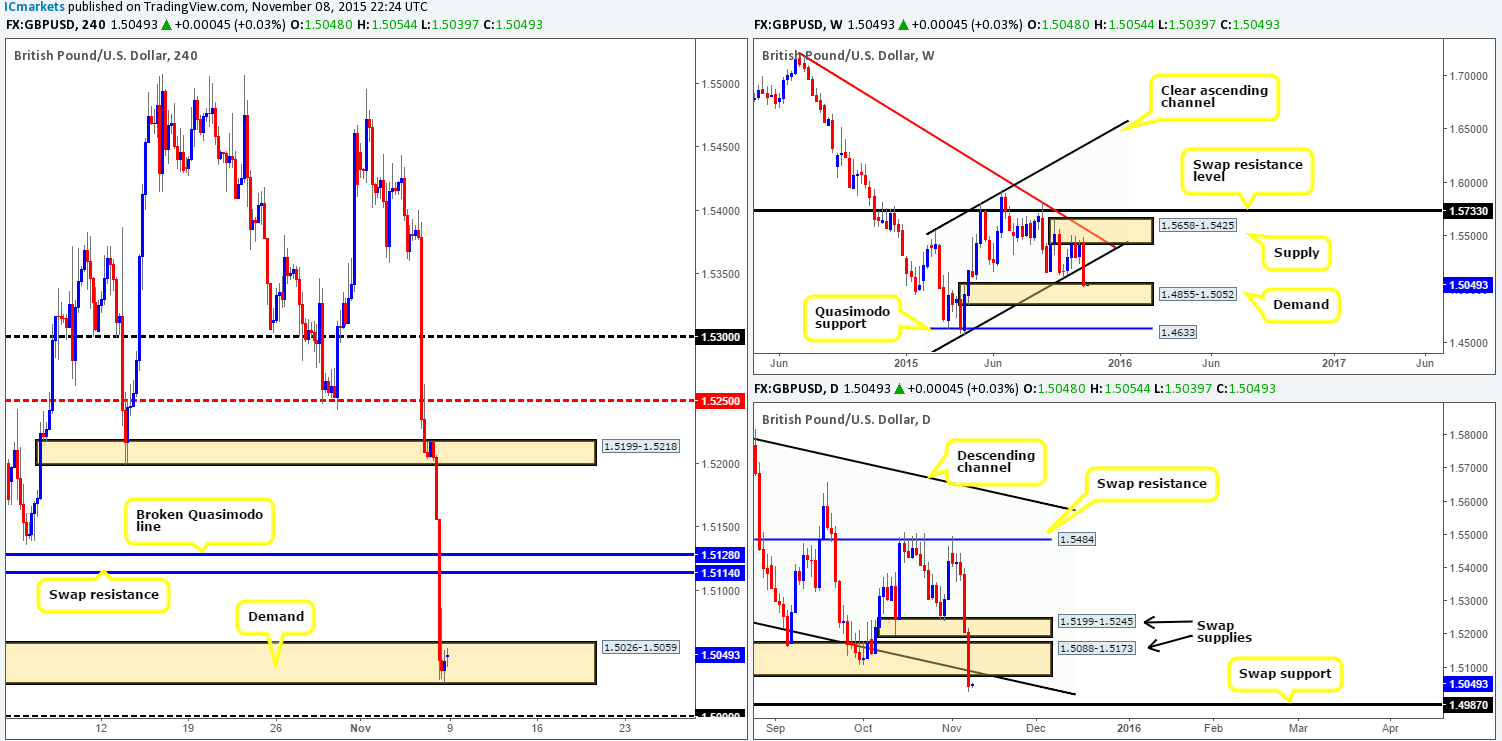
Weekly view:Pound Sterling took an absolute beating last week, dropping almost 380 pips. This descent took out channel support extended from the low 1.4564, and drove into demand coming in at 1.4855-1.5052, closing pretty much on its lows at 1.5044. It will be interesting to see how Cable reacts to this zone this week, since this is effectively its first visit. Should the bulls make an appearance here, we’ll be eyeing the underside of the recently broken channel support-turned resistance as a potential turning point. Conversely, a break below the current demand will likely place the Quasimodo support at 1.4633 in the firing range.
Weekly levels to watch this week fall in at:1.4855-1.5052/Underside of channel support/1.4633.
Daily view:From this angle, it’s clear to see that the sell-side of this market came alive going into Thursday and Friday’s trade. Several demand areas were taken out as a result and price ended the week closing below a descending channel support taken from 1.5329. Consequent to this, we believe the path south could potentially be free down to the swap support hurdle visible at 1.4987 this week. It will be interesting to see what the 4hr timeframe has to say…
Daily levels to watch this week fall in at:1.5088-1.5173/1.4987.
4hr view:Looking at the 4hr chart, it appears as though Cable just fell off an exceedingly steep cliff! There is literally nothing in sight but a sea of depressing red candles. Price ended last week’s selling onslaught consolidating within demand drawn from 1.5026-1.5059, and opened this morning with little change at 1.5048.
Given that the weekly chart indicates buying could be possible, and the daily shows there is in fact room to continue lower down to a swap support (see above), we’re hesitant buying from the current 4hr demand zone at 1.5026-1.5059. That is not to say that we would not buy from here, it’s just we’d rather see lower timeframe confirmation (preferably on the 30/60 minute timeframes) form beforehand. Nevertheless, assuming that this demand does indeed give way today, we, and probably most of the market, will be honing in on psychological support 1.5000. This – coupled with the daily swap (support) barrier seen just below it at 1.4987, makes this one heck of a buy zone to keep a tab on today/this week.
Levels to watch/ live orders:
- Buys: 1.5206-1.5059 [Tentative – confirmation required] (Stop loss: dependent on where one confirms this area) 1.5000/1.4987 [Tentative – confirmation required] (Stop loss: dependent on where one confirms this area).
- Sells: Flat (Stop loss: N/A).
AUD/USD:
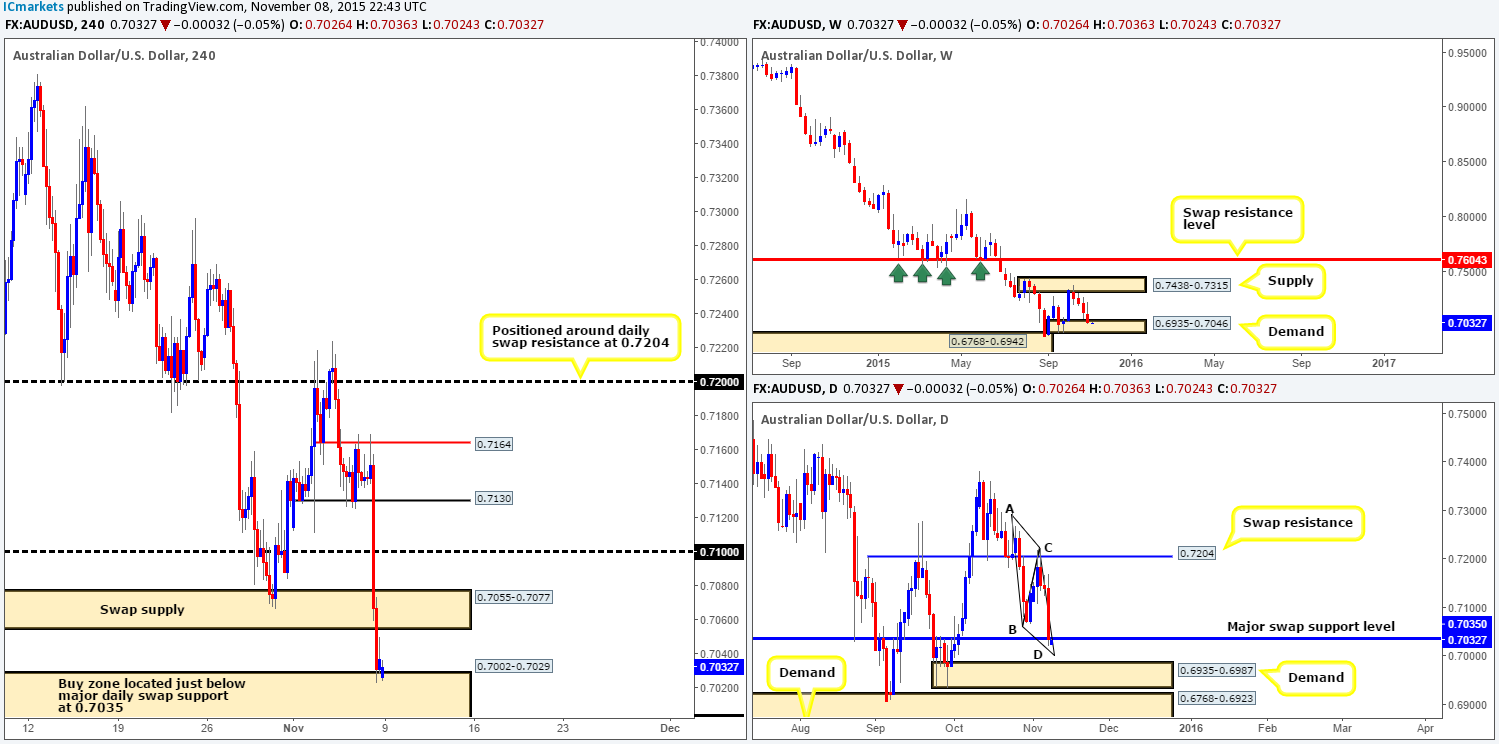
Weekly view:Once again, the Aussie dollar closes the week in the red at 0.7036, consequently forcing price to dig deeper into the current demand zone seen at 0.6935-0.7046. Considering that this pair is entrenched in a humongous downtrend at the moment, it is difficult to hold faith in this area. Nonetheless, ‘we trade what we see and not what we THINK’. Therefore, price is currently in DEMAND for the time being. It will be interesting to see what the lower timeframes have on offer…
Weekly levels to watch this week fall in at:0.6935-0.7046.
Daily view:Rolling a page lower, we can see that daily action closed the week on top of a major swap support level seen at 0.7035. Most would agree that this level combined with the weekly demand zone mentioned above forms a relatively cool buy zone. Additionally, traders may also notice that price appears to be in the process of forming a nice-looking AB=CD bullish pattern that completes a little lower at 0.7000, just above a demand zone drawn from 0.6935-0.6987. Therefore, there is a possibility that this market may jab lower this week before the bulls make an appearance.
Daily levels to watch this week fall in at: 0.7035/0.6935-0.6987.
4hr view:The AUD/USD saw prices tank on Friday on the back of the positive NFP data. As you can see, several technical levels were taken out in the process before price begun to stabilize around the top-side of demand taken from 0.7002-0.7029 (sits just below the major swap [support] level on the daily timeframe mentioned above at 0.7035).
With the Aussie effectively trading within all-round support right now (see above on all three timeframes), and this morning’s open 0.7026 making very little difference to the current structure, we are, at least technically, biased long for the time being. Nevertheless, taking into account the huge downtrend this pair is currently in and the fact that there is a little room being seen to move lower on the daily timeframe (see above), we must be prepared for further downside within the current 4hr demand, and even quite possibly a fakeout below. Remember, the lower limits of the current 4hr demand represents not only a huge psychological support at 0.7000, it is also a bottom of an AB=CD bull pattern on the daily timeframe!
Levels to watch/ live orders:
- Buys:0.7002-0.7029 [Tentative – confirmation required] (Stop loss: dependent on where one confirms this area – expect the possibility of a fake lower).
- Sells:Flat (Stop loss: N/A).
USD/JPY:
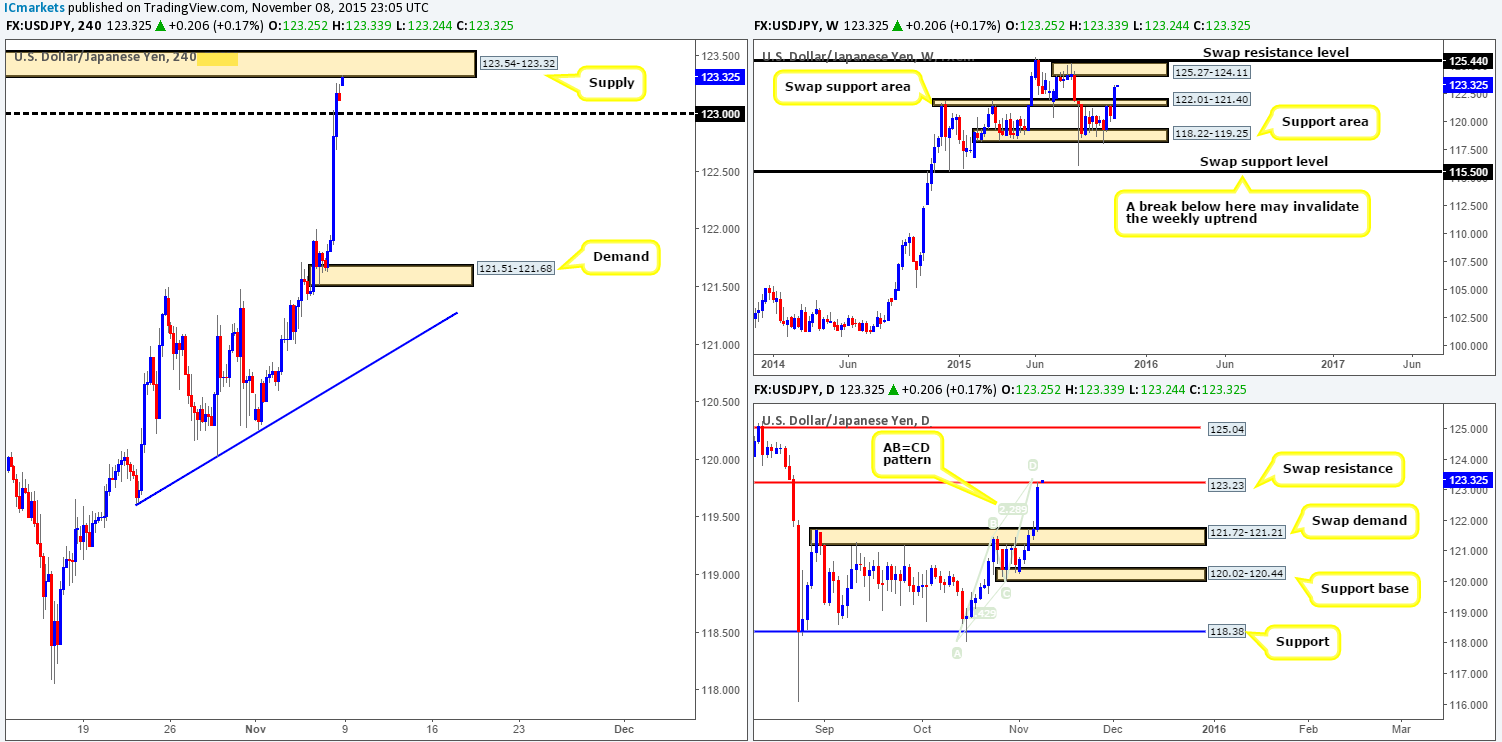
Weekly view:Last week’s action saw the bulls press forward, taking out the swap resistance (now support) area at 122.01-121.40 and close near its highs at 123.11. Potentially, this has opened up the gates for further upside this week towards supply seen at 125.27-124.11, followed closely by the swap resistance level above it at 125.44.
Weekly levels to watch this week fall in at:122.01-121.40/125.27-124.11/124.44.
Daily view:Down on the daily timeframe, however, last week’s recent ascent broke above range supply (now demand) at 121.72-121.21 (positioned within the weekly swap [support] area at 122.01-121.40), and connected beautifully with a swap resistance at 123.33 (converges nicely with an AB=CD bear top at 123.43) by the week’s end.
A rejection from this level this week could see the USD/JPY pullback to swap demand at 121.72-121.21. A break above, nonetheless, would likely force this market further north up to Quasimodo resistance seen at 125.04 (located deep within the above said weekly supply).
Daily levels to watch this week fall in at: 123.23/125.05/121.72-121.21.
4hr view:It is pretty clear to see who came out on top during Friday’s NFP shenanigans. The buyers were relentless! Price closed the week tightly consolidating below supply coming in at 123.54-123.32, and opened this morning with a small 14-pip gap north up into the aforementioned supply zone.
This supply, albeit small, coincides beautifully with daily structure – the swap resistance level at 123.23 and also the AB=CD bear top at 123.43. With that, our team is looking to short (with confirmation) this market at the current 4hr supply, targeting psychological support 123.00 first and foremost. Granted, we know that by selling here, we are effectively going against our findings on the weekly chart (see above), hence the reason for keeping our initial target small – 123.00.
Levels to watch/ live orders:
- Buys: Flat (Stop loss: N/A).
- Sells:123.54-123.32 [Tentative – confirmation required] (Stop loss: dependent on where confirms this area).
USD/CAD:
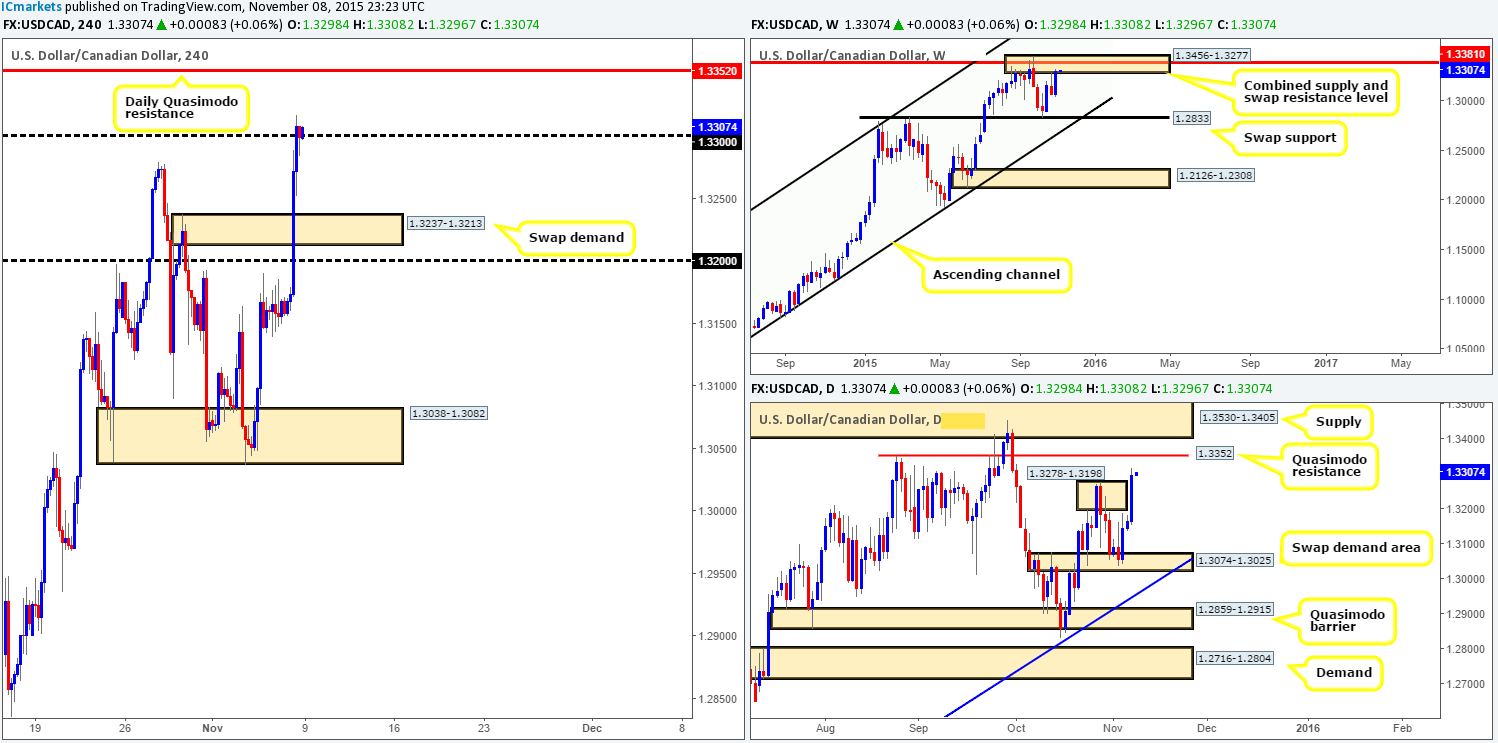
Weekly view:Renewed buying interest came into the market last week, pushing this pair back up into the jaws of the combined supply and swap resistance area at 1.3456-1.3277/1.3381, gaining around 230 pips at the close 1.3300. Should this zone once again be respected, we could eventually see price touch gloves with swap support below coming in at 1.2833. On the other side of the coin, a break above this area will likely place supply at 1.3818-1.3630 in the limelight.
Weekly levels to watch this week fall in at:1.3456-1.3277/1.2833/1.3818-1.3630.
Daily view:Following Wednesday’s rebound from the swap demand base at 1.3074-1.3025; the USDCAD continued to appreciate, breaking above supply at 1.3278-1.3198 by the end of the week. This, in itself, has likely set the stage for a possible drive higher this week as per this timeframe, since above we see very little resistance until the Quasimodo level at 1.3352, followed closely by a large supply seen at 1.3530-1.3405.
Daily levels to watch this week fall in at: 1.3352/1.3530-1.3405.
4hr view:As we can all see, Friday’s NFP-induced rally saw the USD/CAD close the week out on top of Psychological support 1.3300, and open this morning two pips lower at 1.3298. So far, price appears to be establishing support at this number. Should this continue today, we may see a bounce north up to the aforementioned daily Quasimodo resistance level. Personally, we have no interest in buying from 1.3300 today. In fact, we have no interest in buying at all right now. What we are interested in, however, is the possibility of shorting from the daily Quasimodo resistance due to it sitting within the above said weekly combined supply and swap resistance area.
Levels to watch/ live orders:
- Buys:Flat (stop loss: N/A).
- Sells:1.3352 [Tentative – confirmation required] (Stop loss: dependent on where one confirms this level).
USD/CHF:
Weekly view:The USD/CHF rallied higher for a third consecutive week last week, gaining around 180 pips into the close 1.0046, and jabbing into the lower limits of a stacked supply formation coming in at 1.0126-1.0044 (upper zone is seen at 1.0239-1.0131). In addition to this, we also see a nice-looking AB=CD Harmonic pattern completing around 1.0046 region, thus forming one heck of a sell zone to keep an eye on this week! Should a sell-off be seen from here, the next level to keep a tab on comes in at 0.9796.
Weekly levels to watch this week fall in at:1.0126-1.0044/0.9796.
Daily view:Similar to that of the weekly timeframe, daily action shows price ended the week kissing the underside of supply drawn from 1.0126-1.0055 (ties in lovely with the weekly supply area mentioned above at 1.0126-1.0044). Downside targets from this zone, however, can be seen around the swap support level at 0.9956, followed by 0.9896, also a swap support level.
Daily levels to watch this week fall in at:1.0126-1.0055/0.9956/0.9896.
4hr view:The USD/CHF, as you can see, accelerated north during Friday’s trade on U.S. data. This took out several technical levels before entering into a phase of consolidation just below a clear resistance level coming in at 1.0083.
Now, given that this morning’s open 1.0049 has not made any change to current structure on this pair, our team is naturally swaying to the short-side of the market today/this week. Both the weekly and daily are trading around nice-looking sell zones at the moment (see above), and 4hr action is lurking just below a resistance.
Ultimately though, what we’re looking for is price to attack the 4hr resistance level today and hold firm. This would, combined with the higher timeframe picture, give us enough confidence to short this pair, targeting parity first and foremost.
Guys, even though the 4hr resistance level boasts higher timeframe confluence, we would still recommend waiting for confirmation here seeing, as price could still fake above this level to connect with psychological resistance 1.0100.

Levels to watch/ live orders:
- Buys:Flat (Stop loss: N/A).
- Sells:1.0083 [Tentative – confirmation required] (Stop loss: dependent on where one confirms this level).
DOW 30:
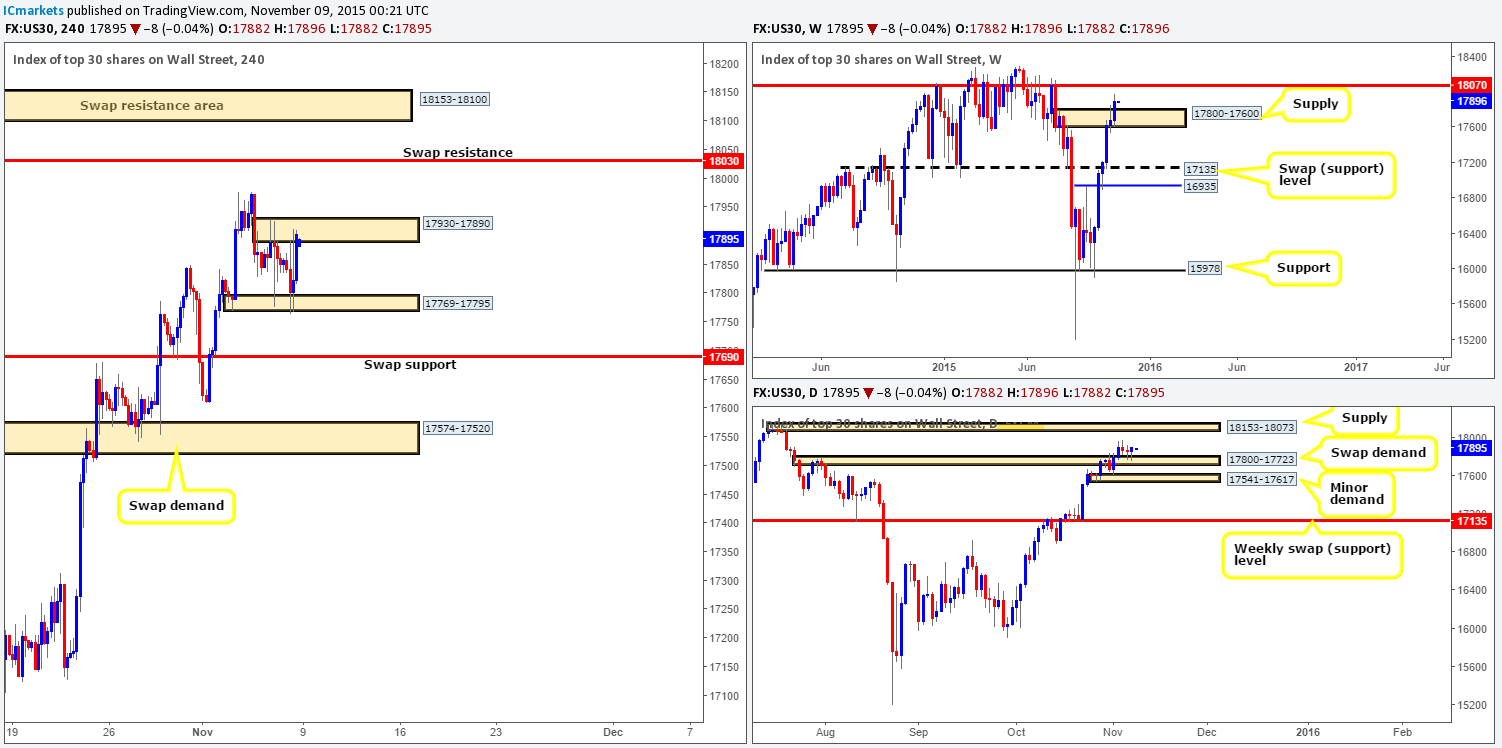
Weekly view: Following the spike above supply seen at 17800-17600, the DOW continued its relentless march north last week. This time, however, price closed above the supply zone at 17903, gaining 223 points on the week. Judging by the strength of this close, we see little reason not to expect this market to continue north this week up into the hands of a resistance level coming in at 18070.
Weekly levels to watch this week fall in at:17800-17600/18070.
Daily view:On the other side of the ledger, we can see that price painted rejection tails off the top-side of the recently broken supply zone (now demand) at 17800-17723 on Thursday and Friday. This, at least to us, suggests that the DOW may want to continue advancing this week up to supply drawn from 18153-18073 (sits just above the weekly resistance level mentioned above at 18070).
Daily levels to watch this week fall in at:17800-17723/18153-18073.
4hr view:From Thursday onwards last week, the DOW entered into a phase of consolidation between demand at 17769-17795, and a resistance area visible at 17930-17890. Given this morning’s open 17882 has kept price within the upper limits of the said range, where do we see this market heading to today and possibly into the week?
Well, taking into consideration where price is positioned on the higher timeframe picture right now (see above), we feel there is a good chance price will eventually break out north from the current 4hr consolidation. This, as a result, will likely see price connect with at least the swap resistance level coming in at 18030. However, we have no interest in selling from here, as we have our eye on the swap resistance area above it at 18153-18100. The reason for why comes from this area sitting nicely within the daily supply mentioned above at 18153-18073, and thirty points above the weekly resistance level at 18070.
Levels to watch/ live orders:
- Buys: Flat (Stop loss: N/A).
- Sells:18153-18100 [Tentative – confirmation required] (Stop loss: dependent on where one confirms this area).
XAU/USD: (Gold)
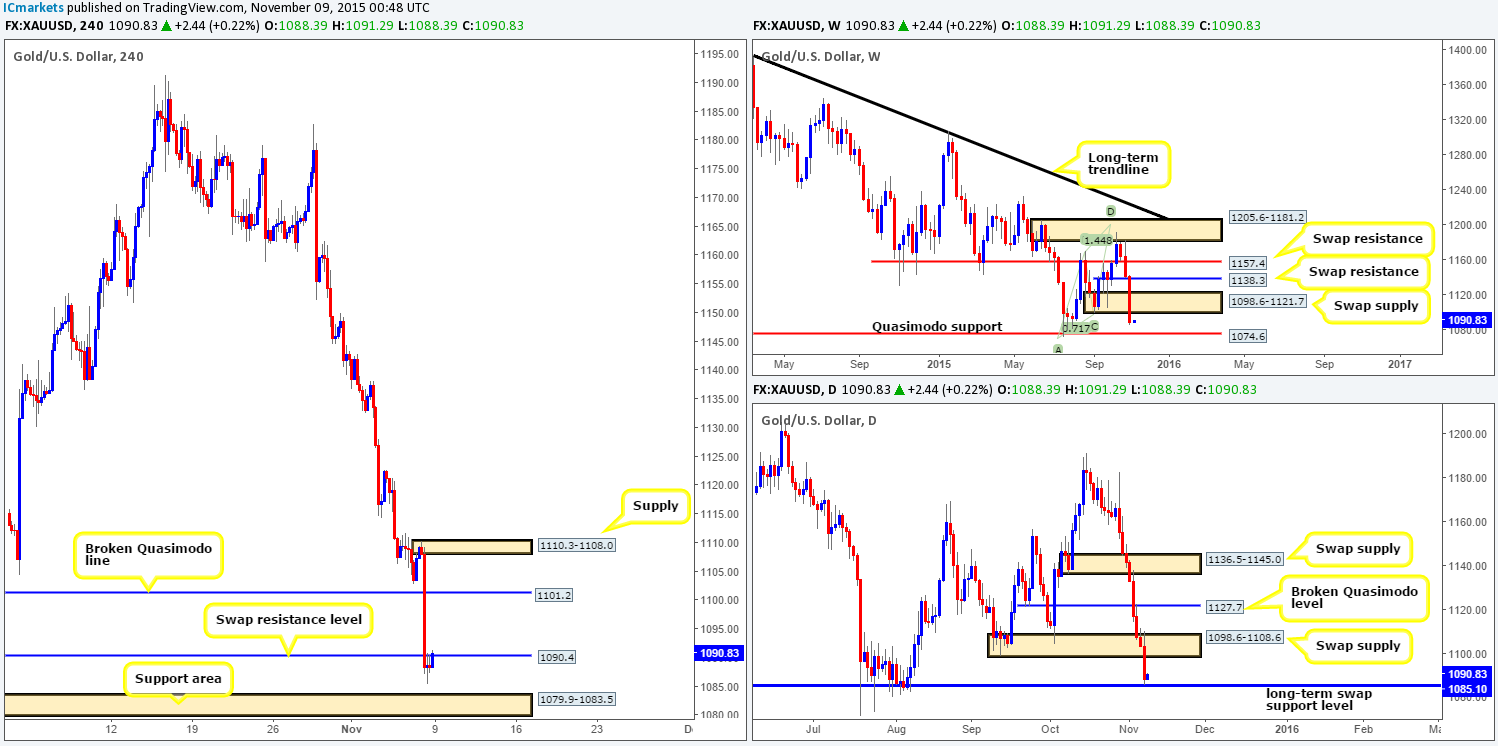
Weekly view:Gold sustained further losses for a third consecutive week last week, losing over a whopping $53 in value during the onslaught. This lemming-like stampede took out demand seen at 1098.6-1121.7, and closed near its lows at 1088.3, potentially opening up to the path to lower prices this week down towards Quasimodo support drawn from 1074.6.
Weekly levels to watch this week fall in at:1098.6-1121.7/1074.6.
Daily view:Looking down to the daily timeframe, however, we can see that the recent descent took out demand at 1098.6-1108.6, and closed the week slightly rebounding off of a long-term swap support level at 1085.1. Should the buyers defend this level going into this week’s trade, we can likely expect at least a bounce back up to the underside of the recently broken demand at 1098.6. Alternatively, a break lower would likely pave the way south for a test of another long-term swap support level sitting at 1063.4.
Daily levels to watch this week fall in at: 1085.1/1098.6-1108.6/1063.4.
4hr view:Friday’s action really took its toll on Gold as prices tanked on positive U.S. data. Several supports were taken out during the sell-off and only began stabilizing once price hits lows of1085.4 and retested 1090.4 as resistance.
Going forward, the market opened this morning at 1088.3 and is currently retesting the underside of 1090.4 once again. By and large, we believe this market is a little tricky to trade right now. On the one hand we have weekly action indicating lower prices are possible down to Quasimodo support at 1074.6. However, on the other hand, price on the daily timeframe shows Gold is rebounding from a long-term swap support level mentioned above at 1085.1.
With this in mind, here is how we plan to approach this market today/this week… The 4hr swap resistance level at 1090.4 is key today. A close above and retest of this number will not only give us the opportunity to potentially enter long targeting the broken Quasimodo line at 1101.2, but also confirm bullish strength from the aforementioned daily (long-term) swap support.
A rejection of 1090.4, nonetheless, could suggest price is heading down to the 4hr support area at 1079.9-1083.5 (we have no interest in selling from 1090.4 due to the daily support structure). Seeing as this zone sits above a weekly Quasimodo level at 1074.6, one has to be careful entering long from here as price may continue lower to collect weekly buyers.
Levels to watch/live orders:
- Buys:Watch for offers to be consumed around 1090.4 and then look to trade any retest seen at this level (confirmation required).
- Sells: Flat (Stop loss: N/A).


