
EUR/USD:
Weekly gain/loss: -0.34%
Weekly closing price: 1.2279
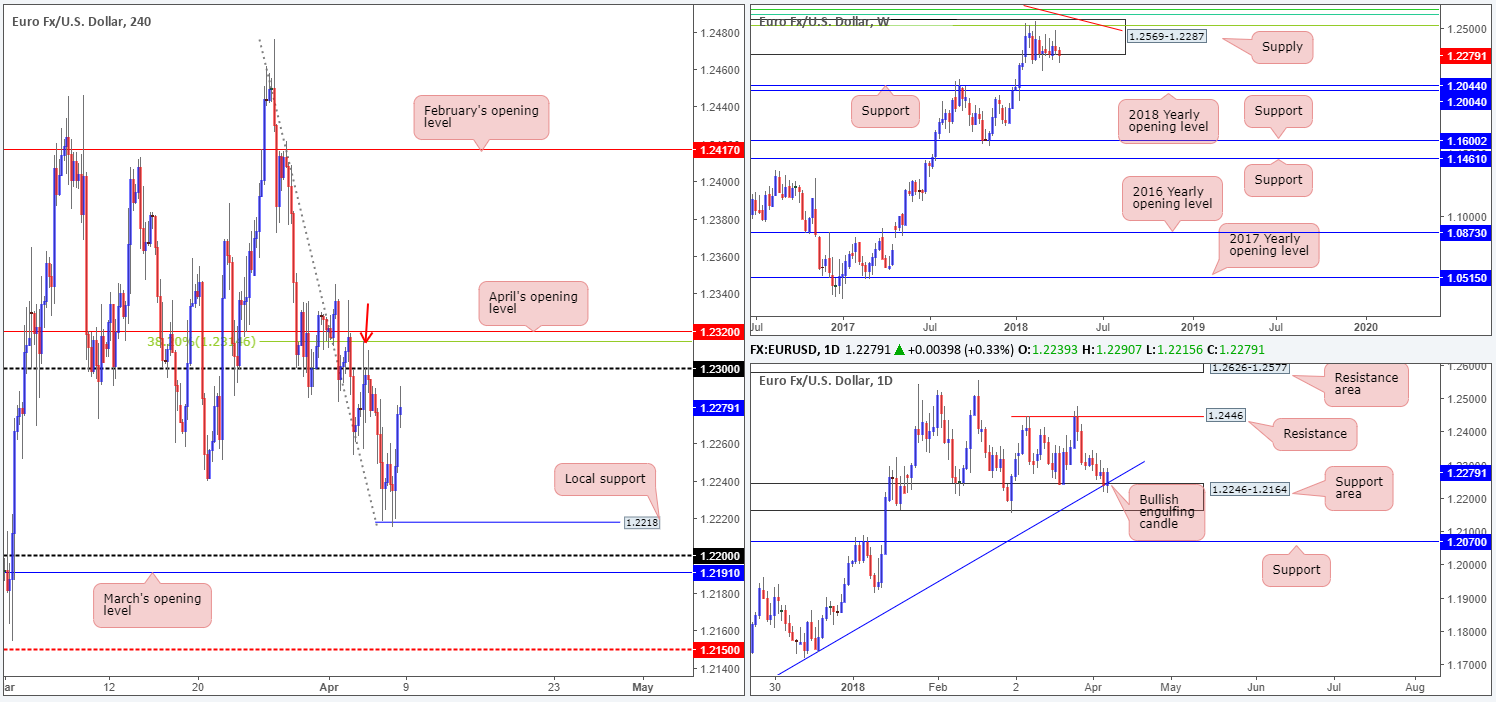
Since late January, the buyers and sellers have been competing for position within a major-league weekly supply at 1.2569-1.2287. Formed by a strong bearish base back in late 2014, this area also brings attention to a weekly Fibonacci resistance cluster (see below for the values) and long-term weekly trend line resistance (extended from the high 1.6038) seen circling around the top edge of this zone. Downside targets from this angle fall in around the weekly support band at 1.2044, shadowed closely by the 2018 yearly opening level at 1.2004.
- 61.8% Fib resistance at 1.2604 taken from the high 1.3993.
- 50.0% Fib resistance at 1.2644 taken from the high 1.4940.
- 38.2% Fib resistance at 1.2519 taken from the high 1.6038.
A closer look at price action on the daily timeframe, nonetheless, stations the single currency at a rather exciting area of daily support drawn from 1.2246-1.2164. Notice how the zone communicates beautifully with a long-term daily trend line support etched from the low 1.0569 – has capped market action since late January – and also rebounded price on Friday in the shape of a daily bullish engulfing formation.
The impact of Friday’s US employment figures sent the euro higher against its US counterpart. The US economy created 103K jobs during March, missing consensus at 188K and down from February’s 326K number (revised from 313K). Also weighing on the US dollar was the US unemployment rate which reported a slight increase at 4.1% vs. expected 4.0%. As you can see from the H4 timeframe, Friday’s move wrapped up the day closing 20 pips shy of the 1.23 handle, shadowed closely by a 38.2% H4 Fib resistance at 1.2314 and April’s opening level at 1.2320.
Potential trading zones:
Medium/long-term moves are somewhat restricted at the moment. On one hand we have weekly flow threatening a push lower, and on the other hand we can see that daily price is potentially looking to cement another rally from its daily support area.
Short-term action going into Monday will likely be quiet given the light economic docket. A move up to 1.23, nevertheless, is possible. Should you consider attempting to fade this number, remain cognizant of the overhead H4 levels highlighted above, as these could encourage price to run stops sitting above the psychological level, as it did during the early hours of Wednesday’s session (see red arrow).
Data points to consider today: No high-impacting events scheduled for release.
GBP/USD:
Weekly gain/loss: +0.50%
Weekly closing price: 1.4087
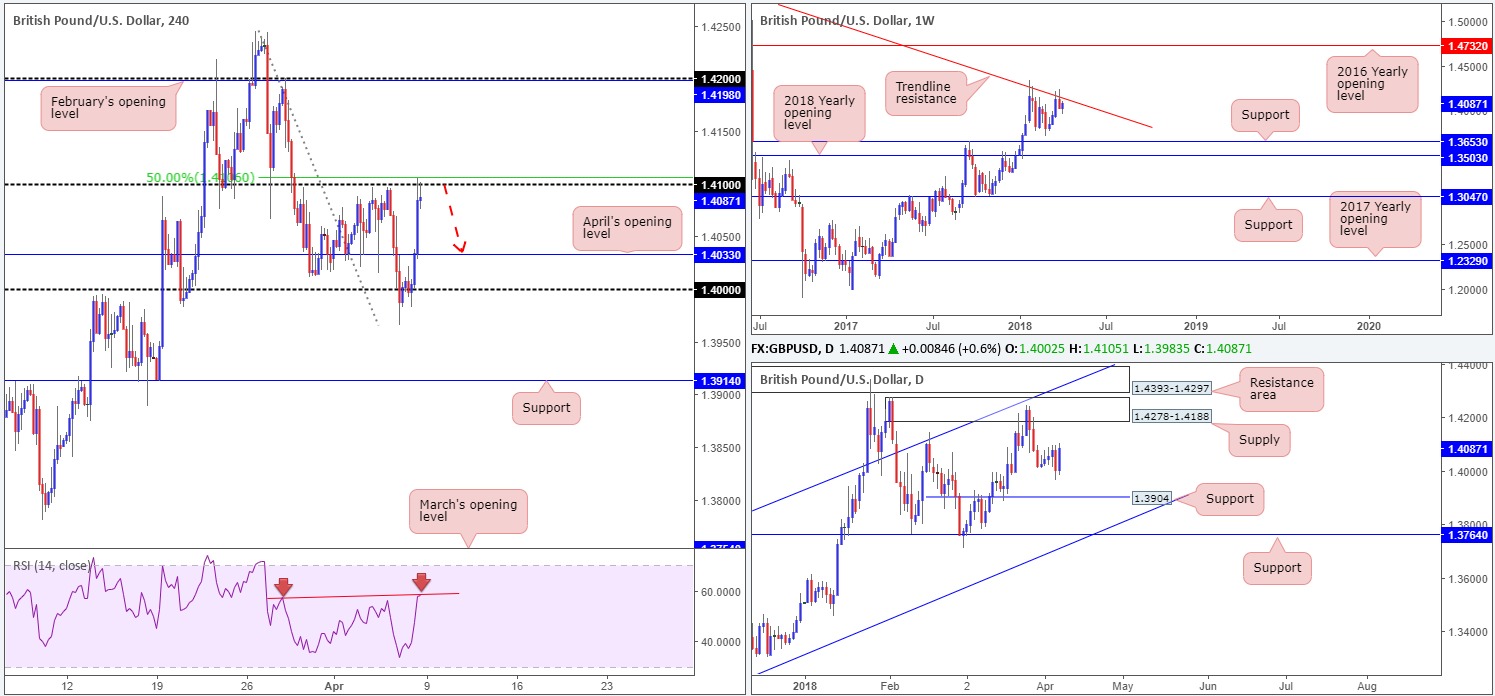
From the top, we can see that weekly movement continues to reflect somewhat of a bearish note from a structural standpoint, owing to the weekly trend line resistance taken from the high 1.5930. Having seen this line force price in excess of 500 pips lower in early January, there’s a chance we may eventually see history repeat itself here.
On the other side of the spectrum, daily flow is seen trading mid-range between a daily supply coming in at 1.4278-1.4188 (located just beneath a daily resistance area at 1.4393-1.4297) and a daily support level pegged at 1.3904. A break of this support, however, could lead to a move being seen down to another layer of daily support plotted at 1.3764, which closely merges with a daily channel support taken from the low 1.2108.
Influenced by Friday’s disappointing US job’s data, the British pound aggressively drove northbound. Punching its way through orders at April’s opening level taken from 1.4033, the pair ended the day tapping 1.14, which, as you can see, merges closely with a 50.0% resistance value at 1.4107. Alongside 1.41, traders may have also noticed that the H4 RSI is currently displaying a divergence play.
Potential trading zones:
In view of back-to-back H4 selling wicks printed off of 1.41 going into Friday’s close, and the fact that we also have a 50.0% resistance value, a divergence play on the H4 RSI and a weekly trend line resistance in motion, shorting from 1.41 could be an option today. The initial take-profit target from here falls in at 1.4033: April’s opening level, followed then by the key figure 1.40. Of course, though, price could potentially drive as low as the daily support mentioned above at 1.3904.
Data points to consider today: UK Halifax HPI m/m.
AUD/USD:
Weekly gain/loss: -0.01%
Weekly closing price: 0.7671
The AUD/USD ended the week effectively unchanged.
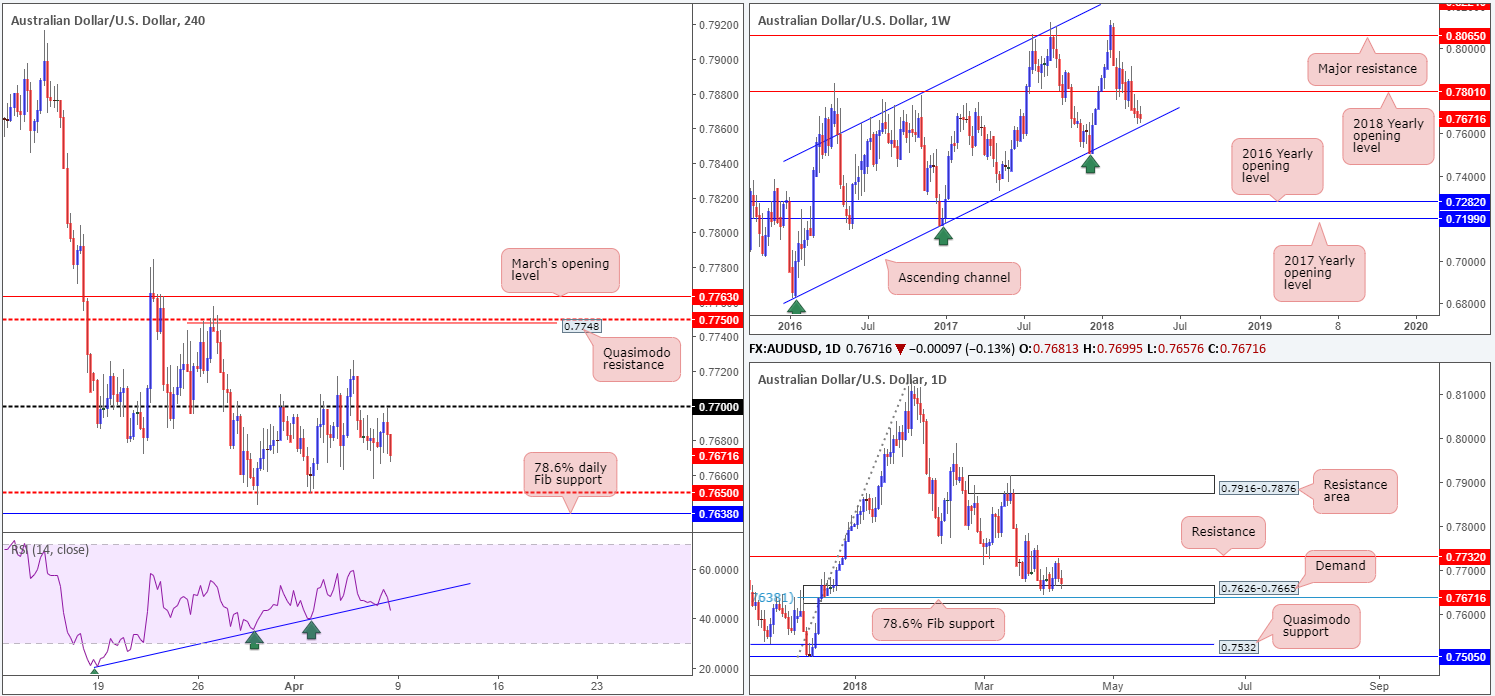
As is evident from the weekly timeframe, price action remains hovering just north of a long-term weekly channel support taken from the low 0.6827. A test of this barrier could very well see the unit bounce higher and challenge the 2018 yearly opening level at 0.7801.
Turning the focus on the daily timeframe, the daily demand at 0.7626-0.7665, as you can see, remains in play despite a failed attempt to push higher last week. The important thing to consider here, though, is that the area also houses a 78.6% daily Fib support seen at 0.7638, which aligns almost perfectly with the aforementioned weekly channel support.
A quick recap of Friday’s trade shows that upon connecting with the 0.77 handle, the H4 candles quickly pared NFP-induced gains. Concluding the day closing in the shape of a near-full-bodied H4 bearish candle, traders’ crosshairs will now likely be fixed on the H4 mid-level support pegged at 0.7650. Also worth highlighting is the H4 RSI which shows a clear trend line break to the downside, potentially indicating further selling.
Potential trading zones:
In a similar fashion to previous reports, the team has noted the 78.6% daily Fib support at 0.7638 (seen a touch beneath the current H4 mid-level support) as a potential buy zone. This is largely due to its position: within the current daily demand and intersecting with the weekly channel support mentioned above.
This could prove to be a reasonably big move seeing as we’re utilizing higher-timeframe areas. Therefore, stop-loss orders would be best placed 5-10 pips beyond the current daily demand with the initial upside target falling in at 0.77, followed by a daily resistance drawn from 0.7732.
Data points to consider today: No high-impacting events scheduled for release.
USD/JPY:
Weekly gain/loss: +0.62%
Weekly closing price: 106.91
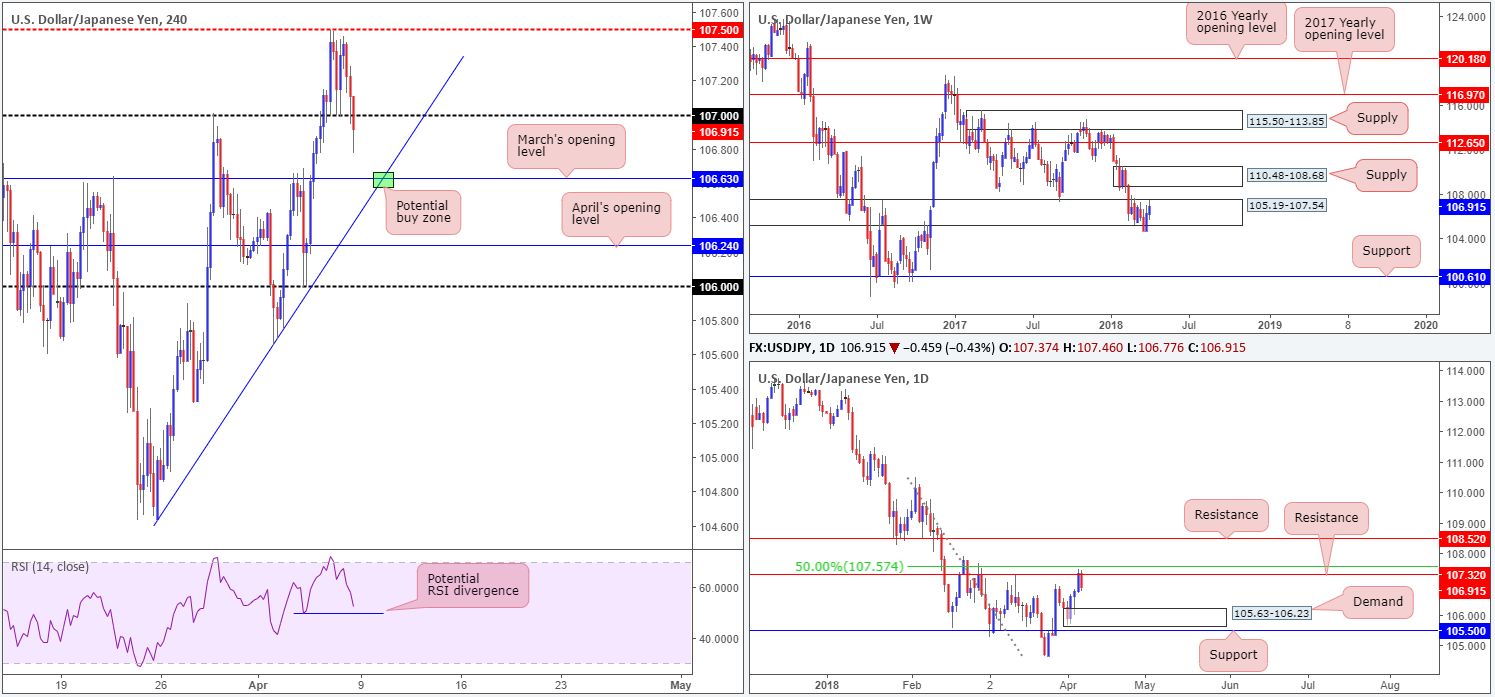
Following a decisive close beneath 105.19-107.54 on the weekly timeframe, the USD/JPY rotated back to the upside in strong fashion. Further buying, as you can see, took place last week, bringing the unit to the upper edge of the aforementioned weekly zone. This could prompt USD buying this week and potentially target a weekly supply zone pegged at 110.48-108.68.
Breaking a three-day bullish phase, Friday’s daily candle reversed beautifully from daily resistance plotted at 107.32 (positioned closely to a 50.0% resistance value at 107.57). In the shape of a daily inside candle formation, this rejection could set the stage for a continuation move south to daily demand seen at 105.63-106.23.
Despite a reasonably solid bounce from the 107 handle, the pair lost momentum just south of the H4 mid-level resistance at 107.50. Prompted by weak US job’s data and a waning US equity market, H4 action pressed lower and conquered the 107 handle going into the closing bell. The break below this number has placed the spotlight firmly on March’s opening level at 106.63, which happens to merge nicely with a H4 trend line support etched from the low 104.62.
Potential trading zones:
From a technical standpoint, we really like March’s opening level mentioned above on the H4 timeframe at 106.63. The point at where the monthly level and H4 trend line intersect (green area) is particularly appealing. Not only this, we also believe that if/when price connects with this point, there will be credible divergence seen on the H4 RSI indicator. The 107 handle seems a viable intraday target from this point, followed then by the aforementioned daily resistance.
While H4 technicals appear sound – coupled with the backing of potential upside on the weekly timeframe – traders still need to remain cognizant of daily flow selling from resistance! Therefore, constant monitoring is advised should you look to long from the 106.63 point.
Data points to consider today: No high-impacting events scheduled for release.
USD/CAD:
Weekly gain/loss: -0.87%
Weekly closing price: 1.2780
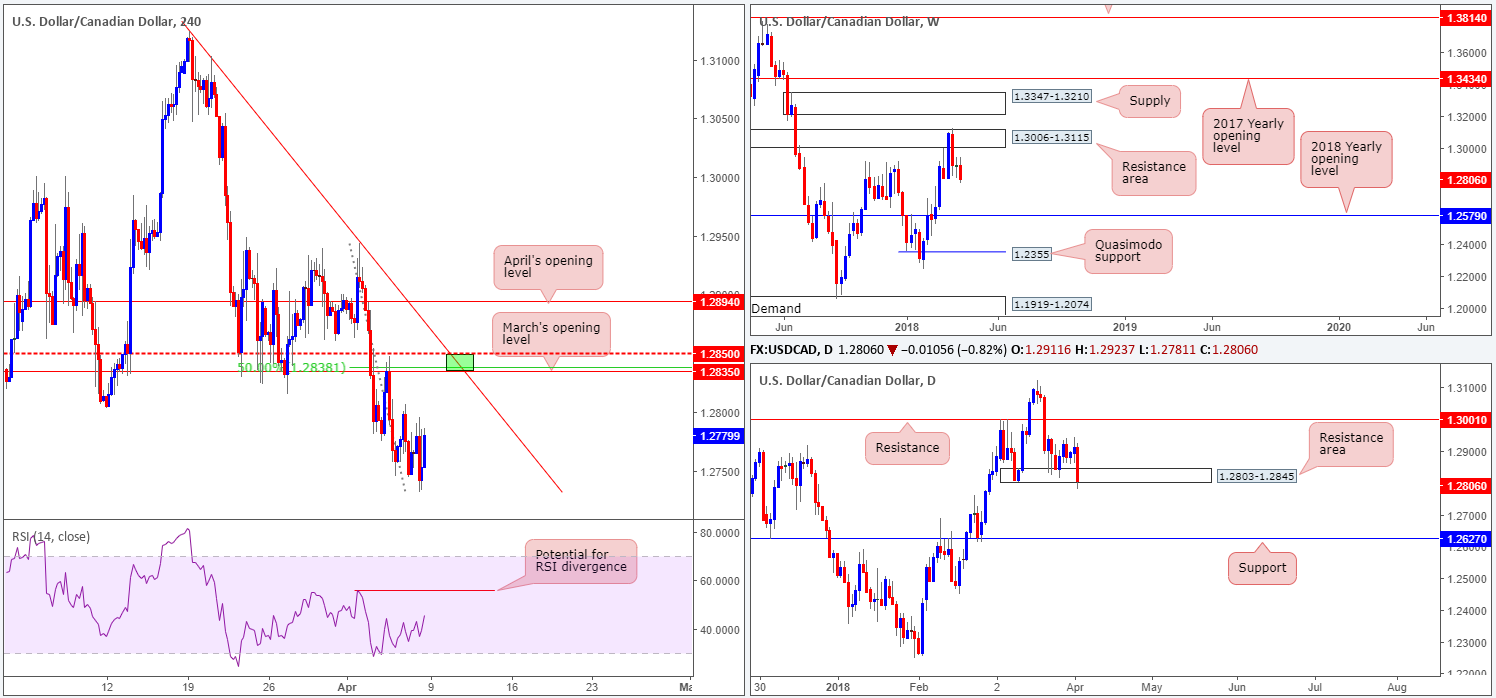
Over the course of last week’s movement, the US dollar erased almost 1% off its value against the Canadian dollar. Closing not too far off its lows, the weekly candle has positioned the 2018 yearly opening level at 1.2579 in the firing range.
In conjunction with weekly flow, we can see that recent action on the daily timeframe pierced through the lower edge of a daily demand area coming in at 1.2803-1.2845. Given the area held firm over the past couple of weeks, this likely instilled conviction and thereby led to traders positioning stops beneath the area on their longs. With these stop-loss orders now likely filled, downside is potentially free until we reach daily support marked at 1.2627.
Friday’s Canadian employment number surprised to the upside in March, rising by 32.3K jobs, while the Canadian unemployment rate remained unchanged. On the other side of the coin, the US economy created 103K jobs during March, missing consensus at 188K, while the US unemployment rate reported a slight increase at 4.1% vs. expected 4.0%. The impact of the two reports sent the USD/CAD immediately lower in strong fashion. However, the move was a relatively short-lived one as price bottomed just ahead of 1.2730 and reclaimed NFP-induced losses by the day’s end.
Potential trading zones:
March’s opening level seen on the H4 timeframe at 1.2835 is of interest (green area). Besides converging nicely with a 50.0% retracement value at 1.2838, a H4 mid-level resistance at 1.2850 and a nearby H4 trend line resistance taken from the high 1.3124, both weekly and daily charts portend further selling. In addition to this, should price connect with the highlighted H4 levels, we feel the H4 RSI will also show divergence in play.
In regard to take-profit targets, it is a little too early to judge since H4 price has yet to complete its approach.
Data points to consider today: BoC business outlook survey.
DOW 30:
Weekly gain/loss: -0.71%
Weekly closing price: 23932
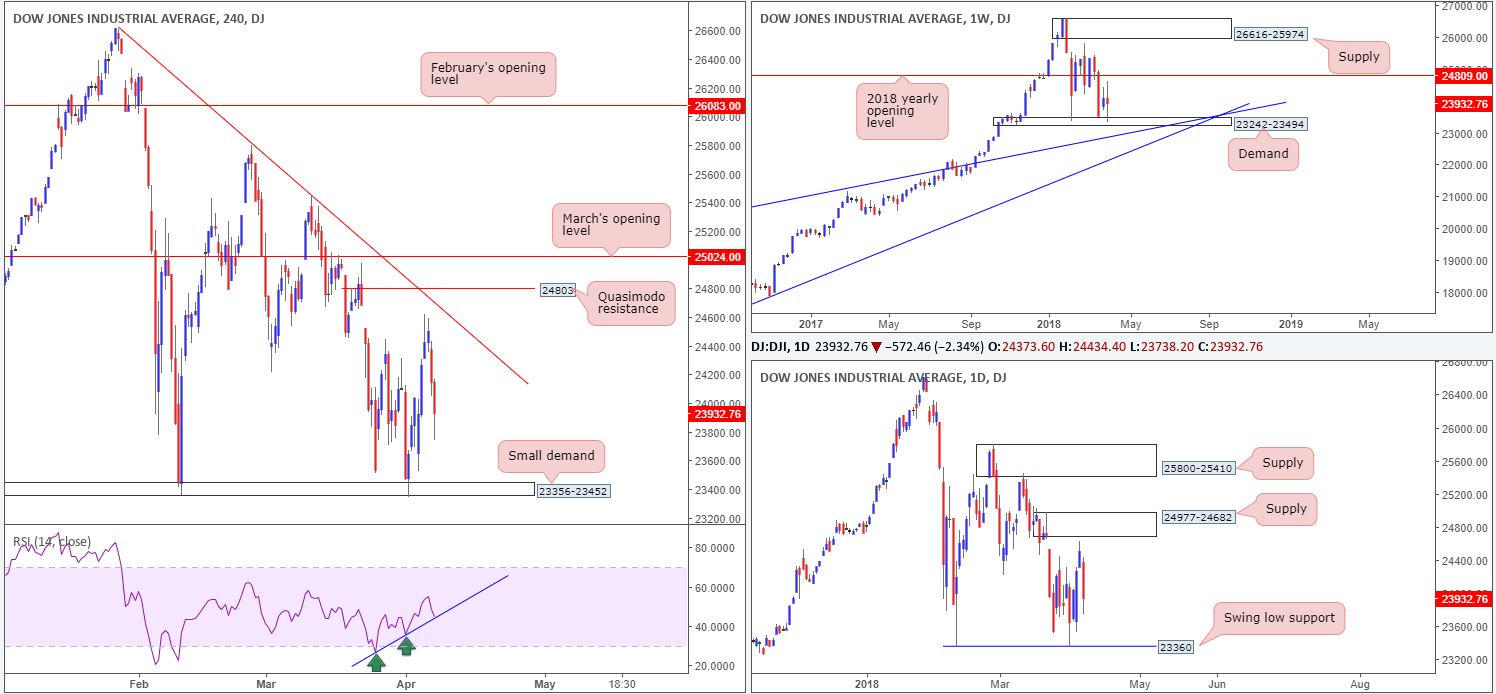
Although US equities ended the week in the red, the weekly timeframe displays a rather clear-cut weekly indecision candle that formed off a weekly demand area at 23242-23494. The next upside target from this angle can be seen in the form of a 2018 yearly opening level at 24809.
After coming within striking distance of a daily supply zone at 24977-24682 on Thursday, the index nose-dived lower amid Friday’s trade. This has, as you can see from the daily chart, re-positioned the unit and placed the daily swing low support at 23360 on the hit list.
Weighed down by resurfacing trade conflicts between China and the US, the H4 candles turned lower ahead of a H4 trend line resistance extended from the high 26608 in recent trade. Further denting sentiment was Friday’s lower-than-expected US job’s data. Similar to the daily chart, this has highlighted a H4 demand area at 23356-23452, which happens to house the noted daily swing low support. On the H4 RSI, a trend line support is also seen in play.
Potential trading zones:
The current H4 demand area is still likely a watched zone by many. Positioned within the aforementioned weekly demand and, as highlighted above, houses the noted daily swing low support, a long from this region could be a possibility. Though, to be on the safe side, we would strongly recommend placing stop-loss orders beneath the said weekly demand. This will give the trade room to breathe.
Data points to consider today: No high-impacting events scheduled for release.
GOLD:
Weekly gain/loss: +0.60%
Weekly closing price: 1333.4
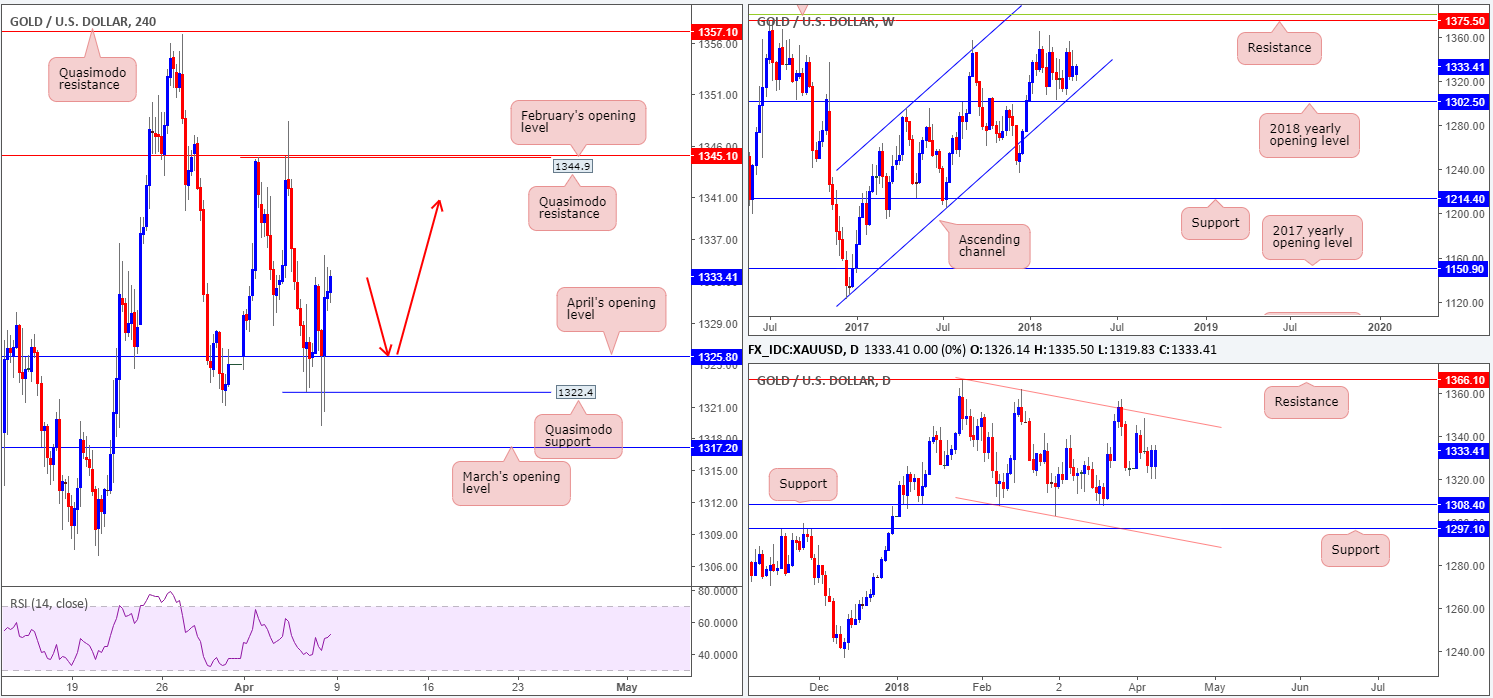
Since the beginning of the year, the price of gold has somewhat stagnated. Weekly price remains floating between the 2018 yearly opening level at 1302.5 (fuses closely with a long-term weekly channel support etched from the low 1122.8) and a weekly resistance pegged at 1375.5/38.2% weekly Fib resistance at 1381.0 (green line).
Looking down to the daily timeframe, we can see that bullion is currently compressed in a rather wide descending daily channel (1366.0/1307.2). Slotted inside this formation, however, is a daily support level plotted at 1308.4, with another layer of additional support seen not too far off at 1297.1.
H4 price, as you can see, moved higher in the immediate aftermath of Friday’s US job’s report. April’s opening level at 1325.8 is proving to be a valuable support in this market, despite suffering multiple downside attempts. Overhead, the next port of call can be seen at 1344.9: a H4 Quasimodo resistance level that’s shadowed closely by February’s opening level at 1345.1.
Potential trading zones:
With the higher timeframes not really offering much in terms of tradable structure, the only play we see right now is a retest off of April’s opening level (as per red arrows). From this point, we see little stopping the H4 candles from reaching the aforesaid H4 Quasimodo resistance level. However, for those looking to long 1325.8, you are reminded that there is a strong possibility that a fakeout of this level could occur, before turning higher. The H4 Quasimodo support plotted just beneath it at 1322.4 is, in our technical view, an ideal level to fake to!
This site has been designed for informational and educational purposes only and does not constitute an offer to sell nor a solicitation of an offer to buy any products which may be referenced upon the site. The services and information provided through this site are for personal, non-commercial, educational use and display. IC Markets does not provide personal trading advice through this site and does not represent that the products or services discussed are suitable for any trader. Traders are advised not to rely on any information contained in the site in the process of making a fully informed decision.
This site may include market analysis. All ideas, opinions, and/or forecasts, expressed or implied herein, information, charts or examples contained in the lessons, are for informational and educational purposes only and should not be construed as a recommendation to invest, trade, and/or speculate in the markets. Any trades, and/or speculations made in light of the ideas, opinions, and/or forecasts, expressed or implied herein, are committed at your own risk, financial or otherwise.
The use of the site is agreement that the site is for informational and educational purposes only and does not constitute advice in any form in the furtherance of any trade or trading decisions.
The accuracy, completeness and timeliness of the information contained on this site cannot be guaranteed. IC Markets does not warranty, guarantee or make any representations, or assume any liability with regard to financial results based on the use of the information in the site.
News, views, opinions, recommendations and other information obtained from sources outside of www.icmarkets.com.au, used in this site are believed to be reliable, but we cannot guarantee their accuracy or completeness. All such information is subject to change at any time without notice. IC Markets assumes no responsibility for the content of any linked site. The fact that such links may exist does not indicate approval or endorsement of any material contained on any linked site.
IC Markets is not liable for any harm caused by the transmission, through accessing the services or information on this site, of a computer virus, or other computer code or programming device that might be used to access, delete, damage, disable, disrupt or otherwise impede in any manner, the operation of the site or of any user’s software, hardware, data or property.


