
EUR/USD:
Weekly Gain/Loss: -0.72%
Weekly Close: 1.1519
Weekly perspective:
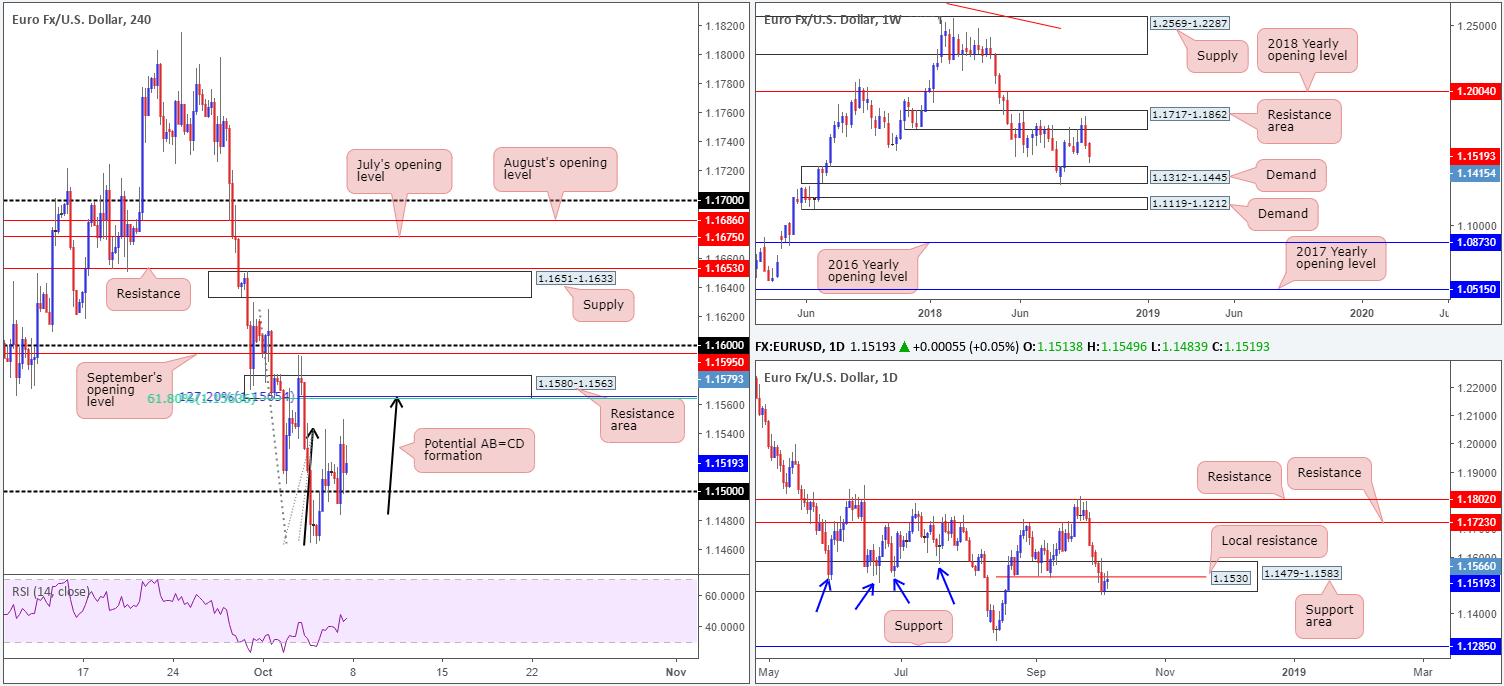
Deprived of notable support last week, on top of a clear-cut bearish engulfing formation out of a resistance area at 1.1717-1.1862 seen the week prior, the single currency explored lower ground. In the event the pair continues to drive lower this week, nearby demand rests at 1.1312-1.1445.
Daily perspective:
The support area at 1.1479-1.1583, although suffering a minor breach to its lower edge in the later stages of last week, remains in play. Thursday’s movement chalked up a reasonably strong bullish rotation candle, though Friday’s action formed a concerning indecision formation off local resistance circling the 1.1530 area.
A break of 1.1530 could send the unit as far north as resistance drawn from 1.1723, while a decisive break of 1.1479-1.1583 almost immediately places weekly traders within close proximity of its demand mentioned above at 1.1312-1.1445.
H4 perspective:
Friday’s non-farm payrolls rose 134k in September, below the expected 185k. Average hourly earnings came in line at 0.3%, while the unemployment rate fell slightly and came in at 3.7%, a tad below the 3.8% consensus. The aftermath of the US job’s numbers witnessed an immediate decline to lows of 1.1483. However, the move was a short-lived one as price swiftly recovered to highs of 1.1549: the session high for the day.
Having seen the H4 candles defend its 1.15 handle as support, the next resistance target falls in around 1.1580-1.1563: an area which happens to converge with a possible AB=CD (black arrows) 127.2% (Fib ext.) formation at 1.1565, and a 61.8% Fib resistance value at 1.1563.
Areas of consideration:
Longer term. Weekly price appears poised to connect with its nearby demand zone at 1.1312-1.1445. Buyers and sellers on the daily timeframe, on the other hand, are battling for position between the lower limits of its support area at 1.1479-1.1583 and a local resistance at 1.1530.
Intraday, however, has the H4 candles eyeing its resistance zone mentioned above at 1.1580-1.1563. In view of its surrounding confluence on the H4, and the fact weekly price is likely to probe as low as 1.1445 this week, a short from 1.1580-1.1563, with stops tucked above its range at 1.1582, could be an option today/early week.
Today’s data points: Limited data; US banks closed in observance of Columbus Day.
GBP/USD:
Weekly Gain/Loss: +0.64%
Weekly Close: 1.3112
Weekly perspective:
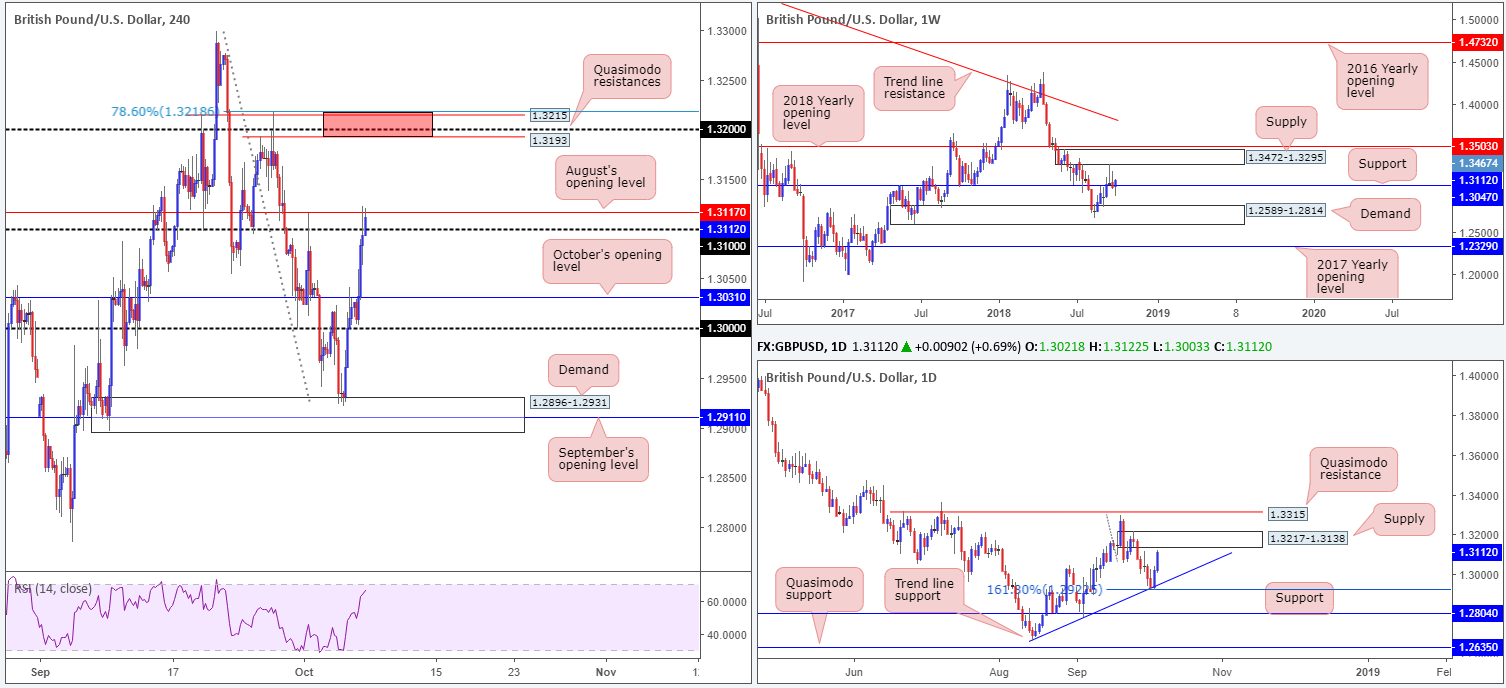
Rivalling the US dollar, the British pound concluded last week’s segment on a positive note. In the shape of a nice-looking bullish pin-bar formation that closed above resistance at 1.3047 (now acting support), the unit appears poised to continue pressing higher this week towards supply found at 1.3472-1.3295.
Daily perspective:
The AB=CD termination point at 1.2927: its 161.8% Fib ext. (also labelled an alternate AB=CD pattern as per Scott Carney), along with an intersecting trend line support (extended from the low 1.2661), responded beautifully last week. Despite this impressive run to the upside, traders might want to pencil in possible supply emerging from 1.3217-1.3138. This base, according to this scale, is likely the last line of supply stopping weekly price from reaching its supply mentioned above at 1.3472-1.3295. Therefore, this is a key area to keep eyes on this week.
H4 perspective:
Mixed US job’s data, along with reports a Brexit deal could be close, lifted the GBP higher against its US counterpart on Friday. October’s opening level at 1.3031 was abruptly taken out, leaving the pair free to challenge its 1.31 handle – and challenge it did! Entering the later stages of US trade, the unit tripped stops beyond 1.31 and tested August’s opening level nearby at 1.3117.
According to the higher-timeframe structure, it’s likely the market will observe a push beyond August’s opening level this week towards the red zone marked at 1.3218-1.3193.
Areas of consideration:
Although the red H4 zone at 1.3218-1.3193 is positioned in the market before the weekly supply at 1.3472-1.3295 enters the fight (the next upside target on the weekly scale), 1.3218-1.3193 is still highly likely to produce a bounce lower due to the following converging tools that make up the base:
- 78.6% H4 Fib resistance value at 1.3218.
- H4 Quasimodo resistance at 1.3215.
- 1.32 handle.
- H4 Quasimodo resistance at 1.3193.
- Located within the upper limits of daily supply at 1.3217-1.3138.
A H4 bearish candlestick formation printed from the red H4 zone, therefore, is considered a reasonably strong sell signal this week, with an initial downside target resting at 1.3117: August’s opening line.
Today’s data points: Limited data; US banks closed in observance of Columbus Day.
AUD/USD:
Weekly Gain/Loss: -2.41%
Weekly Close: 0.7048
Weekly perspective:
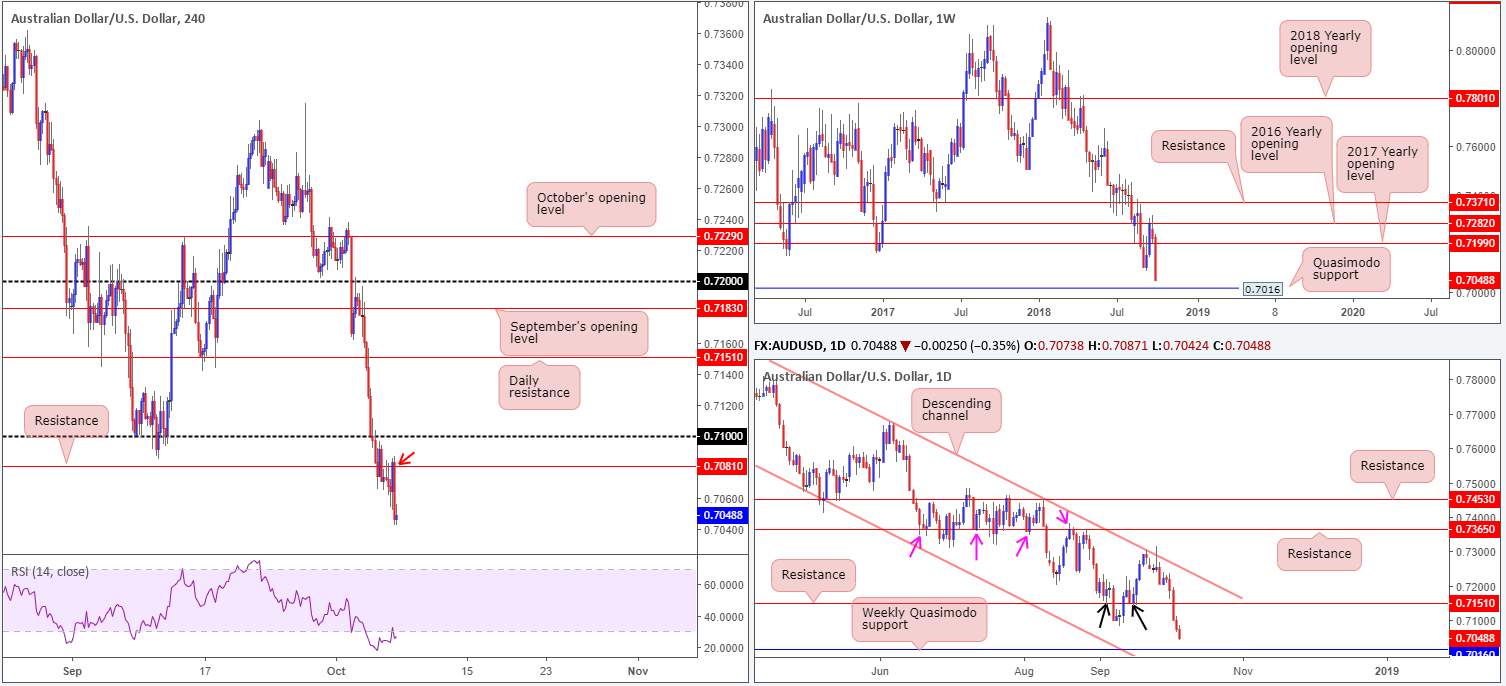
Another miserable week for the Australian dollar, down nearly 200 pips!
By way of a near-full-bodied bearish candle, the market ended the week closing within shouting distance of a Quasimodo support at 0.7016. In the event this level fails to offer a platform for buyers this week, another layer of Quasimodo support is positioned nearby at 0.6907 (not seen on the screen).
Daily perspective:
In terms of where the market stands on the daily scale at the moment, we do not really have much to add as the next downside target also resides around the weekly Quasimodo support mentioned above at 0.7016.
H4 perspective:
Friday’s action witnessed a knee-jerk reaction to lows of 0.7052 (levels not seen since Feb 2016) to the US employment report. Although the pair swiftly recovered immediate losses, resistance at 0.7081 held ground and forced price action to lower levels into the close. Well done to those who managed to jump aboard this move out of 0.7081. This was a noted level to watch for possible shorting opportunities in Friday’s briefing.
Areas of consideration:
Seeing as both weekly and daily charts indicate further downside this week, Friday’s strong H4 bearish engulfing formation (red arrow) printed off H4 resistance at 0.7081 is likely enough to draw in sellers and push towards 0.7016: the weekly Quasimodo support level.
The only problem here is risk/reward. An entry at current price: 0.7048 and a stop-loss order placed above the H4 bearish engulfing candle’s wick at 0.7089 is 41 pips. The first target falls in at 0.7016: 32 pips distance. This is rather poor in terms of risk/reward management. Therefore, should price pull higher in the early stages of today, bringing risk/reward higher than 1:1 (though not above the H4 bearish engulfing range), a short is then considered on the table.
Today’s data points: Limited data; US banks closed in observance of Columbus Day.
USD/JPY:
Weekly Gain/Loss: +0.03%
Weekly Close: 113.70
Weekly perspective:
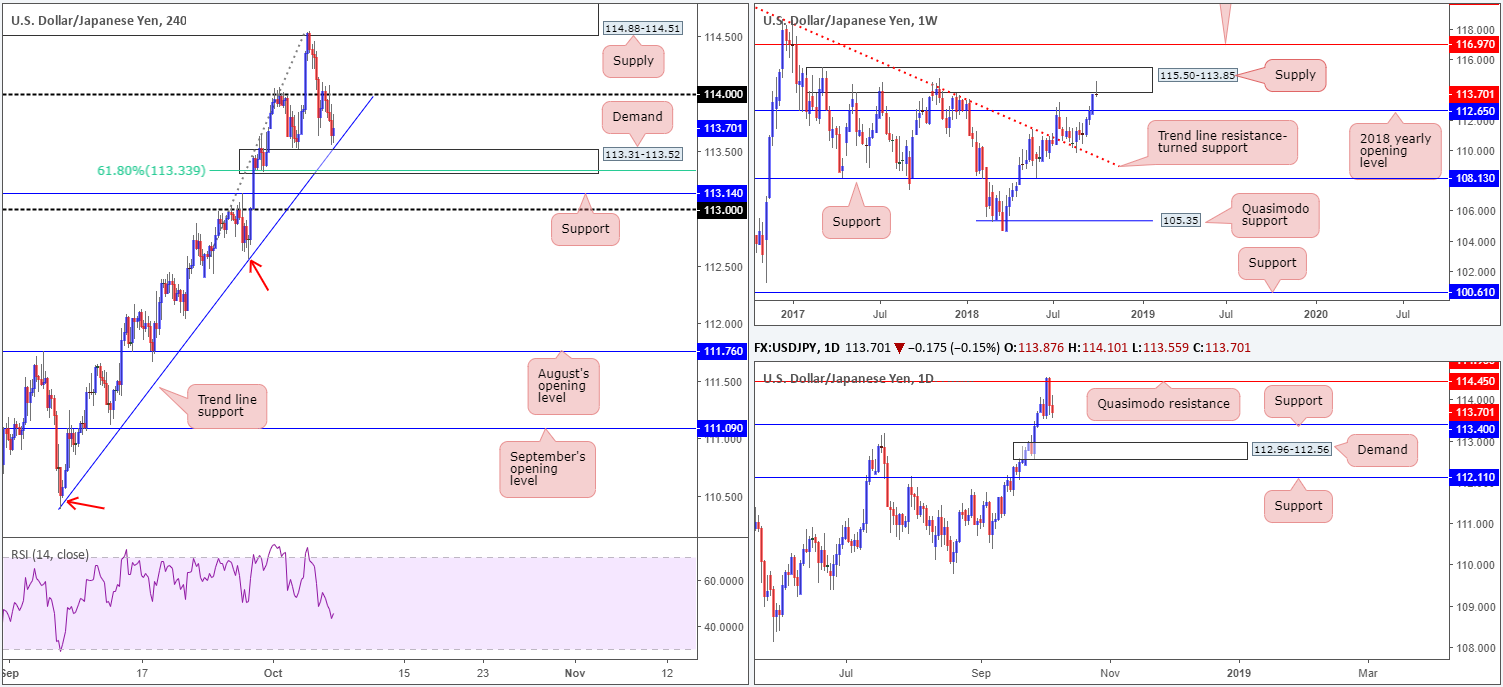
In form of a bearish pin-bar pattern, the market engaged with a notable supply at 115.50-113.85 last week (boasts notable history, capping upside on a number of occasions throughout 2017). For candlestick enthusiasts, this is likely considered a strong sell signal with an initial downside target printed at the 2018 yearly opening level drawn from 112.65.
Daily perspective:
Supporting downside, we can clearly see daily flow recently faded a Quasimodo resistance at 114.45, though traders might want to pencil in nearby support at 113.40. A failure of this level will bring attention to demand coming in at 112.96-112.56, which happens to house the 2018 yearly opening level at 112.65 highlighted on the weekly scale.
H4 perspective:
The impact of Friday’s non-farm payrolls report threw the USD/JPY beyond its 114 handle, though price action swiftly reclaimed gains and resumed its downside path.
From a technical perspective, the unit is seen trading a stone’s throw away from demand placed at 113.31-113.52. It might be worth noting this area houses the daily support level mentioned above at 113.40, a 61.8% H4 Fib support value at 113.34 and also converges closely with a H4 trend line support (extended from the low 110.38). A violation of this area will force the pair immediately in range to test support at 113.14, shadowed closely by the 113 handle.
Areas of consideration:
Considering only the H4 scale for a moment, most traders would agree the current H4 demand holds reasonably attractive confluence that’s likely to produce at least a bounce higher – even more so given the converging daily support level. Nevertheless, trading long from here entails buying into potential weekly selling out of a mammoth supply zone!
Although it is never pleasant buying (or selling) against higher-timeframe flow, a long from the current H4 demand is not out of the question. Should the market witness a H4 (or H1) bullish candlestick formation emerge from here, a long targeting the underside of 114 as an initial take-profit zone is an option. Stop/entry parameters, for the majority of traders, are likely to be dictated by the candlestick configuration. Traders are, however, urged to consider risk/reward before pulling the trigger!
Today’s data points: Limited data; US banks closed in observance of Columbus Day; Japanese banks closed in observance of Health-Sports Day.
USD/CAD:
Weekly Gain/Loss: +0.24%
Weekly Close: 1.2938
Weekly perspective:
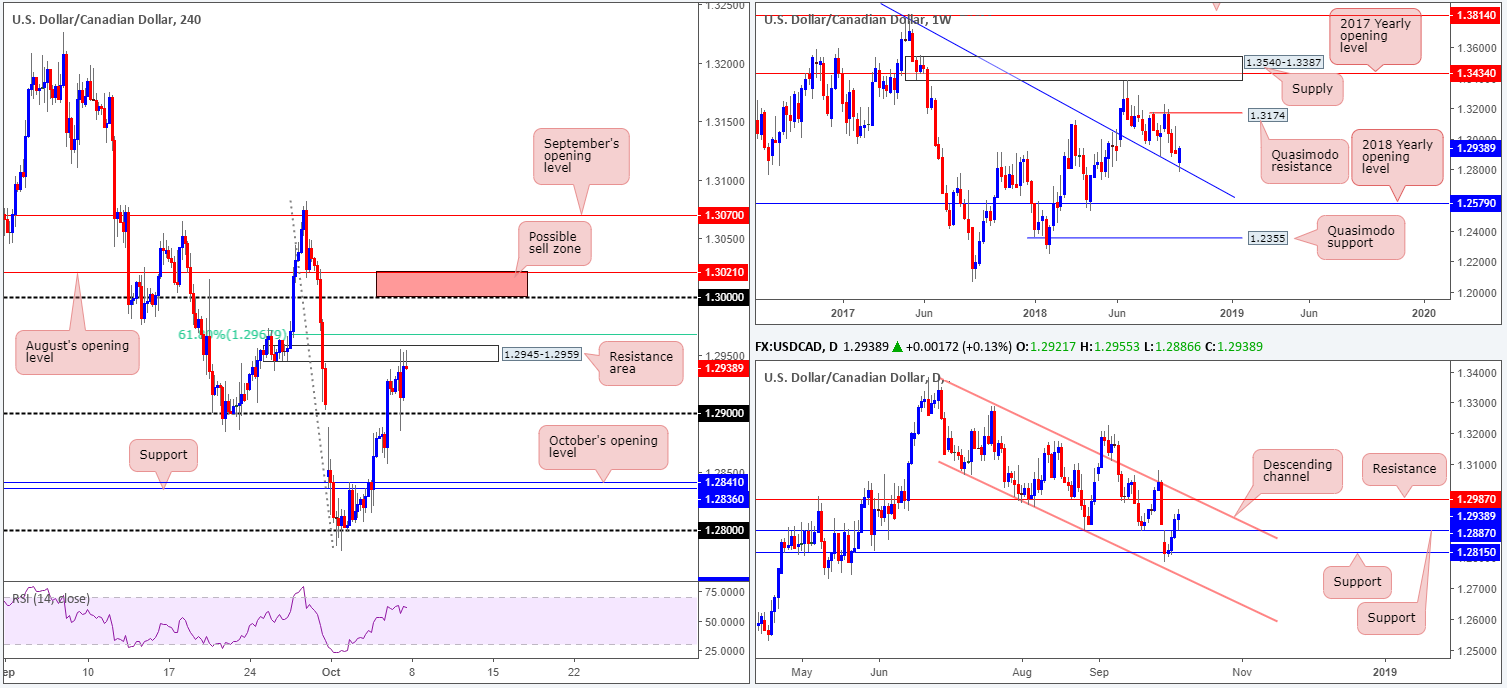
Having seen the market respond to the trend line resistance-turned support (extended from the high 1.4689) back in late August, and also act as firm resistance from its peak on a number of occasions in the past, it should not come as much of a surprise to see the line hold firm last week. The next upside target to be aware of, assuming further upside is seen, falls in around a Quasimodo resistance level parked at 1.3174.
Daily perspective:
Resistance at 1.2887 was engulfed on Thursday and retested as support on Friday in reasonably strong fashion, potentially setting the stage for further upside towards channel resistance (taken from the high 1.3386). The other key thing to note here is the converging resistance level priced in at 1.2987.
H4 perspective:
Side-by-side Canadian and US employment reports produced a violent M30 indecision candle on Friday, though managed to remain bid above its 1.29 handle. The session wrapped up with H4 price testing a nearby resistance area at 1.2945-1.2959 (sited just south of a 61.8% Fib resistance at 1.2967) in the shape of a bearish pin-bar formation. A break beyond these areas may call for a move towards the key figure 1.30, though do bear in mind before reaching this neighborhood, daily resistance at 1.2987 and its converging channel resistance will have to be tackled beforehand.
Areas of consideration:
While we do have a H4 bearish pin-bar pattern emerging out of a H4 resistance area at the moment, which could drag price action towards its 1.29 handle, selling this is tricky given both weekly and daily action portend a move north.
With the above in mind, the red zone on the H4 timeframe at 1.3021/1.30 (comprised of August’s opening level and a round number) is of interest this week. Positioned close by the noted daily resistances, a short from here is a possibility.
Nevertheless, it is recommended to wait and see if H4 price prints a bearish candlestick formation out of the aforementioned sell zone before pulling the trigger, since entering short here effectively places one against weekly flow which, as highlighted above, currently shows room to climb as far north as 1.3174.
Today’s data points: Limited data; US banks closed in observance of Columbus Day; Canadian banks closed in observance of Thanksgiving Day.
USD/CHF:
Weekly Gain/Loss: +1.03%
Weekly Close: 0.9917
Weekly perspective:
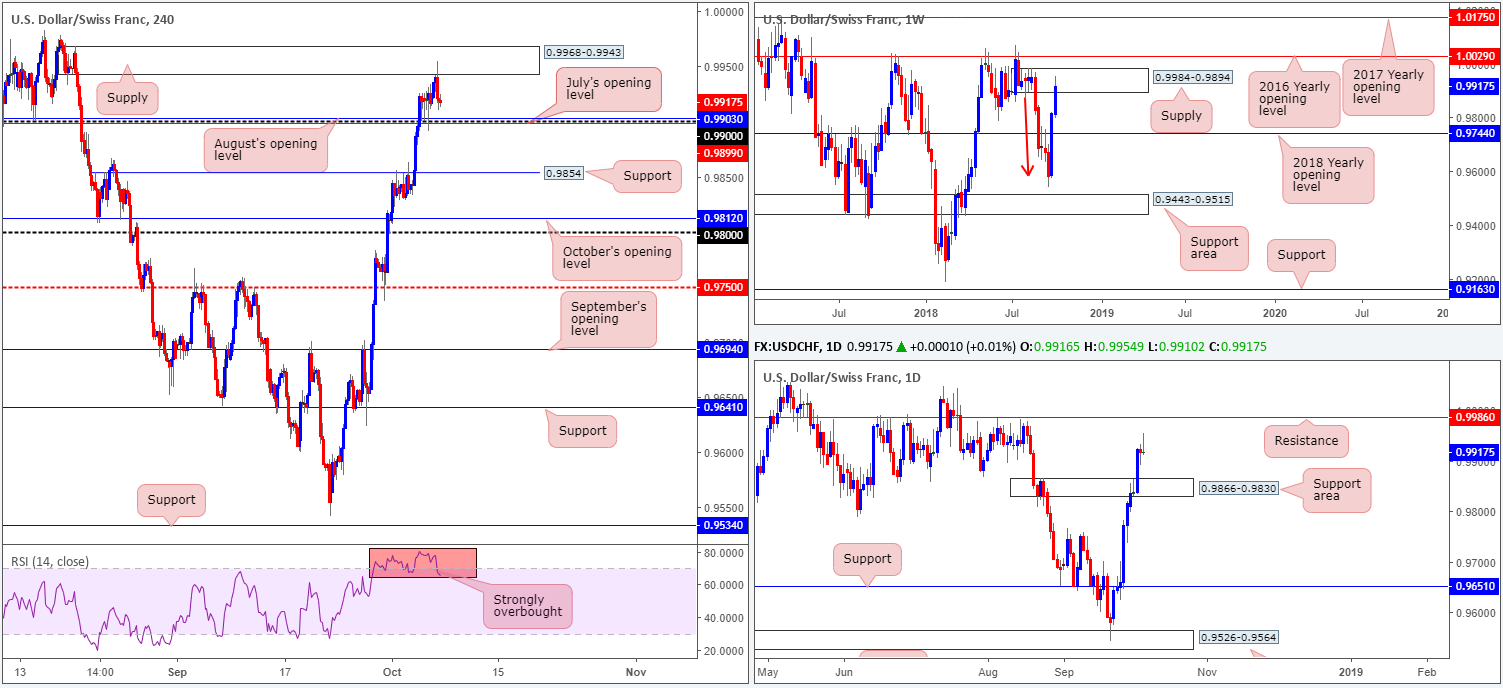
After successfully overthrowing its 2018 yearly opening level at 0.9744, USD/CHF bulls went on the offensive for a second consecutive week and brought the unit strongly into supply territory at 0.9984-0.9894. Although In terms of structure this area boasts solid momentum out of its base (red arrow), traders may want to pencil in the 2016 yearly opening level at 1.0029 in the event we push for higher ground this week.
Daily perspective:
A closer look at price action on the daily timeframe shows the week ended forming a bearish pin-bar pattern. While we know this formation has taken shape within the aforementioned weekly supply, on the daily scale room to move north is seen towards resistance coming in at 0.9986 (sited two pips above the weekly supply). Should the pair push lower this week, the first area of concern can be seen at a support area carved from 0.9866-0.9830.
H4 perspective:
A quick recap of Friday’s sessions on the H4 scale brings supply at 0.9968-0.9943 into the picture. After advancing to its highest level since August 20 at 0.9955, the USD/CHF altered direction and fell towards its 0.99 handle as the greenback struggled to preserve its upside presence following the US job’s report. Traders might want to acknowledge 0.99 is shadowed closely by two monthly opening levels from August and July at 0.9903 and 0.9899, respectively. Also worth noting is the RSI indicating an overbought reading.
Areas of consideration:
Regardless of the fact daily price could advance to test its resistance level at 0.9986, H4 and weekly price are both seen selling off from supply. Couple this with Friday’s daily bearish pin-bar pattern, and we potentially have ourselves some strong sellers in the mix.
A H4 close beneath 0.99 is considered a bearish cue, given the overall picture. A retest of this number in the shape of a bearish candlestick formation would likely be enough to encourage sellers into the market. The only grumble here is limited space to maneuver. Close at hand, we have the top edge of a daily support area at 0.9866, followed closely by H4 support at 0.9854. Beyond here, the team would be eyeing October’s opening level at 0.9812, followed closely by the 0.98 mark as the next support targets.
Traders are urged to consider risk/reward parameters before pulling the trigger to short beneath 0.99. If you’re unable to lock in at least 1:1 to the first take-profit zone (0.9866), it may be best to pass and wait for something a little more substantial to come along.
Today’s data points: Limited data; US banks closed in observance of Columbus Day.
Dow Jones Industrial Average:
Weekly Gain/Loss: -0.02%
Weekly Close: 26474
Weekly perspective:
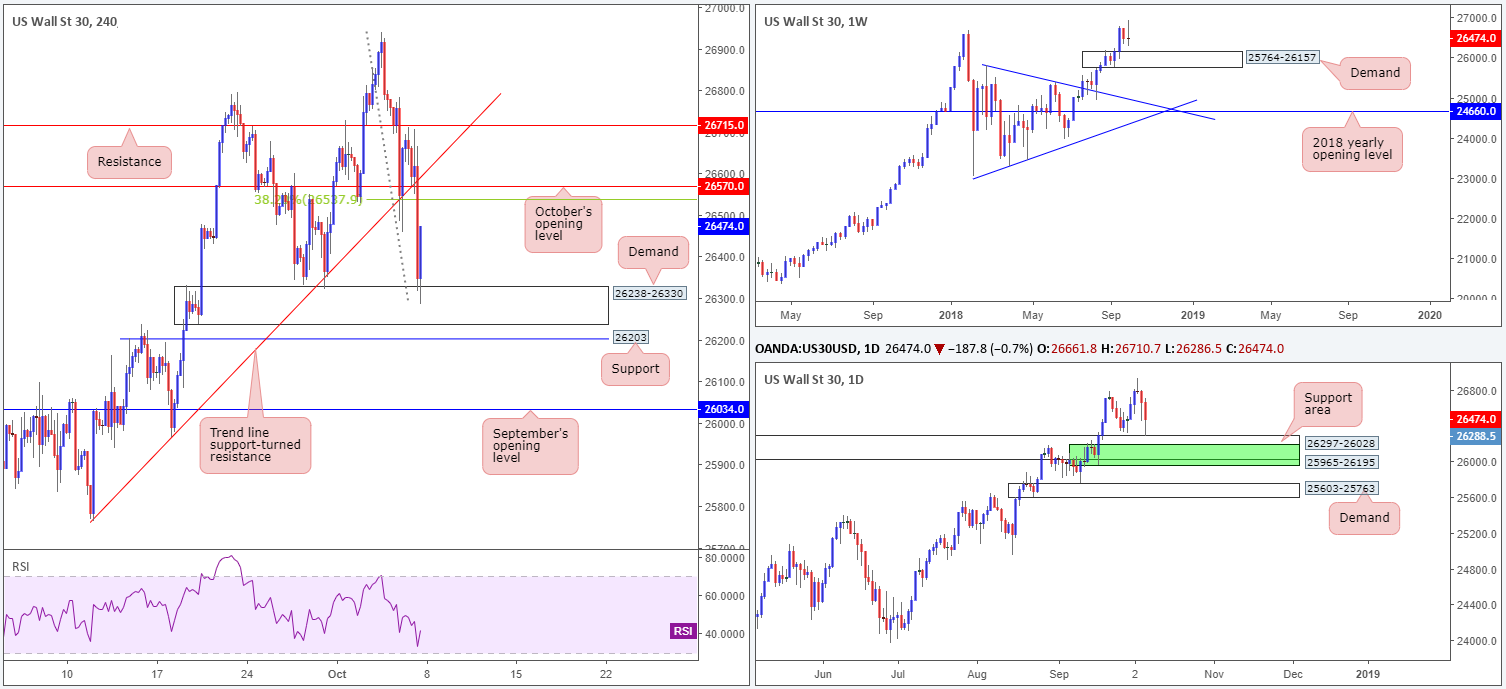
US equities continued to struggle to form a bullish position last week from recently set record peaks of 26790. As is evident from this timeframe, the index could, in theory, pullback as far south as demand printed at 25764-26157 before we witness buyers re-enter the fray.
Daily perspective:
Assessing daily structure in this market pulls traders’ attention towards a support area coming in at 26297-26028. Despite Friday’s rebound off the top edge of this base, the demand shaded in green at 25965-26195 (both zones happen to be glued around the top edge of the noted weekly demand) may also be an area worth penciling in as a possible platform for buyers this week. A break through these two areas would likely pull the index towards demand printed at 25603-25763 (essentially supports the lower edge of the noted weekly demand).
H4 perspective:
Friday’s US employment report failed to support price action. Weighed on heavily by a waning tech sector, the candles aggressively broke through October’s opening level at 26570 and tested demand at 26238-26330. Likely helped by the fact this area is seen glued to the top edge of the daily support area mentioned above at 26297-26028, this base held its ground and closed at highs of 26474.
Areas of consideration:
- October’s opening level at 26570. This level, given it converges closely with a 38.2% H4 Fib resistance at 26537 and a H4 trend line support-turned resistance (extended from the low 25764), may produce a bounce lower today/early week. However, do take into account there’s limited higher-timeframe confluence seen off here, so trade with caution.
- The H4 demand area at 26238-26330, bolstered by a daily support area at 26297-26028, is an area to watch for possible longs this week.
- The H4 support level seen at 26203 is also of interest, owing to it being positioned within the daily support area mentioned above at 26297-26028 and also located just north of the daily demand area at 25965-26195 (green).
Today’s data points: Limited data; US banks closed in observance of Columbus Day.
XAU/USD (Gold)
Weekly Gain/Loss: +1.08%
Weekly Close: 1203.2
Weekly perspective:
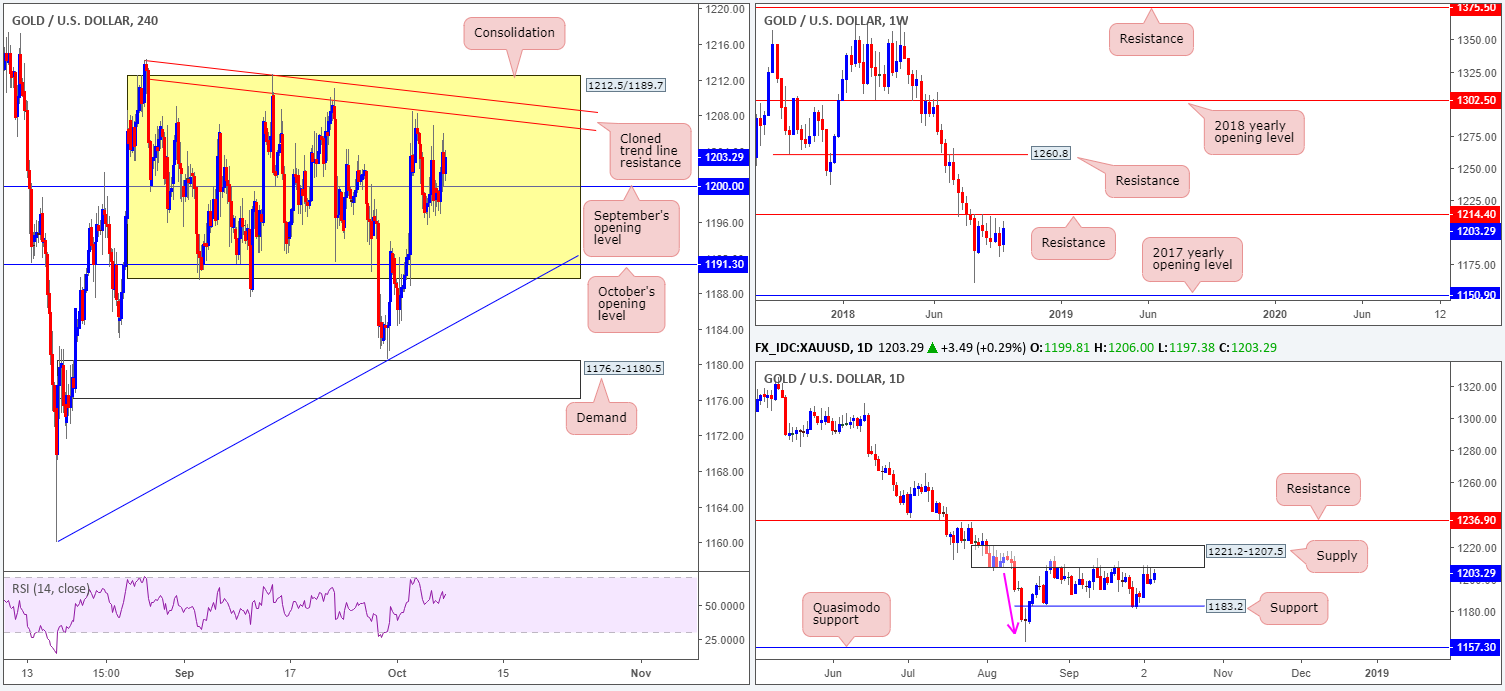
Although the price of gold rallied last week, the unit remains positioned beneath a key resistance level coming in at 1214.4. Because of this, downside from this point could still eventually stretch as far south as the 2017 yearly opening level at 1150.9.
Daily perspective:
In conjunction with weekly flow, daily movement continues to respect a nice-looking supply zone at 1221.2-1207.5. Aside from the base displaying attractive downside momentum (pink arrow), this area could also be considered the ‘decision point’ to print 2018 yearly lows of 1160.3. From current price, structure shows room to press as low as a support level priced in at 1183.2, followed by a Quasimodo support at 1157.3.
H4 perspective:
Since the later stages of August, the H4 candles (apart from a brief spell during late September) have been busy carving out quite a substantial consolidation between 1212.5/1189.7. Within this boundary, we can see September’s opening level at 1200.0, October’s opening level at 1191.3, a cloned trend line resistance (taken from the high 1214.3) and trend line support (extended from the low 1160.0).
Areas of consideration:
In light of where price is trading from on the higher timeframes, a long in this market will unlikely produce much to get excited about. You’re simply buying against higher-timeframe flow here.
Points of interest for shorts at current price are the cloned H4 trend line resistance and the top edge of the H4 range at 1212.5. Either barrier, according to the overall technical picture, is a high-probability short as long as it’s accompanied with additional candlestick confirmation, be it on the H4 or H1 timeframe. Stop/entry is dependent on which candlestick pattern is seen.
The use of the site is agreement that the site is for informational and educational purposes only and does not constitute advice in any form in the furtherance of any trade or trading decisions.
The accuracy, completeness and timeliness of the information contained on this site cannot be guaranteed. IC Markets does not warranty, guarantee or make any representations, or assume any liability with regard to financial results based on the use of the information in the site.
News, views, opinions, recommendations and other information obtained from sources outside of www.icmarkets.com.au, used in this site are believed to be reliable, but we cannot guarantee their accuracy or completeness. All such information is subject to change at any time without notice. IC Markets assumes no responsibility for the content of any linked site. The fact that such links may exist does not indicate approval or endorsement of any material contained on any linked site.
IC Markets is not liable for any harm caused by the transmission, through accessing the services or information on this site, of a computer virus, or other computer code or programming device that might be used to access, delete, damage, disable, disrupt or otherwise impede in any manner, the operation of the site or of any user’s software, hardware, data or property.


