
A note on lower timeframe confirming price action…
Waiting for lower timeframe confirmation is our main tool to confirm strength within higher timeframe zones, and has really been the key to our trading success. It takes a little time to understand the subtle nuances, however, as each trade is never the same, but once you master the rhythm so to speak, you will be saved from countless unnecessary losing trades. The following is a list of what we look for:
- A break/retest of supply or demand dependent on which way you’re trading.
- A trendline break/retest.
- Buying/selling tails/wicks – essentially we look for a cluster of very obvious spikes off of lower timeframe support and resistance levels within the higher timeframe zone.
- Candlestick patterns. We tend to only stick with pin bars and engulfing bars as these have proven to be the most effective.
We search for lower timeframe confirmation between the M15 and H1 timeframes, since most of our higher-timeframe areas begin with the H4. Stops are usually placed 5-10 pips beyond confirming structures.
EUR/USD:
Weekly gain/loss: – 84 pips
Weekly closing price: 1.1083
Weekly open price: 1.1076
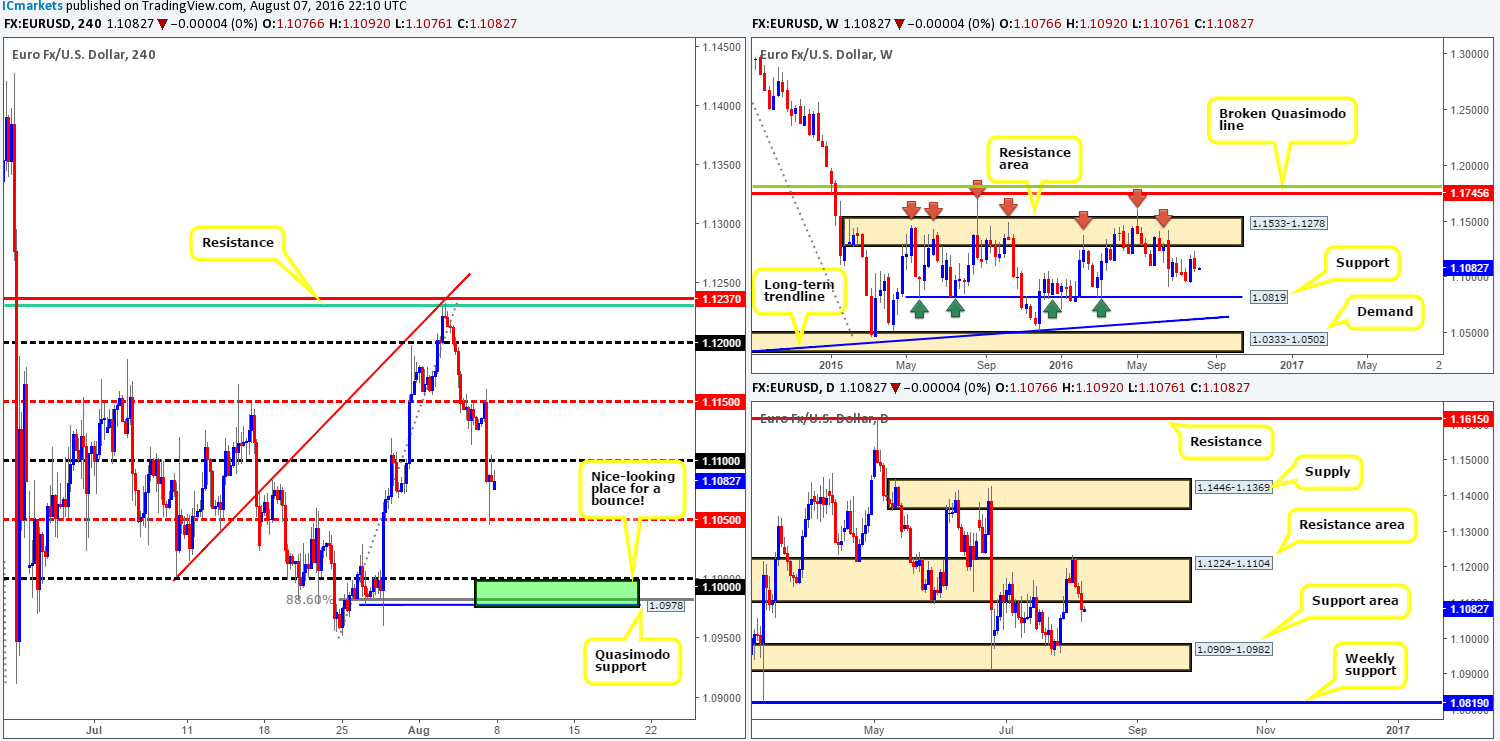
Weekly view: From the weekly chart, we can see that the single currency rotated to the downside last week just ahead of a major weekly resistance area drawn from 1.1533-1.1278. Providing that sellers remain in the driving seat this week, the next downside target can be seen at 1.0819 – a major weekly support level.
Daily view: Following Tuesday’s spike above the daily resistance area penciled in at 1.1224-1.1104, the EUR changed tracks and entered into a three-day sell off, clocking lows of 1.1045 by the week’s end. To the downside, the next areas to keep an eye on from here are the daily support area formed by 1.0909-1.0982, followed closely by the above said weekly support level.
H4 view: A quick recap of Friday’s trade on the H4 shows that price fell sharply after retesting the H4 mid-way resistance line at 1.1150, on the back of better than expected US employment data. The 1.11 handle was taken out, and later retested as resistance after a bounce was seen from the H4 mid-way support level 1.1050.
Direction for the week: In view of the higher-timeframe structure, further downside is likely on the cards, at least until the daily support area mentioned above at 1.0909-1.0982.
Direction for today: Assuming offers hold ground around the 1.11 mark today, there’s likely to be a push down to 1.1050. While price could bounce from this line, we feel the pressure from the above noted higher-timeframe structures will push the EUR pair down to the key figure 1.10. Granted, this may not come into view today though as Monday’s are notoriously slow movers!
1.10 coupled with a nearby H4 Quasimodo support level at 1.0978 and a supporting 88.6% H4 Fib level at 1.0983 is also a nice place (green zone) to look for a bounce north today/this week. The reason being is that it sits around the top edge of the aforementioned daily support area (the next downside target on the daily timeframe).
Our suggestions: If 1.11 is retested for a second time, a sell (preferably with lower timeframe confirmation – see the top of this report) down to 1.1050, followed by 1.10 is something to consider.
Should price reach the 1.10 figure today/this week, our team would, dependent on the H4 approach and time of day, look to take a long position from this area with our stops planted below the H4 Quasimodo low (1.0960) at 1.0958.
Levels to watch/live orders:
- Buys: 1.0978/1.10 [Dependent on the time of day and approach to the zone, a market order from here is a possibility] (Stop loss: 1.0958).
- Sells: 1.11 region [Tentative – confirmation required] (Stop loss: dependent on where one confirms this area).
GBP/USD:
Weekly gain/loss: -159 pips
Weekly closing price: 1.3063
Weekly open price: 1.3075
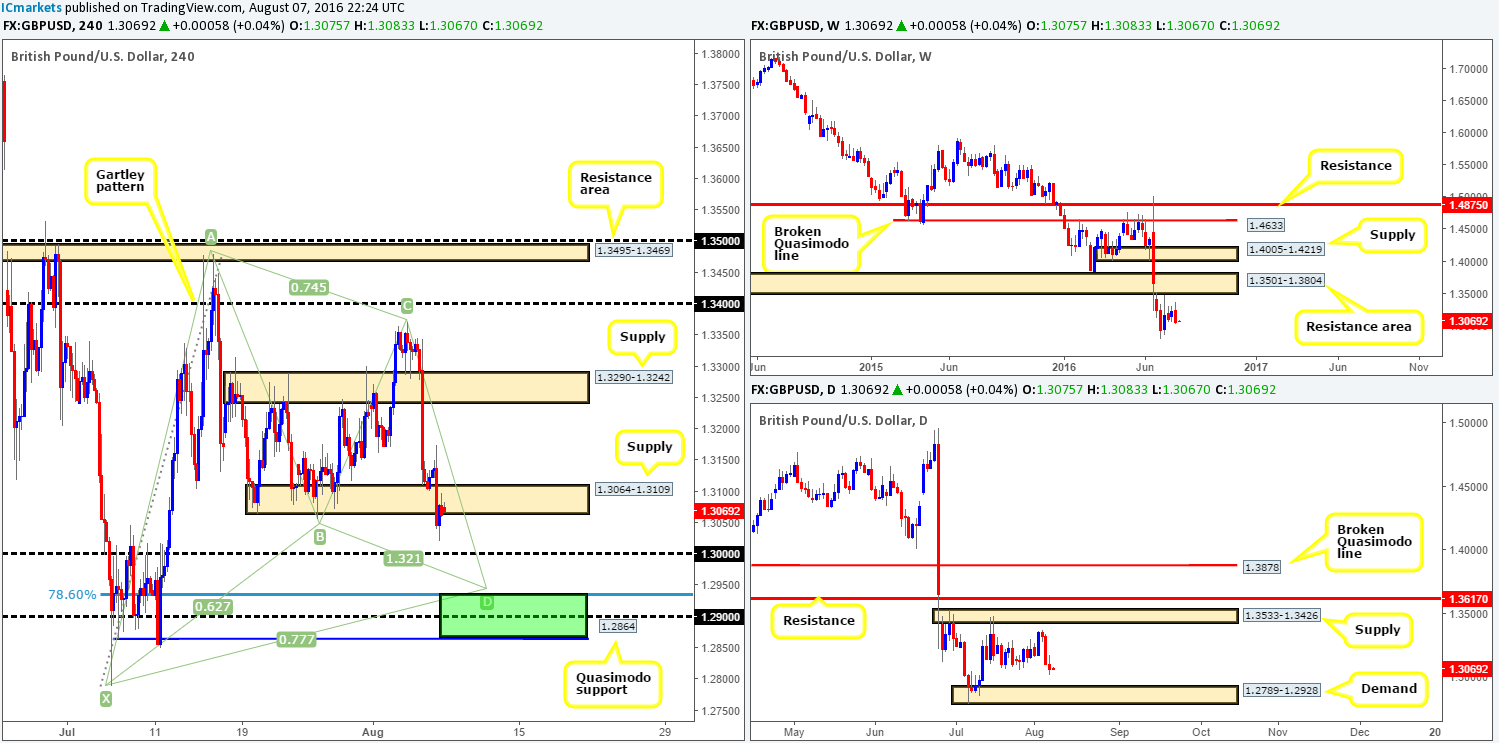
Weekly view: As can be seen from the weekly chart, the recently closed weekly candle chalked up a relatively strong-looking bearish engulfing formation, which has smothered two prior weekly candles! By and of itself, this could suggest that cable may plunge lower this week. As far as weekly structure is concerned, however, we can see that there’s a weekly resistance area seen at 1.3501-1.3804, while to the downside there’s little support seen to the left of current price until the market reaches the 1.20 region.
Daily view: Looking down to the daily chart, the candles are currently seen loitering mid-range between a daily supply zone at 1.3533-1.3426 and a daily demand barrier at 1.2789-1.2928. With the trend predominantly pointing south, and considering the fact that the daily supply is glued to the underside of the aforementioned weekly resistance area, we hold the opinion that a break of the demand base is more likely to be seen.
H4 view: Stronger than expected US employment figures saw the GBP plummet against its US counterpart on Friday, forcing price to wipe out the H4 demand at 1.3064-1.3109 and reach lows of 1.3020, before a modest end-of-week correction took form.
Direction for the week: Initial action will more than likely continue to trade lower down to the aforementioned daily demand. From here we could either see an immediate bounce, a phase of consolidation or a decisive push lower.
Direction for today: In view of price ending the week retesting a H4 supply at 1.3064-1.3109, and higher-timeframe technicals suggesting that the unit may head lower, we feel a sell off from this boundary will take place. Be that as it may, taking a short position from here is difficult. Not only is there the 1.30 key figure to contend with, but a few pips below this there’s an awesome-looking H4 harmonic Gartley reversal zone fixed between 1.2864 (H4 Quasimodo support)/1.2934 (green zone).
Our suggestions: We would pass on looking to sell from the current H4 supply simply because of the 1.30 level. With this number likely being watched by a truckload of traders, it’s a risky trade in our book! The area we are interested in, nevertheless, is the above noted H4 harmonic Gartley reversal zone. This barrier is planted beautifully on top of the daily demand zone mentioned above and is highly likely to produce a bounce to the upside sometime this week. Aggressive traders may look to place stops around the 1.2844 region, while more conservative traders might look to place their stops below the X point of the harmonic formation at 1.2778.
Since this bullish pattern has formed within a bearish downtrend, we’d highly recommend waiting for lower timeframe confirmation to form before placing your capital on the line. This could be in the form of an engulf of supply followed by a subsequent retest, a trendline/break retest or simply a collection of well-defined buying tails seen around the harmonic reversal zone. This, in our opinion, will likely get you in at a better price and potentially avoid unnecessary drawdown.
Levels to watch/live orders:
- Buys: 1.2864/1.2934 [Tentative – confirmation required] (Stop loss: dependent on where one confirms this area).
- Sells: Flat (Stop loss: N/A).
AUD/USD:
Weekly gain/loss: + 20 pips
Weekly closing price: 0.7615
Weekly opening price: 0.7612
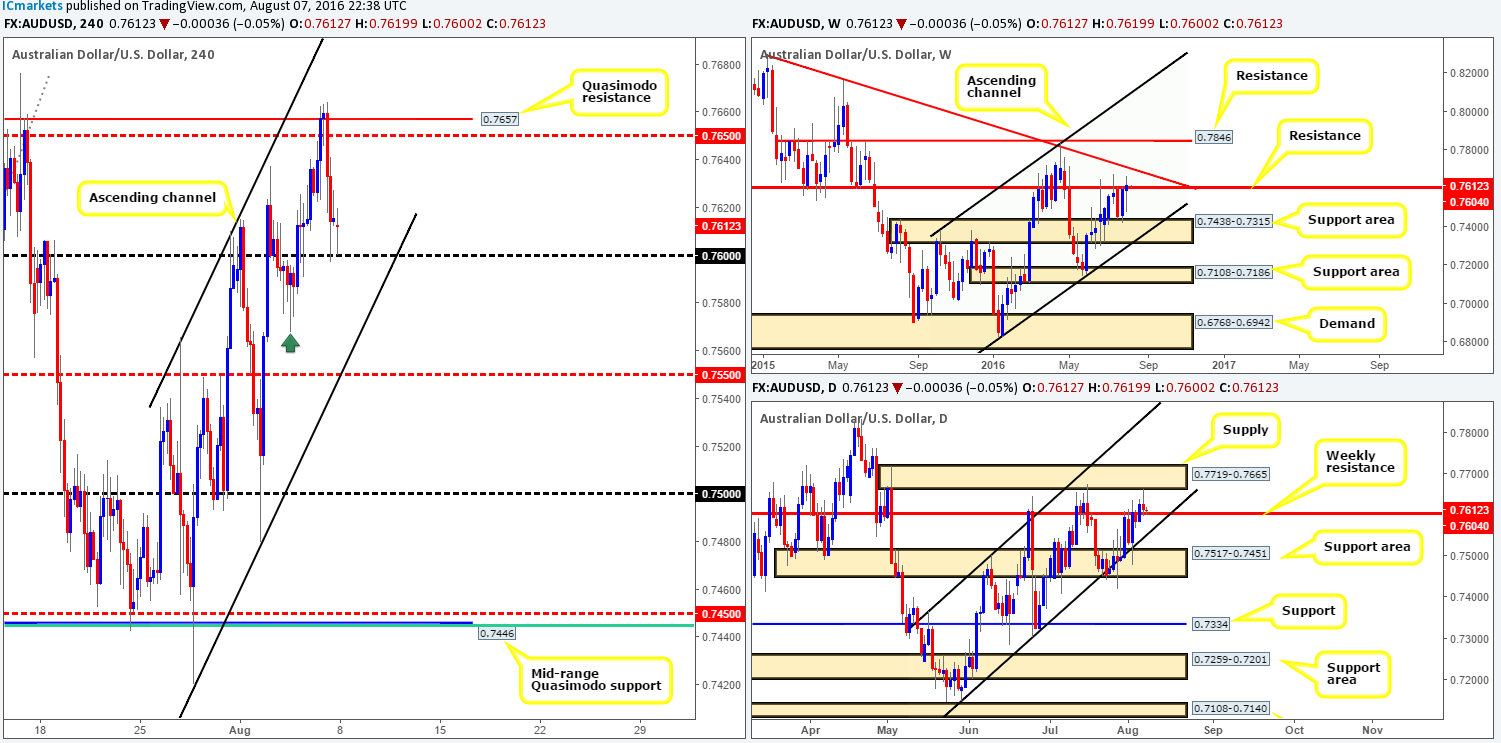
Weekly view: Despite last week’s action ranging close to 200 pips, the market ended the week closing just a mere twenty pips above the prior week’s close. Since the 20th June the Aussie has been capped by a weekly resistance level coming in at 0.7604. Yet, with last week’s candle closing slightly above this line, further upside could be on the cards this week towards the weekly trendline resistance extended from the high 0.8895.
Daily view: The story on the daily chart, nevertheless, shows that the unit shook hands with a daily supply zone drawn from 0.7719-0.7665. The response from this barrier was immediate and as a result formed a bearish selling wick going into the week’s end.
H4 view: Over on the H4 chart, it’s clear to see that the US dollar benefited greatly from a hotter than expected US jobs report on Friday. Bids continued to support the dollar until the commodity currency connected with a pocket of bids around the 0.76 handle, which consequently helped trim some of the day’s losses.
Direction for the week: Judging medium-term direction is challenging to say the least! On the one hand, weekly action indicates further upside could be seen, but with a weekly trendline resistance lurking nearby, we’d be cautious taking longs other than for an intraday bounce. On the other hand, daily sellers from the current daily supply could force this market back below the weekly resistance level this week. But, with a daily channel support line extended from the 0.7148 positioned close by, we’d be wary of selling this market other than for a small intraday move.
Direction for today: Following Friday’s mediocre response from 0.76, there’s a possibility that price may drive lower to test Wednesday’s low 0.7568 (green arrow), which if one extends a horizontal line to the right would likely fuse with the H4 channel support line taken from the low 0.7420. As such, a bounce from the boundary could be something to keep an eye on today.
Our suggestions: Other than the above direction for the day, we see very little else worth discussing considering how cramped the higher-timeframe structures are at present. With that in mind, we’ll remain on the sidelines and wait for more conducive price action to present itself.
Levels to watch/live orders:
- Buys: Flat (Stop loss: N/A).
- Sells: Flat (Stop loss: N/A).
USD/JPY:
Weekly gain/loss: – 22 pips
Weekly closing price: 101.79
Weekly opening price: 101.97
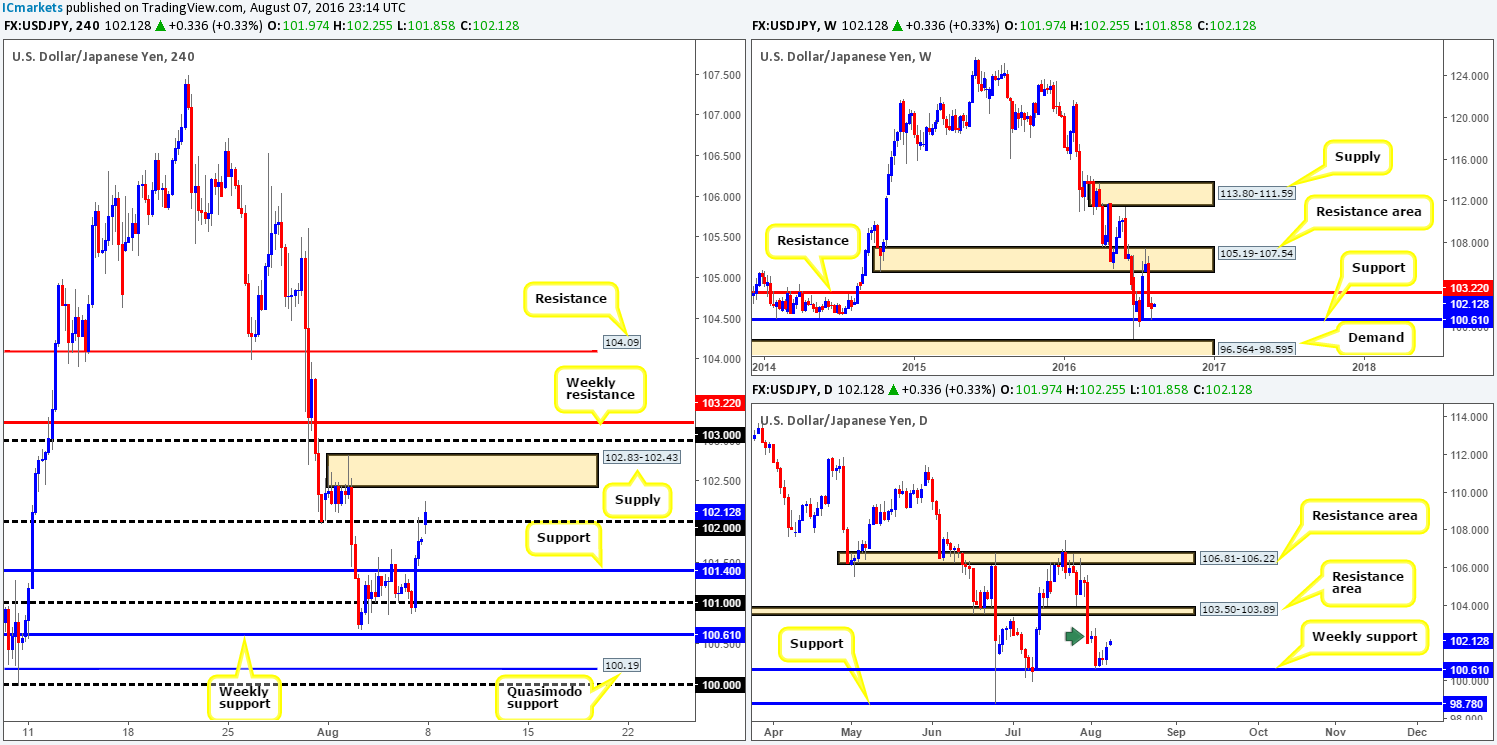
Weekly view: After a rather aggressive move to the downside two weeks back, the USD/JPY came within striking distance of connecting with a major weekly support level drawn from 100.61 last week. This saw price slam on the brakes and reverse direction, resulting in the week’s action closing relatively unchanged. From a structural point of view, the pair is now seen trading mid-range between the aforementioned weekly support line and a weekly resistance hurdle logged in at 103.22.
Daily view: The bounce from the above said weekly support region has recently seen price cross paths with a minor daily supply area 102.83-101.97 (green arrow). Why we consider this area to be minor is simply because it broke very little structure to the left, and took shape just ahead of a major weekly support line! Therefore, there’s a good chance that this zone will be engulfed and price will likely head higher to shake hands with the daily resistance area coming in at 103.50-103.89 (sits just above the aforementioned weekly resistance line).
H4 view: The aftermath of Friday’s job’s report lifted the US dollar to fresh highs, allowing trade to hook up with the 102 handle going into the close. This morning’s eighteen-pip gap north, however, has, as you can see, pushed the unit above 102, and now looks all set to extend up to H4 supply given at 102.83-102.43 (lodged within the extremes of the above said minor daily supply).
Direction for the week: is likely to be north until price crosses swords with the weekly resistance line mentioned above at 103.22.
Direction for today: will also likely be north should a close above 102 take place. While we do expect some resistance to be seen from the current H4 supply zone at 102.83-102.43, the daily target for our team is between the above noted weekly resistance line and the 103 handle.
Our suggestions: One could look to attempt to trade any retest seen off the top edge of 102 this morning (alongside lower timeframe confirmation – see the top of this report), and look to ride it north. Nevertheless, as we mentioned above, do expect some opposition around the current H4 supply zone, before price reaches the 103.22/103.00 region, which by and of itself is also a notable sell zone to also have jotted down in your watchlists this week guys!
Levels to watch/live orders:
- Buys: Watch for price to close above the 102 handle and look to trade any retest seen thereafter (lower timeframe confirmation required)
- Sells: 103.22/103.22 [Tentative – confirmation required] (Stop loss: dependent on where one confirms this area).
USD/CAD:
Weekly gain/loss: + 124 pips
Weekly closing price: 1.3164
Weekly opening price: 1.3175
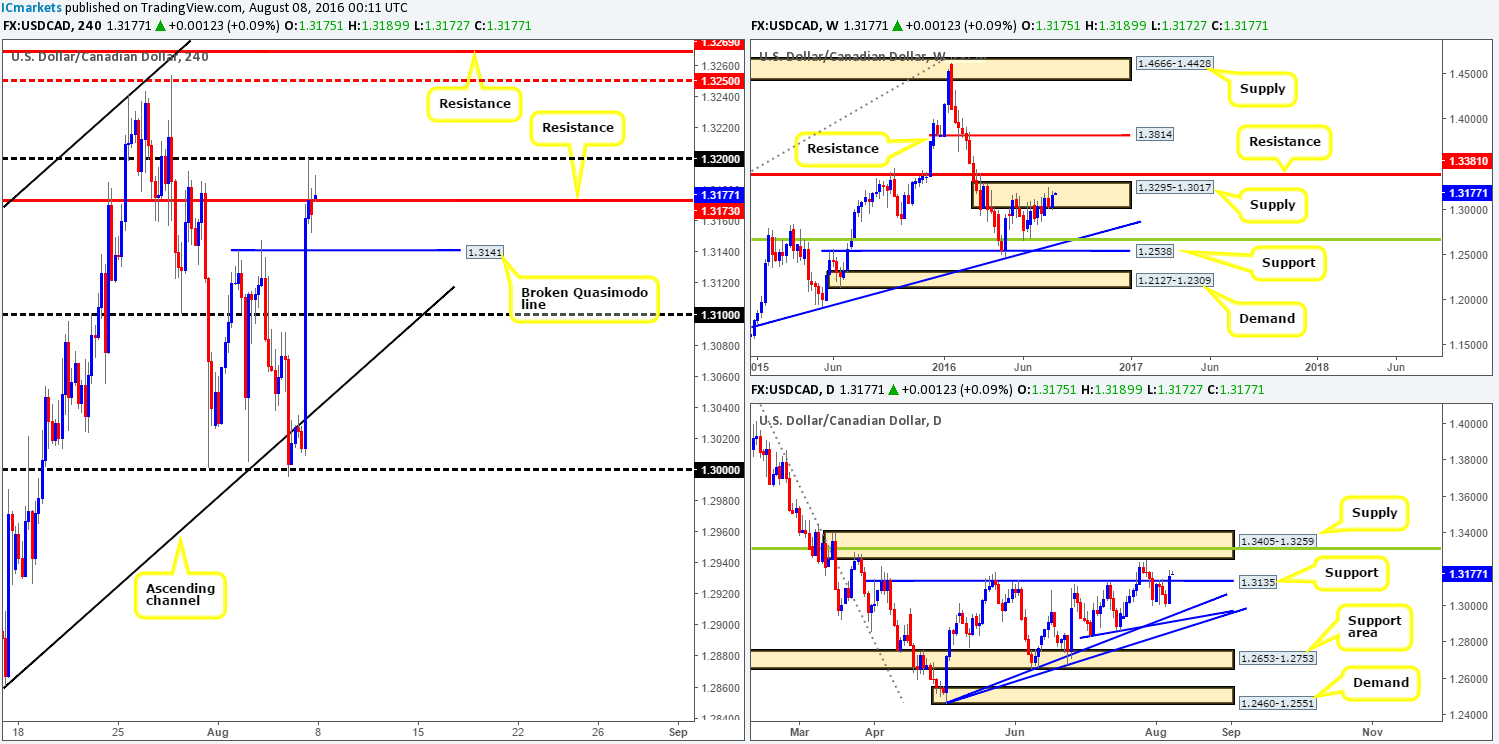
Weekly view: Offers appear to be weakening within weekly supply seen at 1.3295-1.3017. In the event that the bulls remain in control this week, the pair may violate the current weekly supply zone and touch gloves with a major weekly resistance line seen at 1.3381.
Daily view: From this viewpoint, we can see that daily resistance at 1.3135 managed to hold prices lower for the majority of the week. It was only the impact of the non-farm payrolls data that drove prices skyward, taking out this daily resistance line (now acting support) and potentially clearing the path north up to a daily supply area at 1.3405-1.3259 (encapsulates the above said weekly resistance line and houses a daily 38.2% Fib resistance line at 1.3318).
H4 view: The after-effects of the NFP report on Friday saw price munch through both the 1.31 handle and a H4 Quasimodo resistance level at 1.3141 (now acting support), as well as whipsawing through the H4 resistance line at 1.3173 to touch base with the 1.32 handle.
Direction for the week: is tricky to judge at the moment. Daily movement suggests further buying could take place to bring prices up to daily supply seen at 1.3405-1.3259, while, although offers appear weak within the current weekly supply area, we cannot rule this zone out just yet! That being the case, direction is rather limited for the time being.
Direction for today: depends on how this morning’s price action behaves. Should price close back below the current H4 resistance, then we’d expect the loonie to stretch down to the H4 broken Quasimodo line at 1.3141. This gives a thirty-pip profit opening, and would require a very tight stop to make it a worthwhile trade from a risk/reward standpoint.
On the other side of the coin, a close above the H4 resistance and 1.32 handle would likely open the trapdoor towards the H4 mid-way point 1.3250 – a few pips below the lower edge of the daily supply area mentioned above at 1.3405-1.3259. This move gives up around a fifty-pip profit opening. Trading this is still very risky in our opinion, since you’d effectively be buying within weekly supply but trading alongside the current daily flow!
Our suggestions: Personally, there is really very little that interests us in this market right now. With the absence of clearer price action we have decided to remain flat during today’s trade.
Levels to watch/live orders:
- Buys: Flat (Stop loss: N/A).
- Sells: Flat (Stop loss: N/A).
USD/CHF:
Weekly gain/loss: + 107 pips
Weekly closing price: 0.9799
Weekly opening price: 0.9807
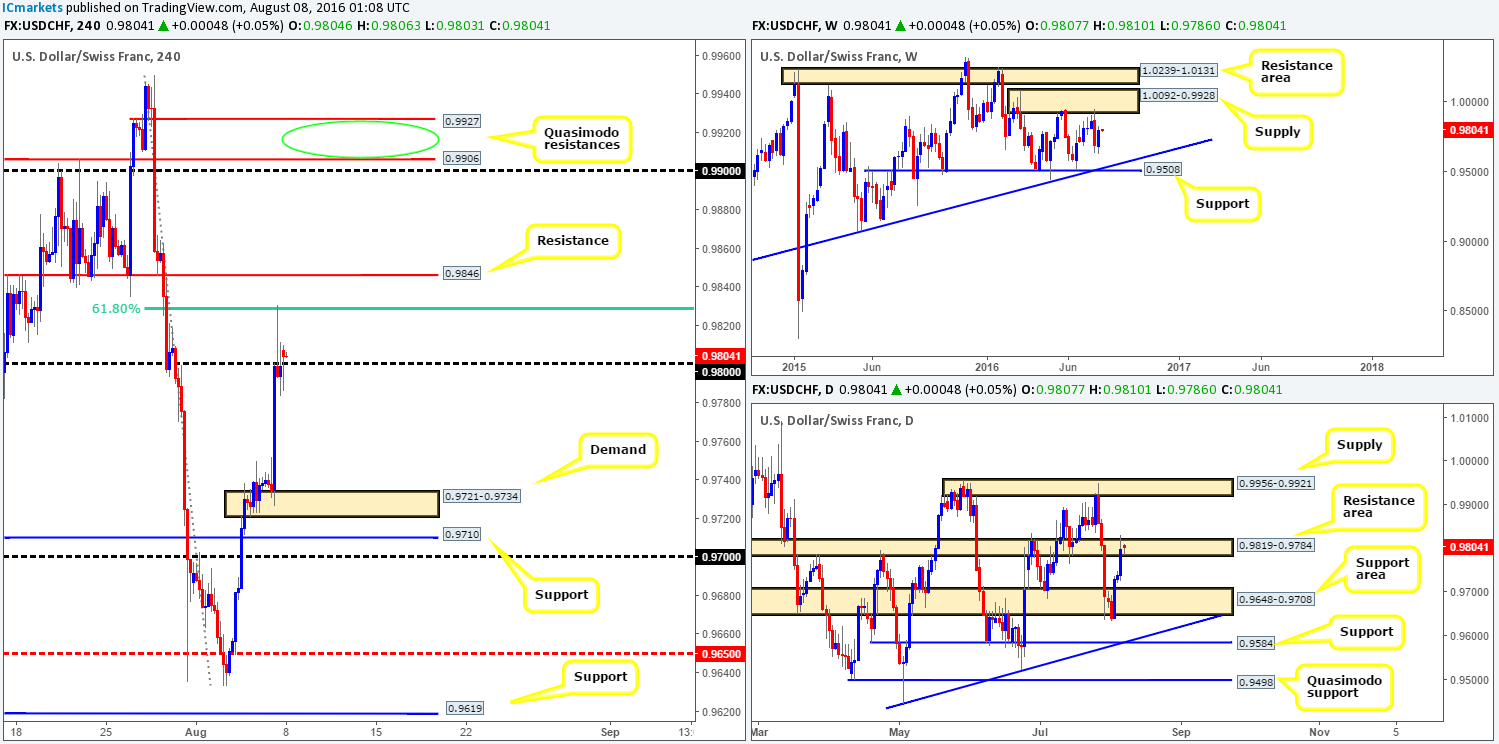
Weekly view: The past week saw renewed buying interest come into the market from the 0.9633 region, thereupon closing the week in profit. In light of this recent ascent, price may continue north this week to greet the weekly supply area at 1.0092-0.9928.
Daily view: Following Tuesday’s close below the daily support area at 0.9648-0.9708, the Swissy changed tracks and entered into a three-day buying frenzy, reaching highs of 0.9830 by the week’s end. This, as you can see, saw price pierce a daily resistance area drawn from 0.9819-0.9784, which has likely removed a truckload of sellers from the market and cleared the river north up to daily supply seen at 0.9956-0.9921 (glued to the underside of the above said weekly supply zone).
H4 view: Friday’s US job’s report came in stronger than expected and aggressively pushed the pair northbound, ending the day whipsawing through the 0.98 handle and touching base with a H4 61.8% Fib resistance level at 0.9829. This morning’s open, however, saw the pair gap above the 0.98 line and for the time being remains in a bullish stance.
Direction for the week: Given the possible weakness around the current daily resistance area, and room for weekly action to advance (see above), we feel further buying is likely on the cards this week.
Direction for today: is also likely to be north. However, our team has noted that they will not become buyers in this market until price has cleared the nearby H4 61.8% Fib resistance at 0.9829 as well as the H4 resistance at 0.9846. Beyond these two barriers, price looks clear up to the 0.98 region, followed closely by two nearby H4 Quasimodo resistances at 0.9927/0.9906.
Our suggestions: Watch for price to CLOSE above the 0.9846 region and look to trade any retest seen to the top-side of this level, targeting 0.98. One could, given the position of the higher-timeframe structure, look to simply enter long from here once price has formed support at this line.
In the event that price does indeed reach 0.98, our team will be looking to short at market between the aforementioned H4 Quasimodo resistances (green circle) with our stops above the apex high 0.9950. The reason comes down where these H4 Quasimodo lines are located: at the underside of both the above said daily resistance area and weekly supply zone.
Levels to watch/live orders:
- Buys: Watch for price to close above the H4 resistance level at 0.9846 and look to trade any retest seen thereafter (lower timeframe confirmation required).
- Sells: 0.9927/0.9906 for shorts at market (Stop loss: 0.9955).
DOW 30:
Weekly gain/loss: + 74 points
Weekly closing price: 18523
Weekly opening price: 18534
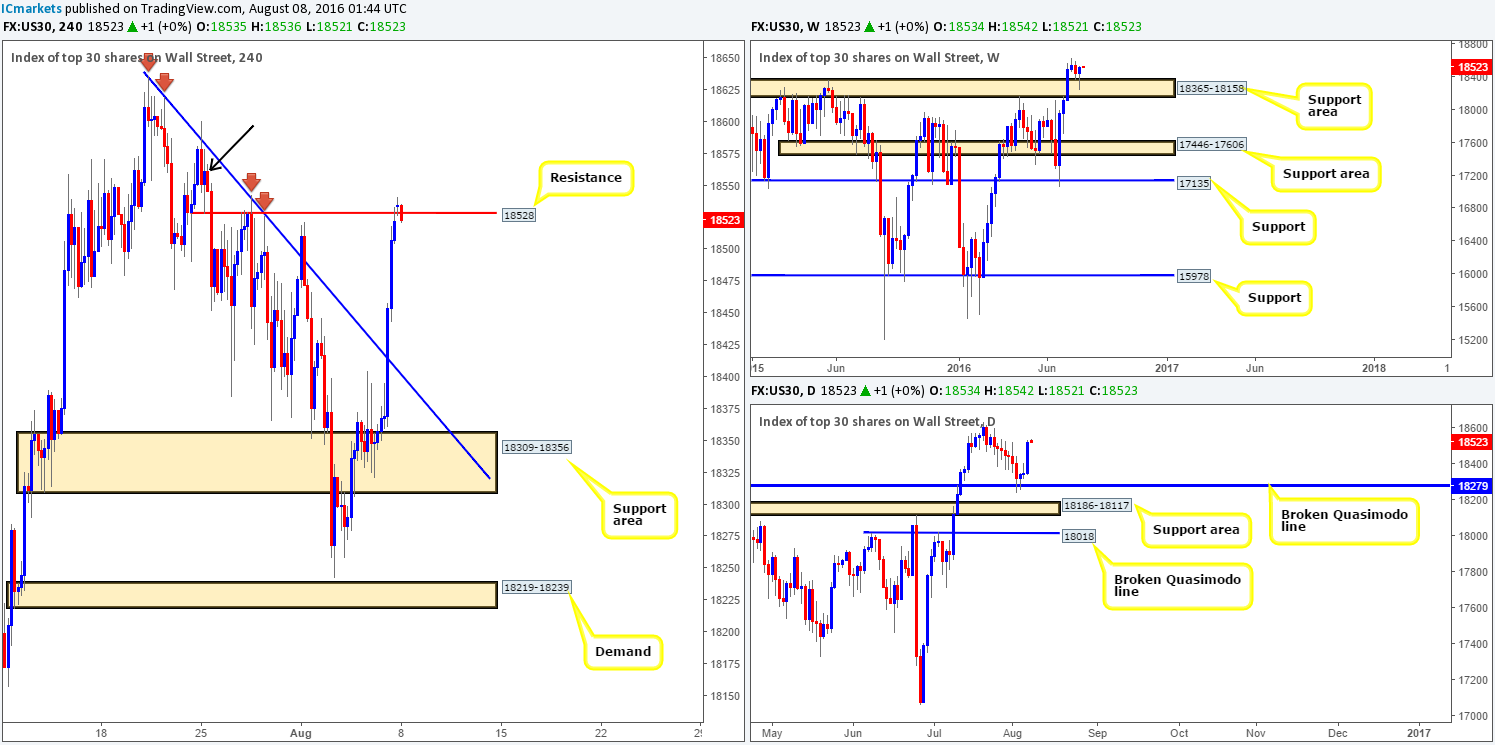
Weekly view: Following the DOW’s first losing week since bouncing from the weekly support line at 17135, the index found a pocket of fresh bids from within the weekly support area at 18365-18158 last week. The bounce from this region resulted in price printing a solid buying tail, suggesting that higher prices may be in the pipeline.
Daily view: Recent action shows that price bounced almost to-the-pip from a daily broken Quasimodo line at 18279, eventually rallying prices to highs of 18533. To the left of current price, there’s very little active supply seen. Therefore, a break of the 18636 high could be something to watch for.
H4 view: A brief look at recent dealings on the H4 chart shows that US stocks steamed higher on Friday after US labor conditions printed a better than expected reading. The move higher took out the H4 trendline resistance extended from the high 18636 and went on to close the week colliding with H4 resistance seen at 18528.
Direction for the week: is more than likely going to be north given the higher-timeframe price action (see above). A break of the all-time high 18636 would, in our opinion, confirm this analysis.
Direction for today: Although price is currently selling off from the H4 resistance at the moment, our team still believes that a close above this line is on the cards today. A close above here followed with an attack at the H4 supply area marked with a black arrow at 18601-18551 would be enough for us to begin looking for a long off the broken H4 line as support given the higher-timeframe picture.
Our suggestions: Watch for a CONVINCING close above the current H4 resistance (which preferably attacks the above said H4 supply) and look to trade any retest seen at this level. We would not advise placing a pending order here. Instead, wait for price to hold at the line and print a bullish close before considering a trade long in attempt to join the current trend.
Levels to watch/live orders:
- Buys: Watch for price to close above the H4 resistance level at 18528 and look to trade any retest seen thereafter.
- Sells: Flat (Stop loss: N/A).
GOLD:
Weekly gain/loss: – $14
Weekly closing price: 1336.6
Weekly opening price: 1335.0
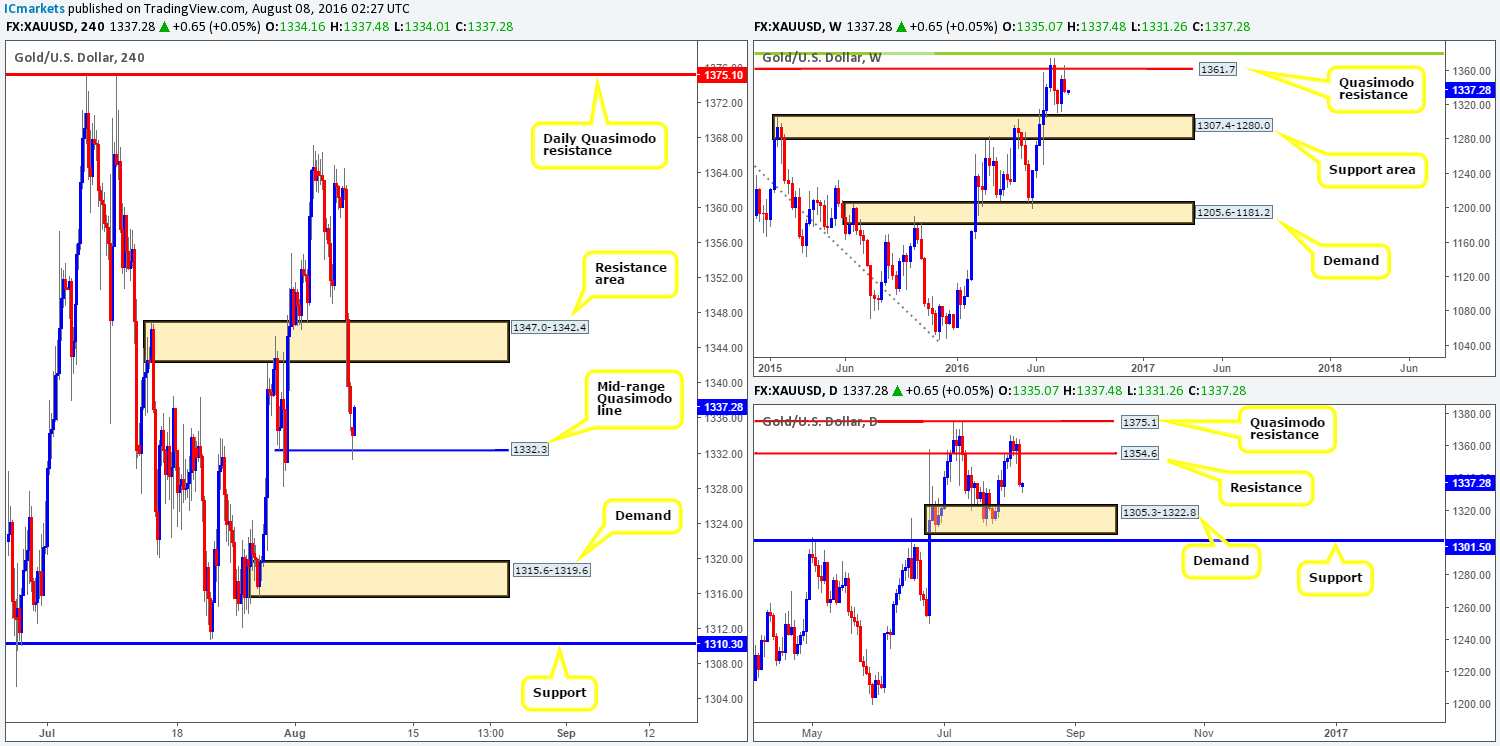
Weekly view: During the course of last week’s session, the yellow metal stabbed into the weekly Quasimodo resistance line seen at 1361.7 and sold off to lows of 1334.5. On the assumption that the bears remain in control this week, it’s possible that we may see gold test the weekly support area drawn from 1307.4-1280.0.
Daily view: From this angle, we can see that the 1354.6 line held the metal higher on Wednesday and Thursday last week. It was only the impact of the non-farm payrolls data that drove prices lower, taking out this daily support line (now acting resistance) and likely clearing the path south down to a daily demand area at 1305.3-1322.8 (sits on top of the above said weekly support area).
H4 view: Friday’s aggressive bout of selling saw price wallop its way through the H4 support area at 1347.0-1342.4 (now acting resistance) and close just ahead of a H4 mid-range Quasimodo line at 1332.3. This morning’s open, however, saw prices gap lower and touch gloves with the above said H4 mid-range Quasimodo line. As we write, we can see that this level has held beautifully so far, which could propel the commodity back up to retest the H4 resistance area coming in at 1347.0-1342.4.
Direction for the week: With both the higher-timeframe charts showing room for this unit to move lower, we’re expecting at least a drive down to at least the daily demand base at 1305.3-1322.8.
Direction for today: will likely see prices gravitate up to the aforementioned H4 resistance area, where we expect strong sellers to come into the market. The reasoning behind our current line of thought is that there’s little resistance in the market until the aforementioned H4 resistance area, and the bulls have made a clear decision to hold the current H4 mid-range Quasimodo line.
Our suggestions: Wait and see if price connects with the current H4 resistance area and holds. Should this come into view, our team will be looking to sell bullion with the backing of a lower timeframe sell signal (see the top of this report), targeting 1332.3, followed by H4 demand at 1315.6-1319.6 (positioned within the aforementioned daily demand zone).
Levels to watch/live orders:
- Buys: Flat (Stop loss: N/A).
- Sells: 1347.0-1342.4 [Tentative – confirmation required] (Stop loss: dependent on where one confirms this area).


