
A note on lower timeframe confirming price action…
Waiting for lower timeframe confirmation is our main tool to confirm strength within higher timeframe zones, and has really been the key to our trading success. It takes a little time to understand the subtle nuances, however, as each trade is never the same, but once you master the rhythm so to speak, you will be saved from countless unnecessary losing trades. The following is a list of what we look for:
- A break/retest of supply or demand dependent on which way you’re trading.
- A trendline break/retest.
- Buying/selling tails/wicks – essentially we look for a cluster of very obvious spikes off of lower timeframe support and resistance levels within the higher timeframe zone.
- Candlestick patterns. We tend to only stick with pin bars and engulfing bars as these have proven to be the most effective.
We search for lower timeframe confirmation between the M15 the H1 timeframes, since most of our higher-timeframe areas begin with the H4. Stops are usually placed 5-10 pips beyond confirming structures.
EUR/USD:
Weekly gain/loss: + 252 pips
Weekly closing price: 1.1361
Weekly opening price: 1.1350
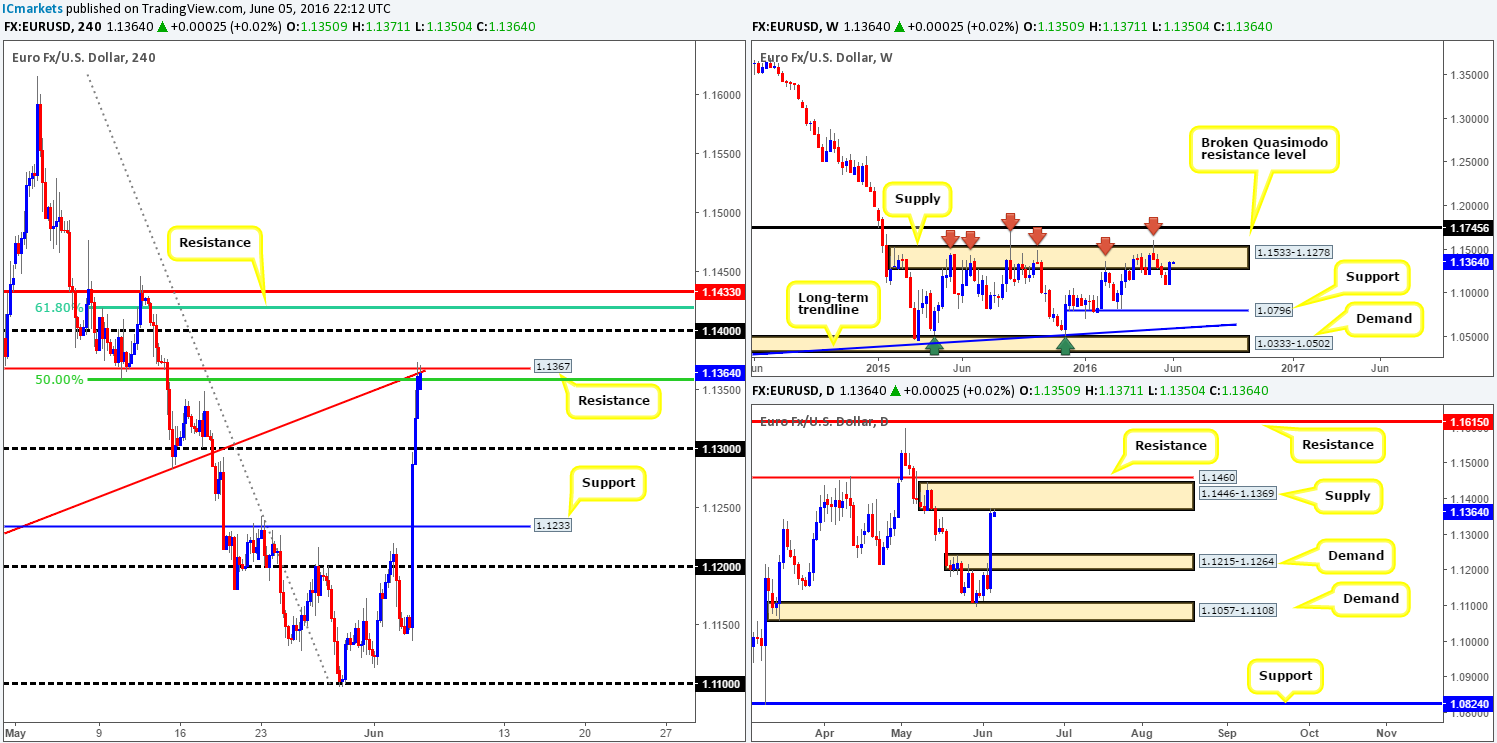
Weekly view: After four weeks of continuous selling, the EUR staged a relatively impressive comeback last week. This, as you can see from the weekly chart, not only placed the pair back within the jaws of a major area of supply seen at 1.1533-1.1278, but it also clawed back over half of the recent losses. Although the bulls have made an appearance here they still have a lot of work to do, as let’s not forget that the current supply area has managed to hold price lower since May 2015!
Daily view: Thanks to last week’s bullish assault, the buyers and sellers are now seen battling for position around the underside of a supply zone coming in at 1.1446-1.1369. Should price break above this zone this week, immediate resistance is seen just ahead at 1.1460. On the flip side, a sell-off from here could potentially bring this market back down to demand drawn from 1.1215-1.1264.
H4 view: 39k jobs were added to the U.S. economy in the month of May versus an expected 159k in Friday’s NFP report, which sent the EUR screaming north into the close. Consequent to this recent surge in buying and a relatively stable open this morning (gap of elven pips), price is now going toe-to-toe with resistance logged in at 1.1367. This area also brings together a 50% Fib resistance at 1.1358 and a trendline support-turned resistance taken from the low 1.1057.
Our suggestions: Given that weekly and daily price are both trading at supply right now (see above), our team is predominantly looking at shorting for the time being. The current H4 resistance at 1.1367, and also the H4 resistance seen above at 1.1433 (bolstered by the H4 61.8% Fib level at 1.1419) are, in our opinion, beautiful areas to be looking for sell opportunities this week.
We would, however, only recommend trading the above lines if and only if lower timeframe confirming price action is seen. This could be an engulf of demand followed by a retest, a trendline break/retest or simply a collection of selling wicks around a lower timeframe resistance. Should one manage to spot a short opportunity early on today from the 1.1367 region, we’d be looking to take partial profits around the 1.13 band and reducing risk to breakeven.
Levels to watch/live orders:
- Buys: Flat (Stop loss: N/A).
- Sells: 1.1367 region [Tentative – confirmation required] (Stop loss: dependent on where one confirms this area). 1.1433 region [Tentative – confirmation required] (Stop loss: dependent on where one confirms this area).
GBP/USD:
Weekly gain/loss: – 101 pips
Weekly closing price: 1.4511
Weekly opening price: 1.4460
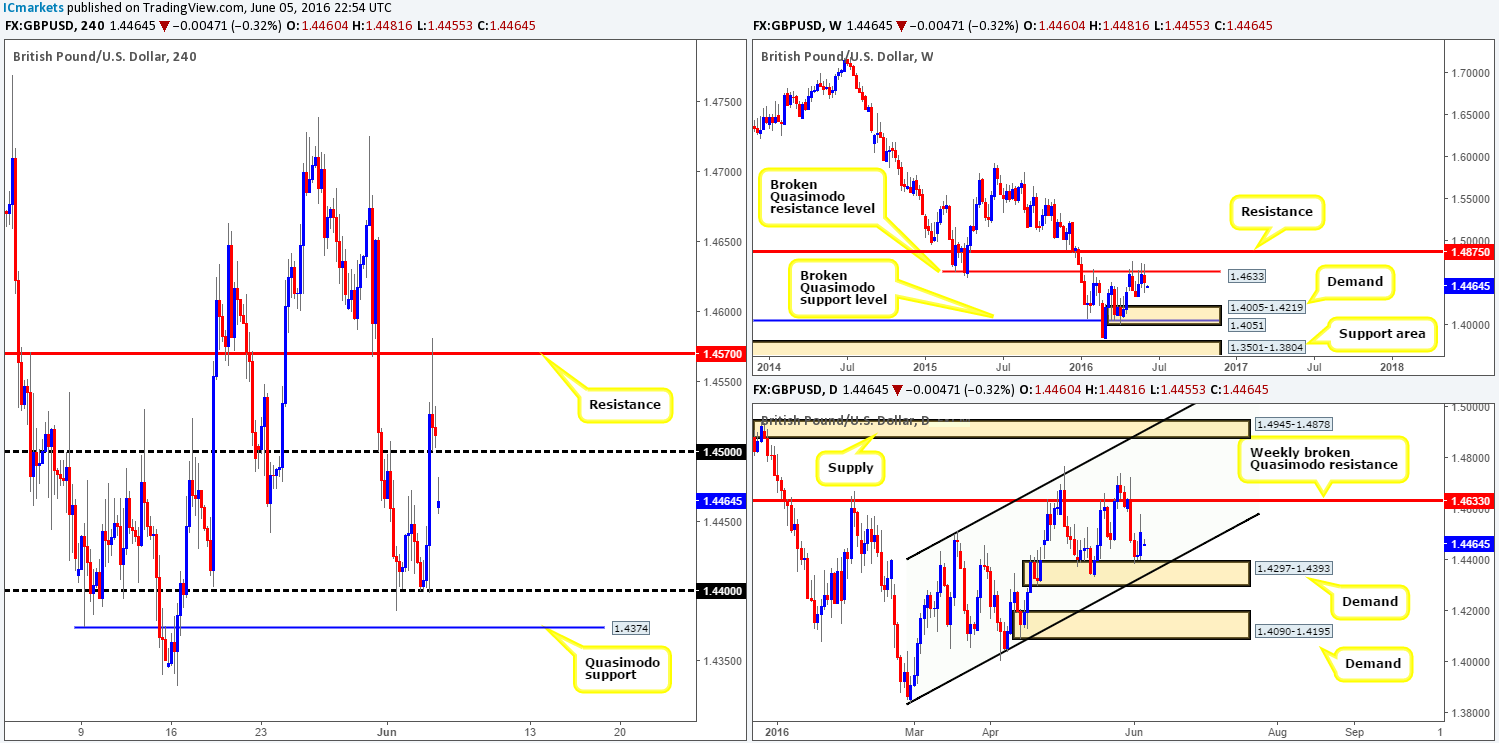
Weekly view: As can be seen from the weekly chart this morning, the pound remains trading beneath the broken Quasimodo resistance line (BQM) at 1.4633. With this line managing to cap upside since early February and the pair clearly still entrenched within a downtrend, we feel the bears may continue to claw lower this week down to demand chalked up at 1.4005-1.4219 (fuses with a broken Quasimodo support level at 1.4051).
Daily view: Despite the weekly chart, daily price is currently trading from demand fixed at 1.4297-1.4393, which, as you can see, blends nicely with channel support extended from the low 1.3835. Therefore, in order for weekly action to push lower this week, bids will need to be removed from here to allow price to connect with demand coming in at 1.4090-1.4195 (positioned within the aforementioned weekly demand).
H4 view: A quick recap of Friday’s sessions on the H4 shows cable rocketed north following a lower-than-expected U.S. jobs report. Psychological resistance 1.45 was obliterated with price shortly after connecting with resistance at 1.4570, consequently forcing the market to reverse tracks going into the close. This morning, however, saw sterling gap fifty pips lower in early trade, bringing the pair back below 1.45. This gap will likely be filled today which could lead to a rebound being seen from the underside of 1.45.
Our suggestions: With weekly sellers trading from a weekly BQM line at 1.4633 and daily buyers supporting daily demand at 1.4297-1.4393, it’s becoming a tricky pair to trade! As we said above, a rebound could be seen from 1.45 later on today on the assumption that the pair fills the weekend gap. Other than this, however, there is not really much else to hang our hat on we feel.
If you’re looking to trade the 1.45 band today, we’d advise being patient and not entering into a position until some sort of lower timeframe sell setup has formed (see the top of this report for ideas on confirming lower timeframe price action). The reason being is psychological numbers are prone to some very nasty fakeouts, and getting caught on a whipsaw and then seeing price hit your target is something we all want to try and avoid as much as possible!
Levels to watch/live orders:
- Buys: Flat (Stop loss: N/A).
- Sells: 1.45 region [Tentative – confirmation required] (Stop loss: dependent on where one confirms this area).
AUD/USD:
Weekly gain/loss: + 182 pips
Weekly closing price: 0.7361
Weekly opening price: 0.7363
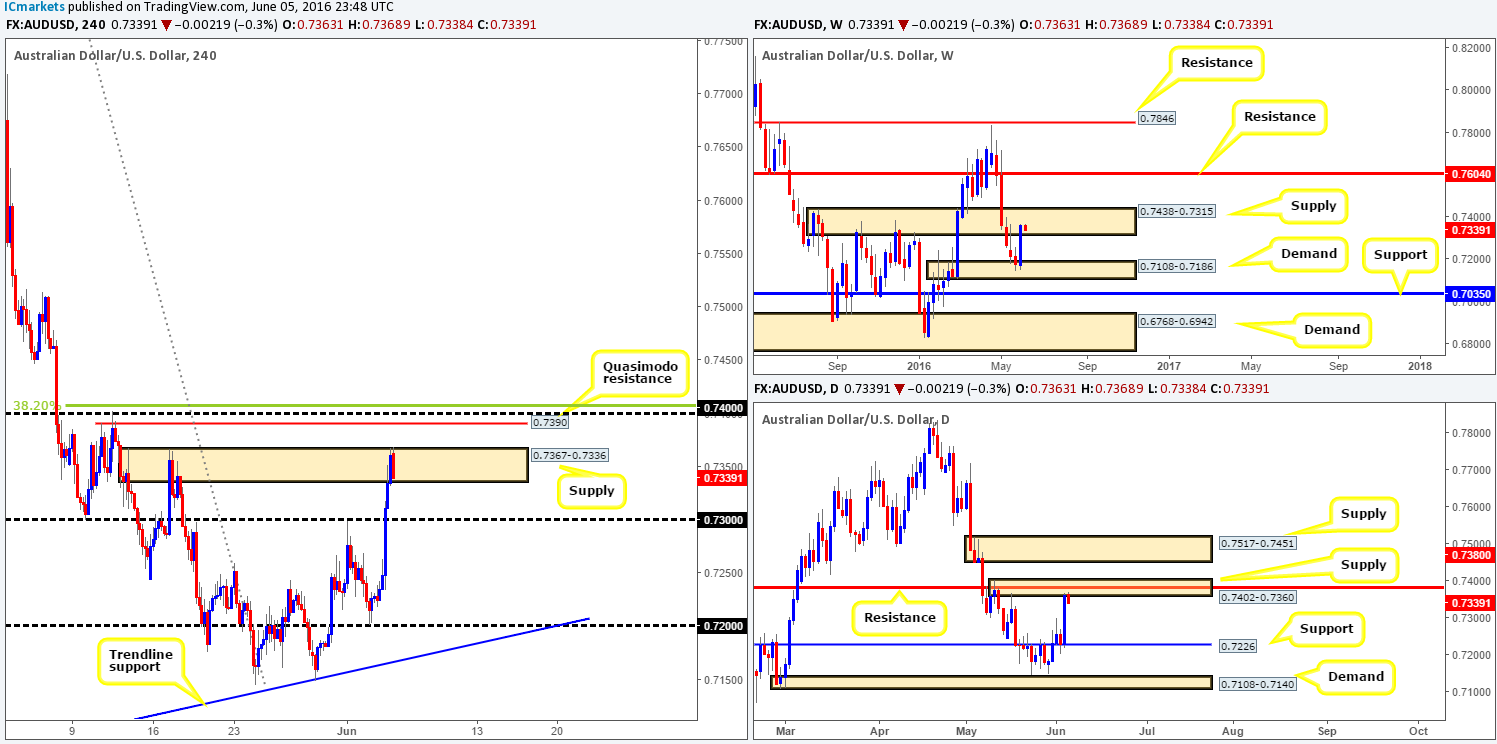
Weekly view: The past week saw the commodity currency sharply rebound from demand coming in at 0.7108-0.7186, which not only placed price within the jaws of supply at 0.7438-0.7315, but also erased three weeks’ worth of losses! In the event that the bulls continue to drive higher this week, despite being positioned within supply, all eyes will be on neighboring resistance drawn from 0.7604.
Daily view: In a similar fashion to the weekly chart, we can also see that daily price is currently trading from supply drawn from 0.7402-0.7360 (surrounds a resistance line penciled in at 0.7380). If this area caves in, there’s not much stopping price from gravitating towards supply seen at 0.7517-0.7451 (sits directly above the aforementioned weekly supply). Supposing that the bears defend this zone this week, we’ll then expect the Aussie to shake hands with support chiseled in at 0.7226.
H4 view: Following Friday’s heavy push to the upside on the back of weak U.S. employment data, price is now seen flirting with the extremes of a supply zone given at 0.7367-0.7336. In light of a stable beginning to the week, offers appear to be drying up around the current supply area, which may force this market to test the Quasimodo resistance line at 0.7390 (bolstered by a 0.74 handle and 38.2% Fib resistance line at 0.7405).
Our suggestions: Seeing as how weekly action is trading from weekly supply at 0.7438-0.7315, as well as daily price also touching gloves with a daily supply base at 0.7402-0.7360, our attention will mostly be driven towards shorts today/this week. Personally, we have zero interest in shorting from the current H4 supply area. Not only is this the second time this zone has been visited but price also recently spiked above the barrier, likely hitting a pocket of stops.
Therefore, we feel the H4 Quasimodo resistance line at 0.7390 and its converging structures (see above) is a sound base to permit a pending sell order. We have set an order to sell at 0.7388 and placed our stop just above the 38.2% H4 Fib level at 0.7407. The first target will, should the order fill, be around the 0.7350 region
Levels to watch/live orders:
- Buys: Flat (Stop loss: N/A).
- Sells: 0.7388 [Pending order] (Stop loss: 0.7407).
USD/JPY:
Weekly gain/loss: – 365 pips
Weekly closing price: 106.53
Weekly opening price: 106.56
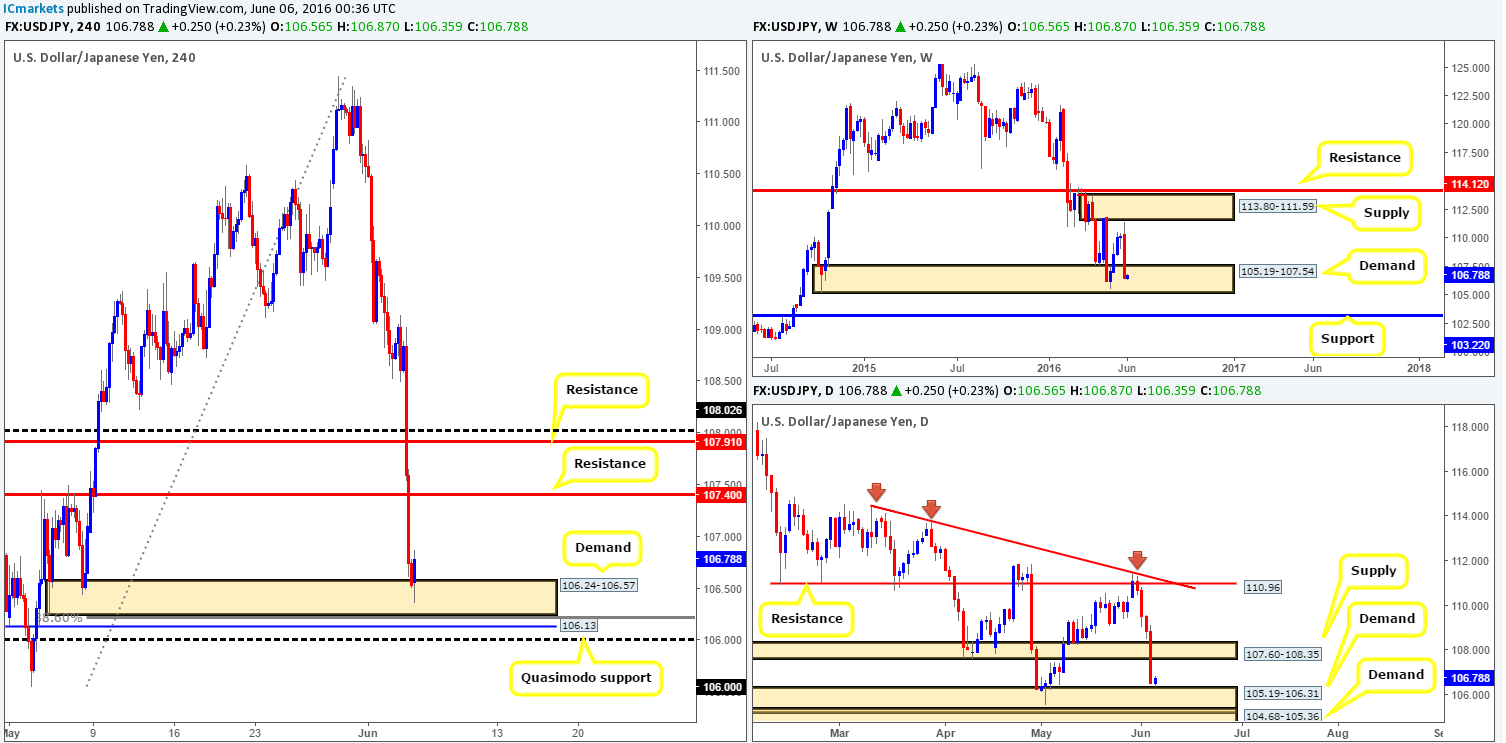
Weekly view: The USD/JPY dropped sharply last week, resulting in price connecting with demand penciled in at 105.19-107.54. This area is certainly a strong-looking zone which has already proved itself once already back in early May. The next upside target from here falls in at supply drawn from 113.80-111.59, whilst a break lower could encourage further selling down to support at 103.22.
Daily view: From this angle, we can also see that this market recently connected with demand coming in at 105.19-106.31. As you can probably see, this is simply a smaller demand area that is housed within the above said weekly demand. In addition to this, however, take note that the daily demand is bolstered by another daily area just below it at 104.68-105.36. Therefore a fakeout beyond the weekly demand is a possibility.
H4 view: Analyzing Friday’s sessions on the H4 chart shows that the bid-side of this market came under serious pressure, following a paltry U.S. jobs report. Several technical supports were taken out and price ended the week stabbing into H4 demand seen at 106.24-106.57. With little change seen at this morning’s open, where do we feel this market is headed today/this week? Well, with all three timeframes trading from demands at the moment, our team is bullish this pair for the time being.
Our suggestions: Look for confirmed buying opportunities at the current H4 demand zone. Why is confirmation required given the higher timeframe confluence? There is a high possibility that price will fake lower to connect with the H4 Quasimodo (which is the ideal line for a pending buy order) support at 106.13 (supported by the 106 handle and a H4 88.6% Fib support at 106.21) before price bounces higher, hence the need for confirmation at the current H4 demand. There’s nothing worse than getting whipsawed out of a position only to later find out it could have been avoided! Frist take-profit target from either area, for us, would be the H4 resistance band seen at 107.40, which sits twenty pips below daily supply at 107.60-108.35, followed by 107.91 – another H4 resistance.
Levels to watch/live orders:
- Buys: 106.24-106.57 [Tentative – confirmation required] (Stop loss: dependent on where one confirms this area). 106.13 (Entry at market is a possibility here we believe, with stops placed below the apex of the H4 Quasimodo at 105.50).
- Sells: Flat (Stop loss: N/A).
USD/CAD:
Weekly gain/loss: – 93 pips
Weekly closing price: 1.2929
Weekly opening price: 1.2939
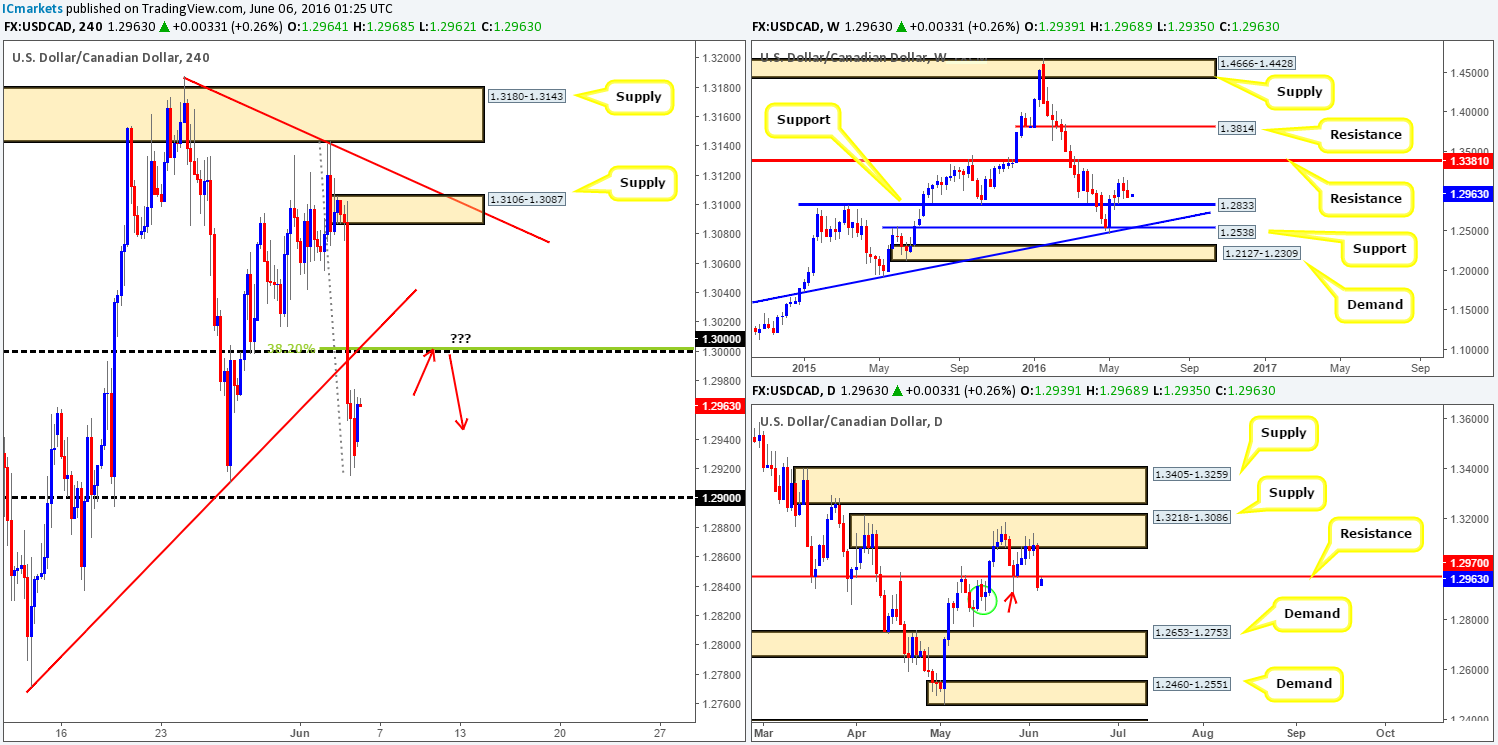
Weekly view: Based on last week’s trading, the Loonie is now seen loitering just above support at 1.2833. Should the buyers manage to hold this market above this hurdle, we feel there’s a good chance that price will eventually shake hands with resistance seen at 1.3381.
Daily view: From this angle, we can see that price ended last week closing below support at 1.2970 (now acting resistance). Provided that the sellers hold ground around this line, we see little active demand until price connects with 1.2653-1.2753. The demand seen marked with a green circle at 1.2836-1.2909 is, at least in our estimation, already consumed by the low marked with a red arrow at 1.2910.
H4 view: Thanks to Friday’s NFP-induced selling, price took out the key 1.30 number and clocked lows of 1.2915 by the day’s end. Right now, we believe traders will generally be honing in on the 1.30 band today for a possible retest, especially since it converges beautifully with a 38.2% Fib resistance at 1.3001 as well as trendline support-turned resistance.
Our suggestions: Based on the daily chart showing room to move lower (see above) and the 1.30 number blending nicely with other structures, we’re going to be keeping a close eye on this line today for possible shorting opportunities using lower timeframe action (see the top of this report for ways we look to confirm a zone). In regards to taking profit, it is a little difficult to judge since price has yet to approach the zone. However, we usually look to cover some of the position at the first approach demand on the H4.
Levels to watch/live orders:
- Buys: Flat (Stop loss: N/A).
- Sells: 1.30 region [Tentative – confirmation required] (Stop loss: dependent on where one confirms this area).
USD/CHF:
Weekly gain/loss: – 187 pips
Weekly closing price: 0.9750
Weekly opening price: 0.9757
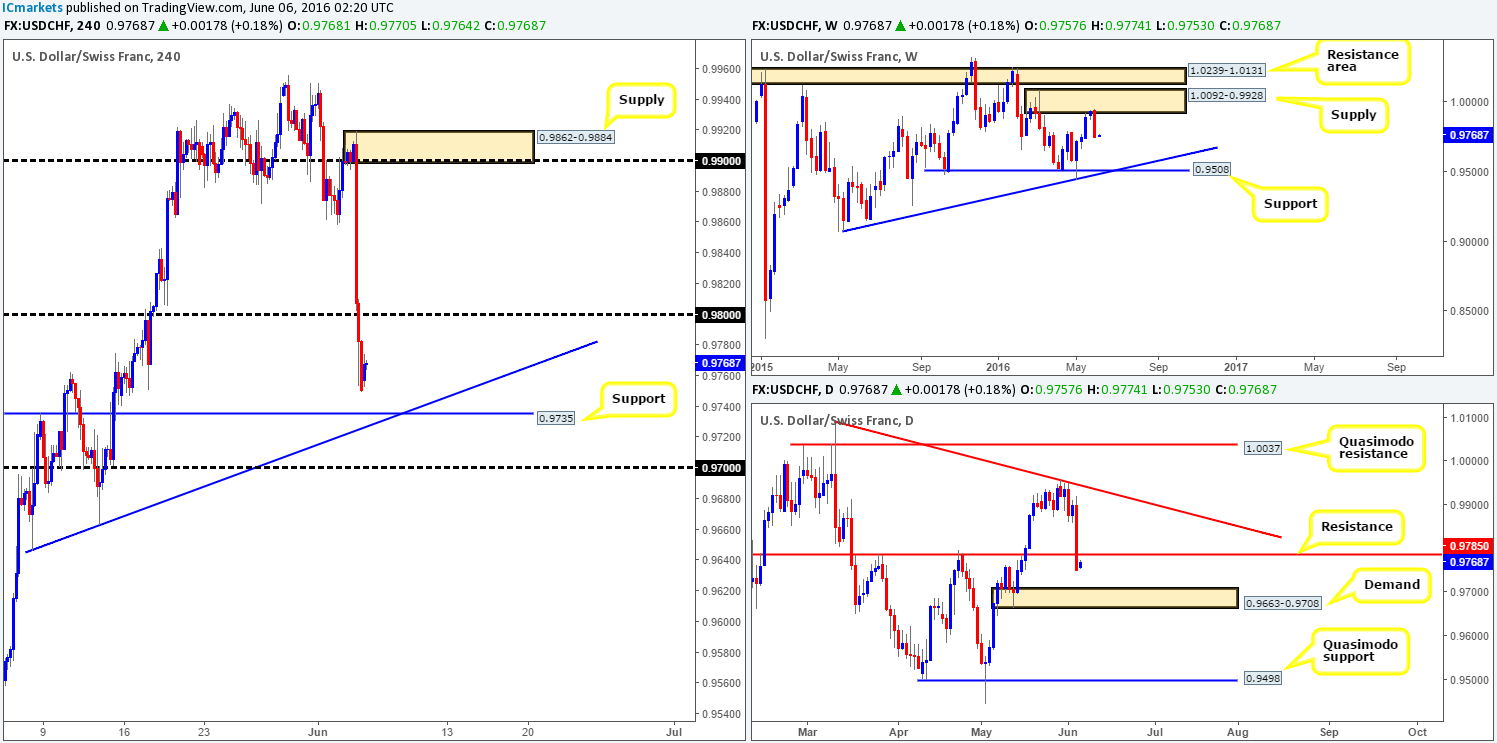
Weekly view: For traders who continued to buy this market last week in hope that the four-week rally would continue likely got stung, as a considerable wave of offers came into the market from a large supply area seen at 1.0092-0.9928. Price could effectively bounce either way now according to the weekly chart. We could see price reverse and retest the weekly supply it just came from, or the Swissy could continue to dive lower and head for support at 0.9508 (ties in nicely with trendline support extended from the low 0.9078).
Daily view: Moving down to the daily chart, support at 0.9785 was taken out by the week’s end, which has potentially opened up the gates for further selling down to demand penciled in at 0.9663-0.9708. Beyond this demand, however, we see very little stopping price dropping lower to test the Quasimodo support at 0.9498 (located very close to weekly support mentioned above at 0.9508).
H4 view: Over on the H4 chart, the pair started the day around 0.9757, slightly higher than Friday’s close which came after a strong push to the downside on the back of a lower-than-expected U.S. jobs print. With the Swiss pair now seen loitering mid-range between the 0.98 resistance handle and support at 0.9735 which converges with trendline support taken from the low 0.9646, where do we go from here?
Our suggestions: The 0.98 hurdle looks to be a nice line for shorts considering it’s closely positioned to daily resistance at 0.9785, and also not forgetting that weekly action recently sold-off from weekly supply at 1.0092-0.9928. Buying from the aforementioned H4 support or even the 0.97 hurdle just below it is a possibility, but to do this we would strongly advise only entering with lower timeframe confirmation (for ideas on how to spot confirmation please see the top of this report), since by entering long, you’re effectively battling against potential weekly selling!
Levels to watch/live orders:
- Buys: Flat (Stop loss: N/A).
- Sells: 0.98 region [Tentative – confirmation required] (Stop loss: dependent on where one confirms this area).
DOW 30:
Weekly gain/loss: – 58 points
Weekly closing price: 17810
Weekly opening price: 17803
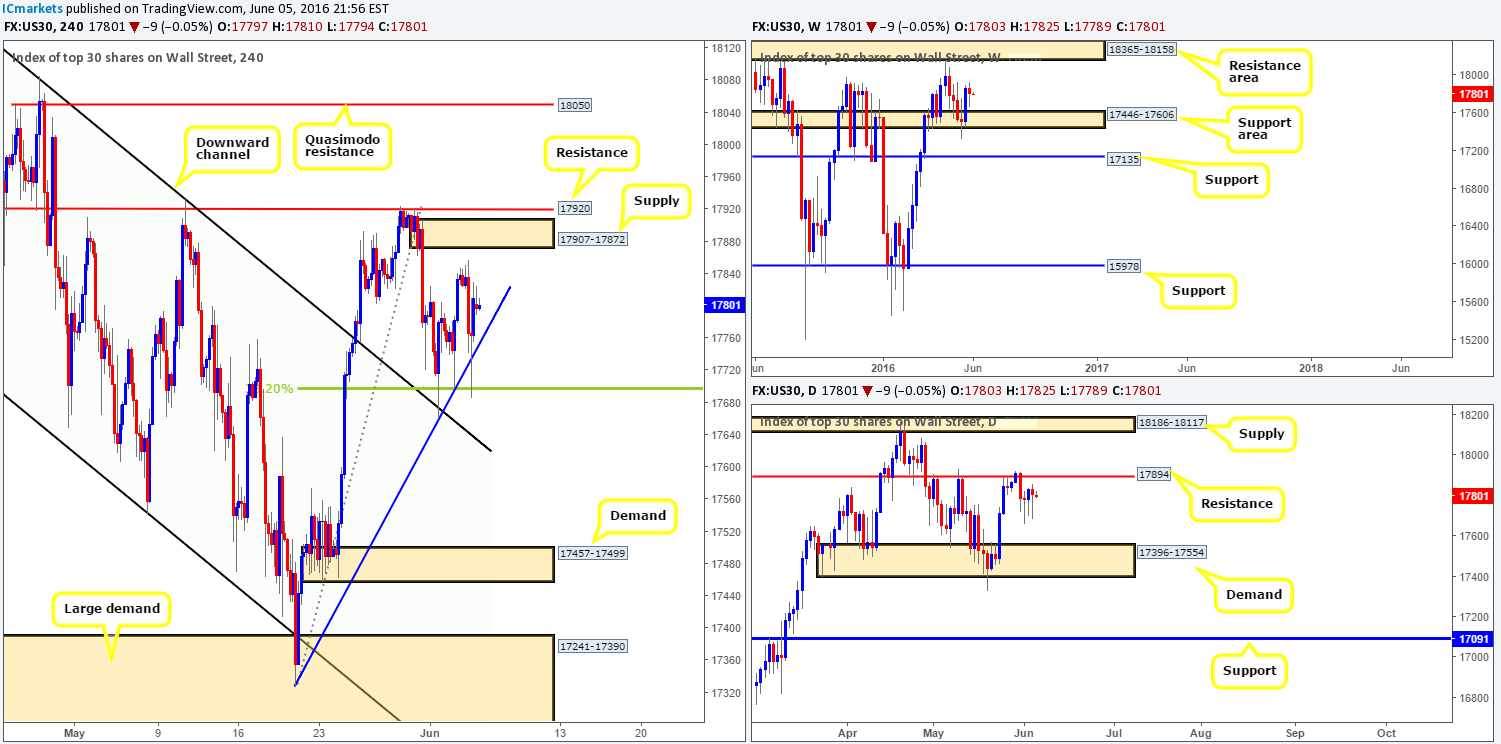
Weekly view: Beginning with the weekly chart this morning, as you can see, the DOW had rather undecided week last week, following the previous week’s advance from the support area seen at 17446-17606. In spite of this, the bulls are still in a relatively positive position as far as we can see, and this could encourage further buying back up to the weekly resistance area at 18365-18158.
Daily view: Following a brief sell-off from resistance at 17894 Tuesday last week, downward momentum diminished considerably from thereafter. Three back-to-back buying tails formed, which although there is little support, suggests buyers may be interested in taking things higher from here. Nevertheless, until the market clears offers from 17894, there is little stop price reaching supply at 18186-18117 and by extension weekly supply at 18365-18158.
H4 view: So with the weekly chart suggesting that there is a possibility of further buying this week, and daily action showing intention to drive above the current daily resistance line at 17894, how are things looking on the H4 chart? Well, the 38.2% H4 Fib support at 17697 alongside the H4 trendline support taken from the low 17327 continue to hold firm at the moment. Therefore, what we’re looking to happen from this angle is a close above both H4 supply at 17907-17872 and H4 resistance at 17920, for a possible buy trade on the retest, targeting the H4 Quasimodo resistance at 18050 (located below daily supply at 18186-18117).
Levels to watch/live orders:
- Buys: Watch for price to consume both H4 supply at 17907-17872 and H4 resistance at 17920 and then look to trade any retest seen thereafter (lower timeframe confirmation required).
- Sells: Flat (Stop loss: N/A).
GOLD:
Weekly gain/loss: + $31.5
Weekly closing price: 1244.1
Weekly opening price: 1244.1
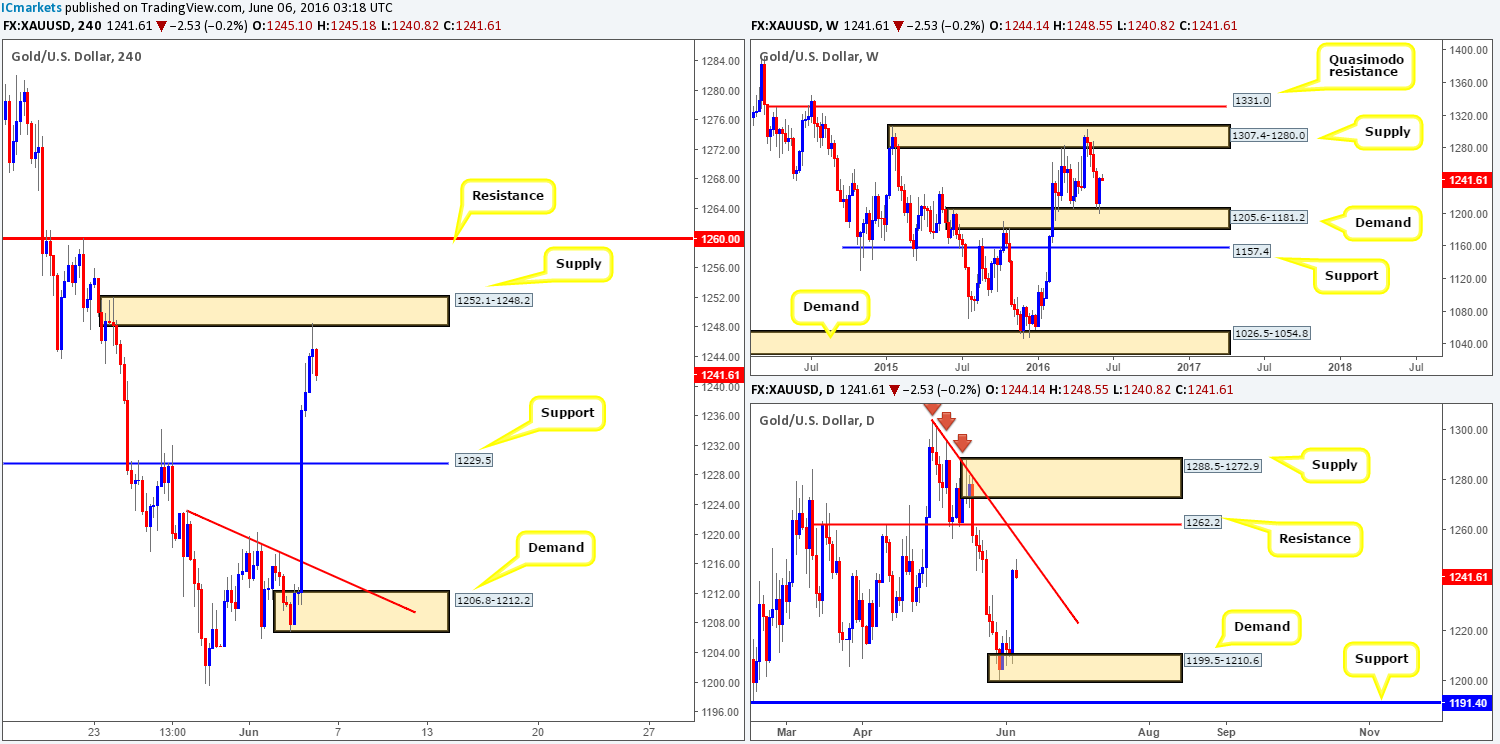
Weekly view: After watching gold decline in value for four straight weeks, the yellow metal recovered last week from the top-side of demand drawn from 1205.6-1181.2. Assuming that bids continue to support this market, there’s little resistance seen overhead until price reaches where it came from – supply seen at 1307.4-1280.0.
Daily view: From the other side of the field, however, daily candles show a steep trendline resistance (taken from the high 1303.6) located nearby current prices. This could potentially halt buying from the above said weekly demand zone as it has already managed to hold price lower on two occasions back in May. So do keep a close eye on this line and even the resistance level just above it at 1262.2.
H4 view: With the dollar plummeting across the board on weak U.S. jobs data, the gold market flourished, rallying to highs of 1244.5 on the day! Bullion remained unaffected during the weekend, and has since rallied to connect with supply drawn from 1252.1-1248.2. Forgetting the higher timeframes for a minute, the selling seen from this supply has, at least on the H4 timeframe, the potential to push price back down to test support at 1229.5.
However, when we throw in all three timeframes in together we have the following:
- Weekly shows that the buyers are in control (see above).
- The daily chart, despite Friday’s advance, is difficult to judge right now until price either connects with the daily trendline resistance (see above) or daily demand at 1199.5-1210.6.
- H4, as we just mentioned has the potential to drive down to test H4 support at 1229.5.
Our suggestions: Personally, neither a long nor short seems attractive at this time! We’re cornered no matter which way we turn! If we sell, we potentially go up against weekly buyers. If we buy, granted, we’ll be trading alongside weekly flow, but at the same time trading into H4 supply as well as daily trendline resistance! With that, our team’s position will remain flat going into today’s sessions.
Levels to watch/live orders:
- Buys: Flat (Stop loss: N/A).
- Sells: Flat (Stop loss: N/A).


