
EUR/USD:
Weekly Gain/Loss: -0.77%
Weekly Closing price: 1.1565
Weekly perspective:
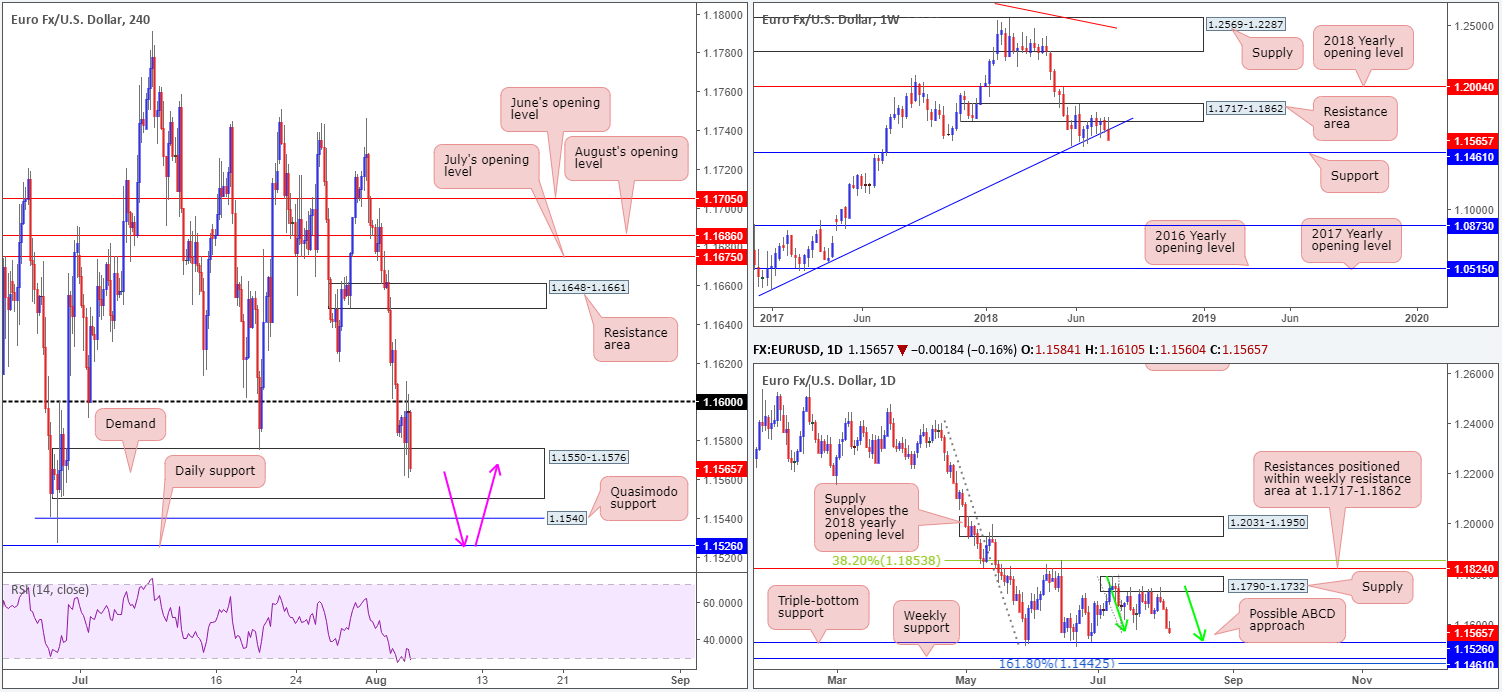
Flavor for EUR/USD longs soured over the course of last week after jabbing the underside of a resistance area seen at 1.1717-1.1862, forcing the unit beneath trend line support (taken from the low 1.0340). Should price extend losses this week, the expectation is for a test of support at 1.1461. Having seen this line represent a STRONG barrier of resistance from 2015 through to mid-2016, a push higher from this level is highly likely.
Daily perspective:
Tuesday’s bearish pin-bar candle formation that formed off the underside of supply at 1.1790-1.1732, as you can see, provoked a healthy selloff on this timeframe last week. Interestingly, this has placed a triple-bottom support at 1.1526 within striking distance, which happens to converge with an ABCD completion (see green arrows).
H4 perspective:
Headline payrolls missed expectations on Friday at 157k in July (consensus 191k), along with both the jobless rate and average hourly earnings coming in as expected (3.9%/0.3%). The report sparked an immediate round of buying, though was swiftly limited by the 1.16 handle, pushing the shared currency deeper into the walls of demand coming in at 1.1550-1.1576. Beyond this area, traders’ crosshairs are likely fixed on the Quasimodo support at 1.1540, followed then by the psychological support 1.15 (not seen on the screen).
Areas of consideration:
Longer term, the daily triple-bottom support at 1.1526 is likely on the radar for many this week. While this is a beautiful level with a firm approach in the shape of an ABCD formation, traders should also pencil in a possible fakeout beneath this level to the weekly support mentioned above at 1.1461. Note this weekly level also boasts a 161.8% daily Fib ext. point at 1.1442 taken from the same high as the daily ABCD at 1.1790.
Intraday (H4), we’re expecting price to run stops beneath both the current H4 demand at 1.1550-1.1576 and nearby H4 Quasimodo support at 1.1540, due to daily support waiting at 1.1526. Given the triggered stop-loss orders likely providing liquidity to buy for traders with big pockets, and the daily support level converging with a daily ABCD approach, 1.1526 could be a level to consider possible longs from today/early this week – see pink arrows (as for stop-loss orders, it may be best to wait for a H4 [or lower] bullish candlestick formation to form and place stops in accordance with the pattern). The ultimate upside target from 1.1526 can be seen around daily supply mentioned above at 1.1790-1.1732.
Today’s data points: Limited.
GBP/USD:
Weekly Gain/Loss: -0.77%
Weekly Closing price: 1.2997
Weekly perspective:
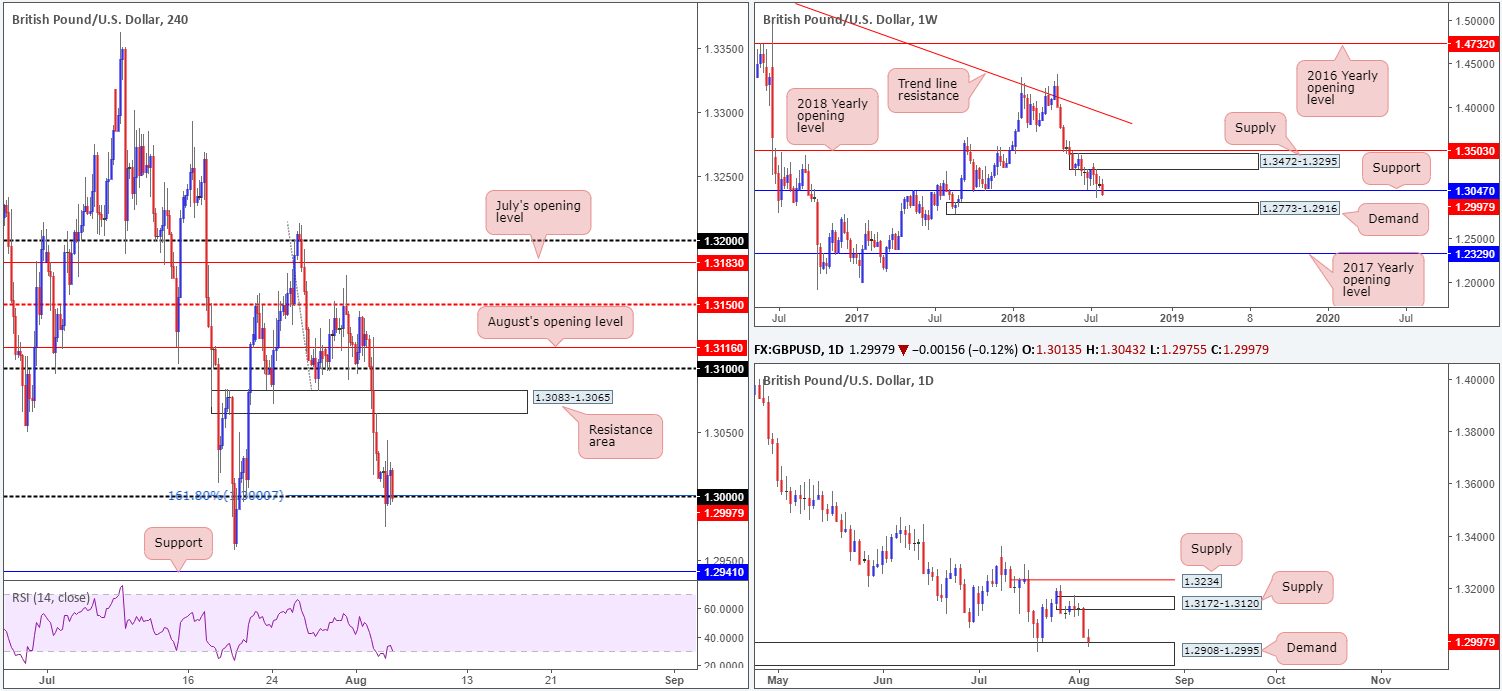
The market witnessed a reasonably strong bout of selling take place last week, consequently engulfing support at 1.3047 and potentially setting the stage for further downside towards demand at 1.2773-1.2916 this week.
Daily perspective:
Before traders look to initiate shorts based on the weekly chart’s expectation, demand on the daily timeframe is already in play at 1.2908-1.2995. Interestingly, this area is actually seen glued to the top edge of the aforementioned weekly demand zone. For that reason, a bounce from here back up to supply fixed at 1.3172-1.3120 this week is certainly not out of the question.
H4 perspective:
Friday’s intraday tone was somewhat subdued as buyers and sellers battled for position around the key figure 1.30, struggling to gain any follow-through traction post-US monthly jobs report. Traders should also note this psychological barrier converges beautifully with not only a 161.8% Fib ext. point taken from the high 1.3213, but also the top edge of daily demand mentioned above at 1.2908-1.2995. In the event price probes lower today, however, keep tabs on the July 19 low at 1.2957, shadowed closely by support at 1.2941.
Areas of consideration:
On account of 1.30 showing confluence with daily demand and a H4 Fib extension, this level still remains an area of interest today, despite the week ending marginally beneath the number. A H4 full or near-full-bodied bull candle printed from here would, in our technical opinion, be enough evidence to validate buyer intent. With stops tucked beneath the candle’s rejection tail, targeting 1.3065 as the initial port of call (underside of a H4 resistance zone), is an option.
Today’s data points: Limited.
AUD/USD:
Weekly Gain/Loss: -0.05%
Weekly Closing price: 0.7398
Weekly perspective:
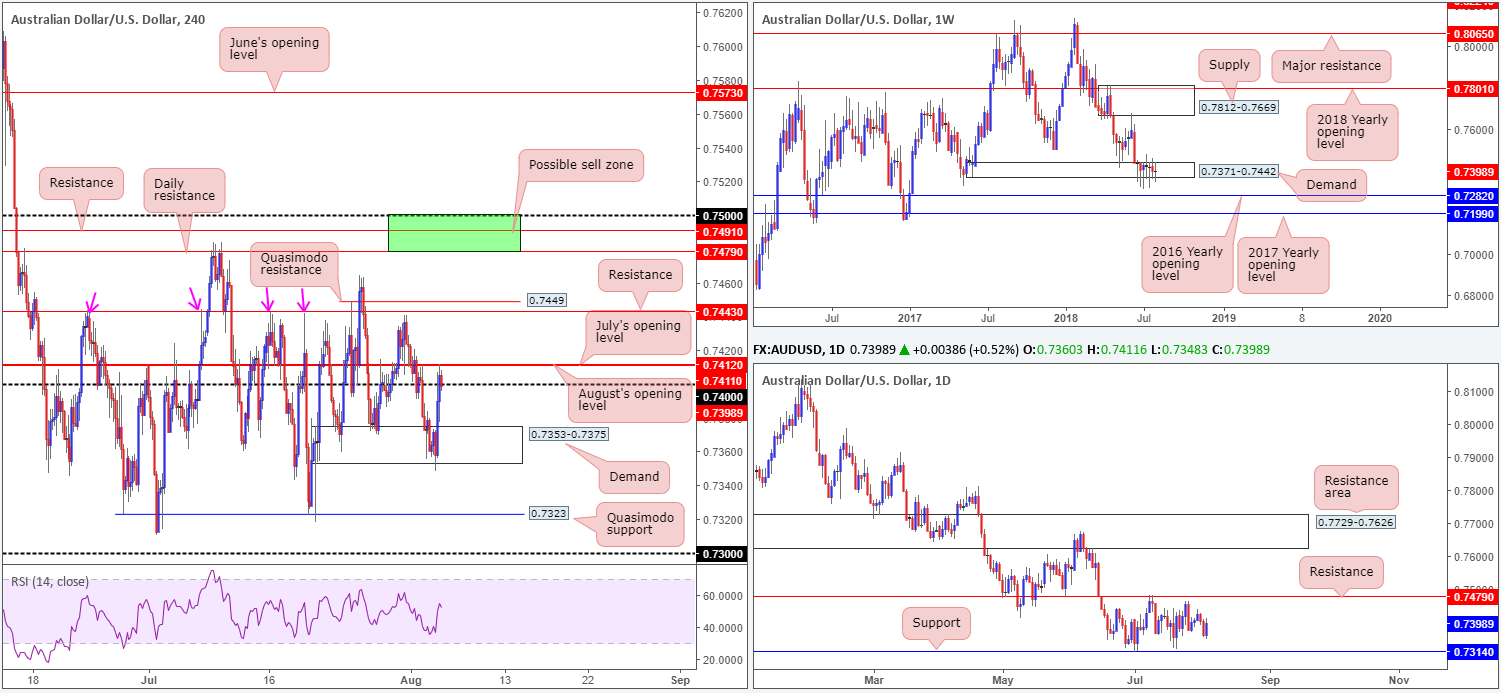
In terms of weekly price action, little has changed over the past couple of months. Demand at 0.7371-0.7442, as you can see, remains in a fragile state at the moment, opening the window to a possible test of the 2016 yearly opening level at 0.7282 sometime down the road. In the event the bulls regain consciousness, however, a retest of supply at 0.7812-0.7669 may eventually be on the cards.
Daily perspective:
The reason behind the lack of movement on the weekly timeframe, technically that is, likely has something to do with the fact daily flow continues to respect its current range. Since early July, the commodity currency has fluctuated between support drawn from 0.7314 and resistance chalked up at 0.7479.
H4 perspective:
AUD/USD bulls went on the offensive on Friday, following a marginal breach of demand at 0.7353-0.7375. This brought the H4 candles to the 0.74 handle, which held price lower during the NFP release. Despite this, the week concluded with price whipsawing above 0.74 and testing 0.7412/0.7411 (August and July’s opening levels).
As you can see, H4 structure remains restricted right now. Between 0.7412 and 0.7443 (a H4 resistance level), one has less than 30 pips to play with, whereas a push back beneath the 0.74 handle, sellers have the top edge of demand to target at 0.7375 – even less room! A break through 0.7443 and nearby H4 Quasimodo resistance at 0.7449, nonetheless, likely opens the path to 0.75/0.7479, a H4 sell zone marked in green comprised of a round number, a H4 resistance and daily resistance.
Areas of consideration:
The only area of interest that jumps out at us this week is the H4 sell zone mentioned above at 0.75/0.7479. Already holding price lower once in early July, this area has a healthy chance of holding should it be tested. As the approach has yet to complete it’s difficult to pin down any firm take-profit targets. In regards to stop-loss orders, nevertheless, traders are urged to wait for H4 price to print something of note (a full or near-full-bodied H4 bear candle) from within the zone (tuck stops above the candle’s rejection wick), since there’s a chance the market may witness a fakeout above 0.75 (common viewing around psychological boundaries).
Today’s data points: Limited.
USD/JPY:
Weekly Gain/Loss: +0.21%
Weekly Closing price: 111.22
Weekly perspective:
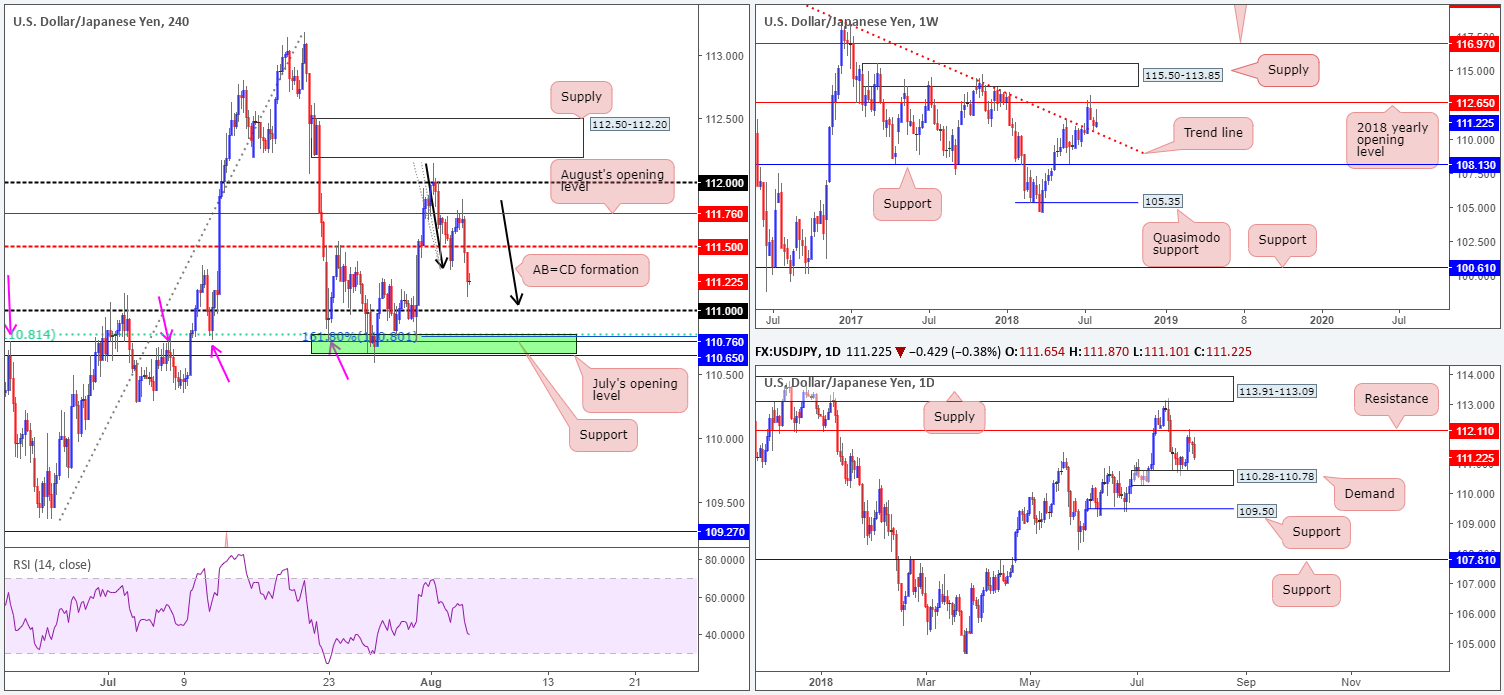
Weekly movement recently crossed swords with a trend line resistance-turned support (taken from the high 123.57). Although last week printed a gain from here, price failed to chalk up anything of note to the upside. In fact, a bearish pin-bar candle formation was seen, topping just south of the 2018 yearly opening level at 112.65. Having seen the current trend line hold firm as resistance on a number of occasions in the past, it’s likely to remain a defensive barrier going forward.
Daily perspective
What’s also notable regarding the current weekly trend line support is it converges closely with daily demand posted at 110.28-110.78, which may be retested this week after price found resistance overhead at 112.11.
H4 perspective:
The impact of Friday’s non-farm payroll’s miss sent intraday action southbound, firmly breaking through mid-level support at 111.50 and eventually clocking session lows of 111.10. What’s also notable from a technical perspective on the H4 timeframe is the AB=CD (black arrows) 161.8% Fib ext. point at 110.80.
Areas of consideration:
While traders are likely honing in on 111 today, the team has noted to keep a close eye on the green area marked below it at 110.65/110.81 for possible longs. Why we like this area comes down to its construction:
- July’s opening level at 110.65.
- H4 support at 110.76.
- 61.8% H4 Fib support at 110.81.
- 161.8% H4 Fib ext. point mentioned above at 110.80.
Also bear in mind the top edge of daily demand mentioned above at 110.78 converges nicely with 110.65/110.81, therefore a bounce higher from here could be in store (conservative stops can be placed around the 110.57 neighborhood). A H4 close back above 111 from this area would, in our view, be a solid cue to begin thinking of reducing risk to breakeven and taking partial profits off the table.
Today’s data points: Limited.
USD/CAD:
Weekly Gain/Loss: -0.47%
Weekly Closing price: 1.2990
Weekly perspective:
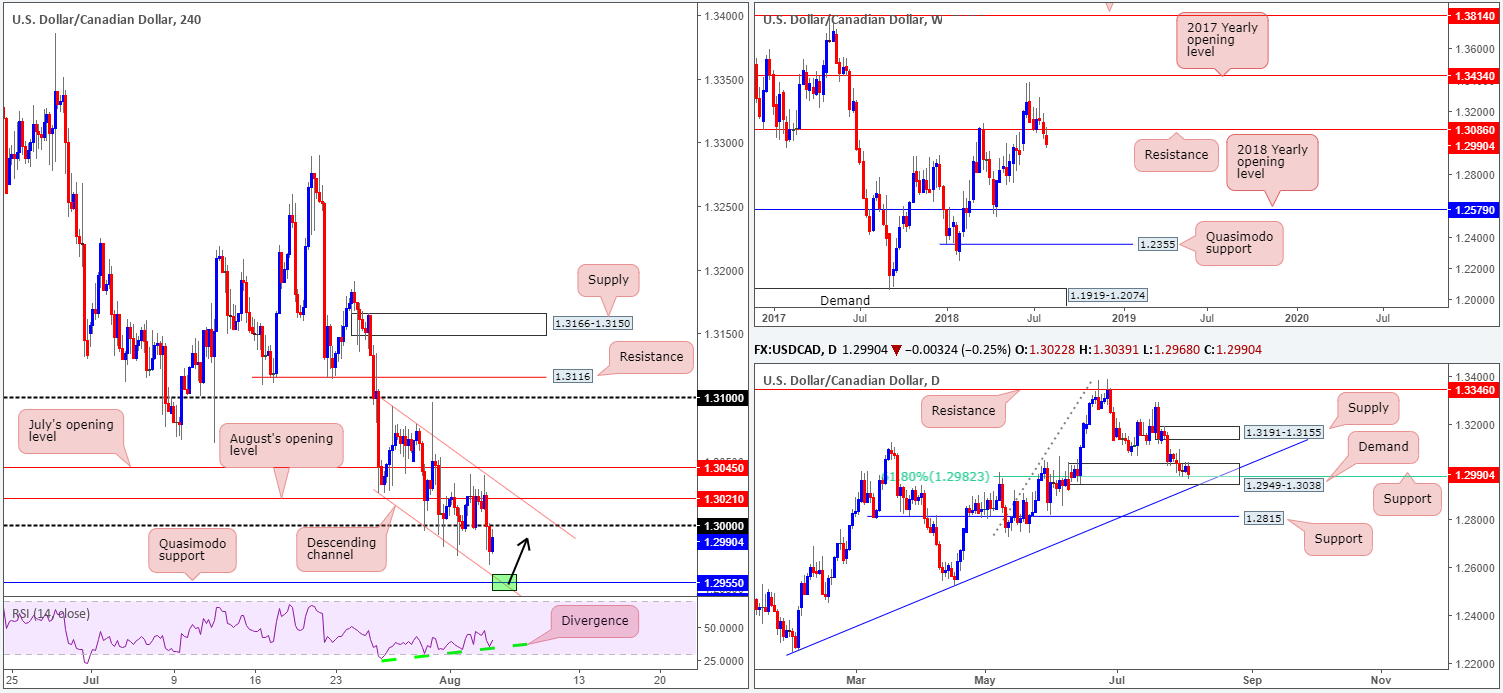
Over the course of last week’s session, the USD/CAD eked out a third consecutive weekly loss after retesting the underside of a recently engulfed weekly support 1.3086 as resistance. In terms of obvious support beneath 1.3086, we do not see a whole lot stopping this market from reaching as far south as 1.2579: the 2018 yearly opening level.
Daily perspective:
In spite of last week’s firm close beneath weekly support, daily price remains toying with a rather attractive demand area visible at 1.2949-1.3038. Within this area we also see a 61.8% Fib support value at 1.2982. Another key structure to note on this scale is the nearby trend line support (etched from the low 1.2247). The next upside target from the current demand area falls in around supply fixed at 1.3191-1.3155.
H4 perspective:
After testing the underside of August’s opening line at 1.3021 (see M30 for a clearer view), the pair swiftly turned south on Friday on lower-than-expected non-farm payrolls. The move engulfed the key figure 1.30 and probed to lows of 1.2968. Going forward, top side resistance could form off 1.30 and pull the unit towards nearby channel support taken from the low 1.3024.
Areas of consideration:
A level that has ‘trade me long’ written all over it today is the H4 Quasimodo support seen at 1.2955. Besides fusing with H4 channel support mentioned above, along with the H4 RSI displaying divergence, 1.2955 is also positioned within the lower limits of daily demand at 1.2949-1.3038 (near the aforementioned daily trend line support). With that in mind, stop-loss orders can be positioned BENEATH daily demand around 1.2945 (that’s a 10-pip stop), targeting the 1.30 barrier as the initial take-profit zone (45 pips) – incredibly attractive risk/reward!
Today’s data points: Limited.
USD/CHF:
Weekly Gain/Loss: +0.02%
Weekly Closing price: 0.9938
Weekly perspective:
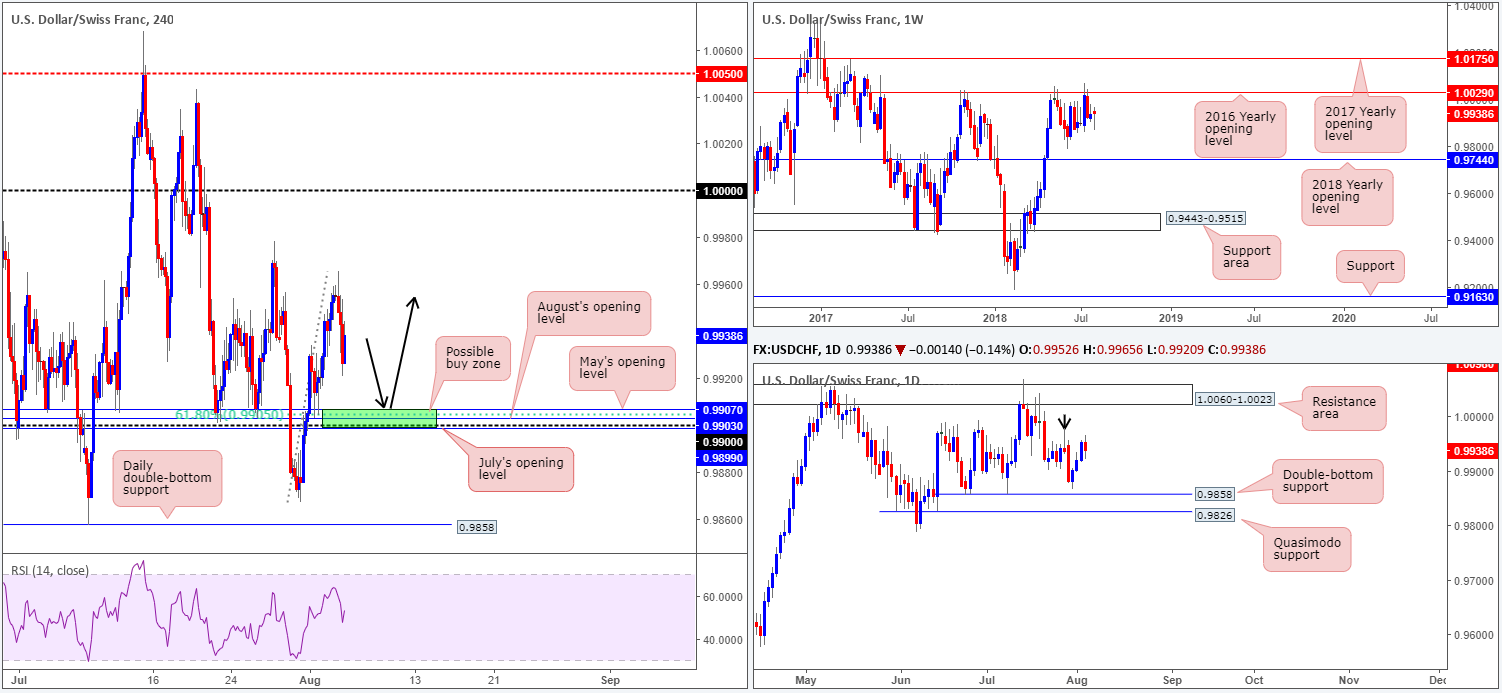
As can be seen on the weekly timeframe, price action penciled in a firm buying tail last week, practically constructing a bullish pin-bar candle formation. To print something of this size takes money – pro money. Given this, assuming further upside takes shape, key resistance at 1.0029 may enter the fold. Holding price lower on two occasions in 2017, and twice already in 2018, this level commands attention!
Daily perspective:
The story on the daily scale shows price action bottomed just north of a double-bottom support at 0.9858 in the early stages of last week, and advanced into the limits of a supply, shaped in the form of a bearish pin-bar candle formation (see black arrow) between 0.9978-0.9931. A break of this base could see a run up to 1.0060-1.0023: a resistance area that encapsulates the 2016 yearly opening level mentioned above on the weekly timeframe at 1.0029.
H4 perspective:
On the whole, Friday’s session observed intraday action fade highs of 0.9965 to lows of 0.9920, consequently shining the spotlight on an interesting area of support seen nearby in green at 0.9899/0.9907 (comprised of July’s opening level at 0.9899, the 0.99 handle, August’s opening level, a 61.8% Fib support and May’s opening level at 0.9907).
Areas of consideration:
There are two cautionary points to consider before looking to buy from 0.9899/0.9907. Firstly, we are coming from daily supply mentioned above at 0.9978-0.9931. And secondly, round numbers tend to attract fakeouts.
There’s not much we can do about the former (this is somewhat countered by weekly price showing room to move north anyway). The latter, however, can potentially be avoided by waiting for additional H4 candle confirmation before pulling the trigger – a H4 full or near-full-bodied bull candle would suffice (stops positioned beneath the candle’s rejection tail).
Today’s data points: Limited.
Dow Jones Industrial Average:
Weekly Gain/Loss: -0.03%
Weekly Closing price: 25410
Weekly perspective:
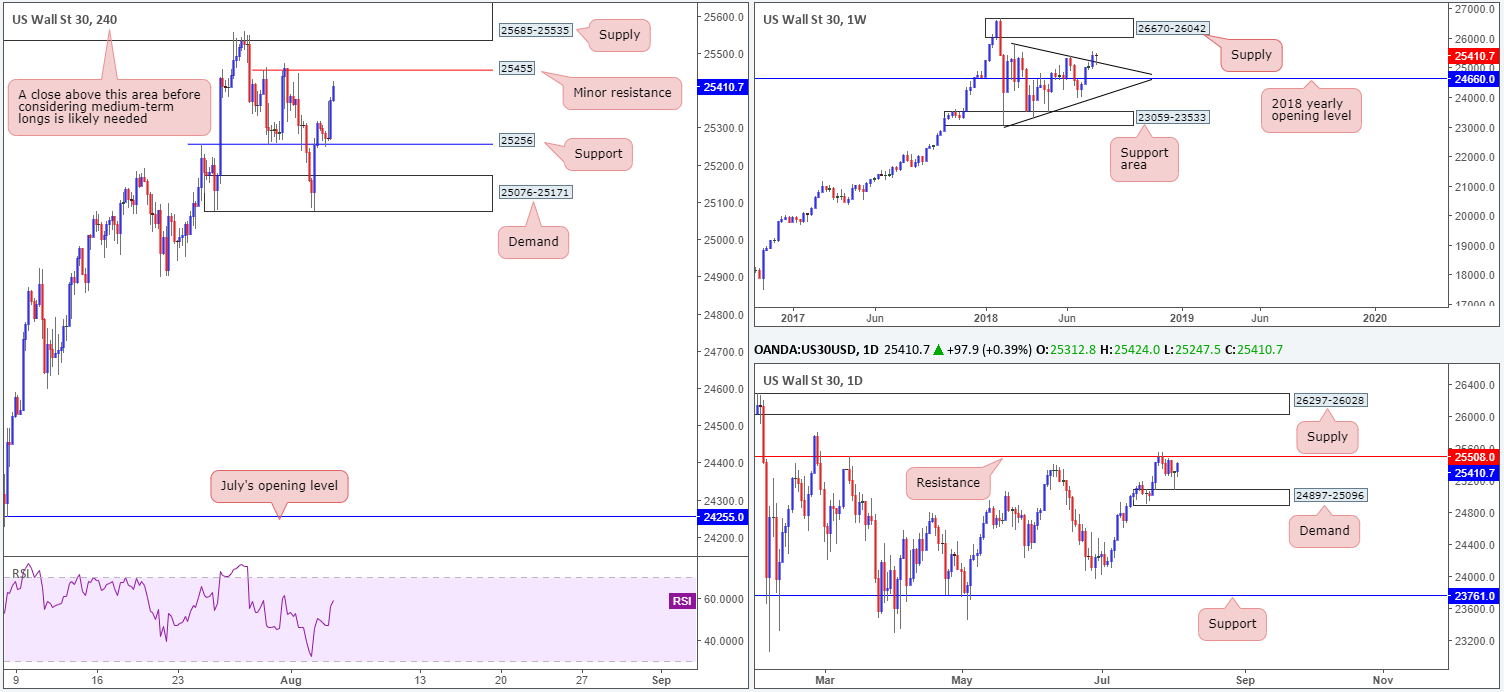
In recent sessions, we observed the index retest a recently broken trend line resistance-turned support (etched from the high 25807) in the shape of a reasonably nice-looking bullish pin-bar formation. From this point, a run up to supply coming in at 26670-26042 is a possible scenario to keep tabs on this week.
Daily perspective:
Demand at 24897-25096 held firm on Thursday, printing a bullish pin-bar pattern. Price extended its gains on Friday from here, consequently wrapping the week up within touching distance of resistance seen at 25508. Should this level be taken out this week, structure displays limited active supply until we reach 26297-26028: an area that’s glued to the underside of the weekly supply mentioned above at 26670-26042.
H4 perspective:
For those who read Friday’s morning briefing you may recall the team highlighted a possible retest play off support at 25256, targeting minor H4 resistance at 25455 as the initial take-profit level. As you can see, the move played out as expected, and concluded the day closing just south of the noted H4 resistance. Well done to any of our readers who managed to jump aboard this move!
Areas of consideration:
With weekly action indicating additional bullish sentiment, and daily flow hovering nearby resistance, neither a long nor short seems attractive right now. It’s also worth mentioning upside structure is amplified by intraday resistance seen on the H4 timeframe at 25455, followed closely by H4 supply at 25685-25535 (positioned just above the current daily resistance).
Technically speaking, waiting for H4 price to CLOSE above the current supply zone before considering longs in this market (from current price that is) is a logical route. A retest to the top edge of this zone that holds firm will likely be enough to draw in buyers and bring the unit towards the aforesaid weekly supply, and is therefore a viable long to keep eyes on going forward.
Today’s data points: Limited.
XAU/USD (Gold)
Weekly Gain/Loss: -0.76%
Weekly Closing price: 1214.4
Weekly perspective:
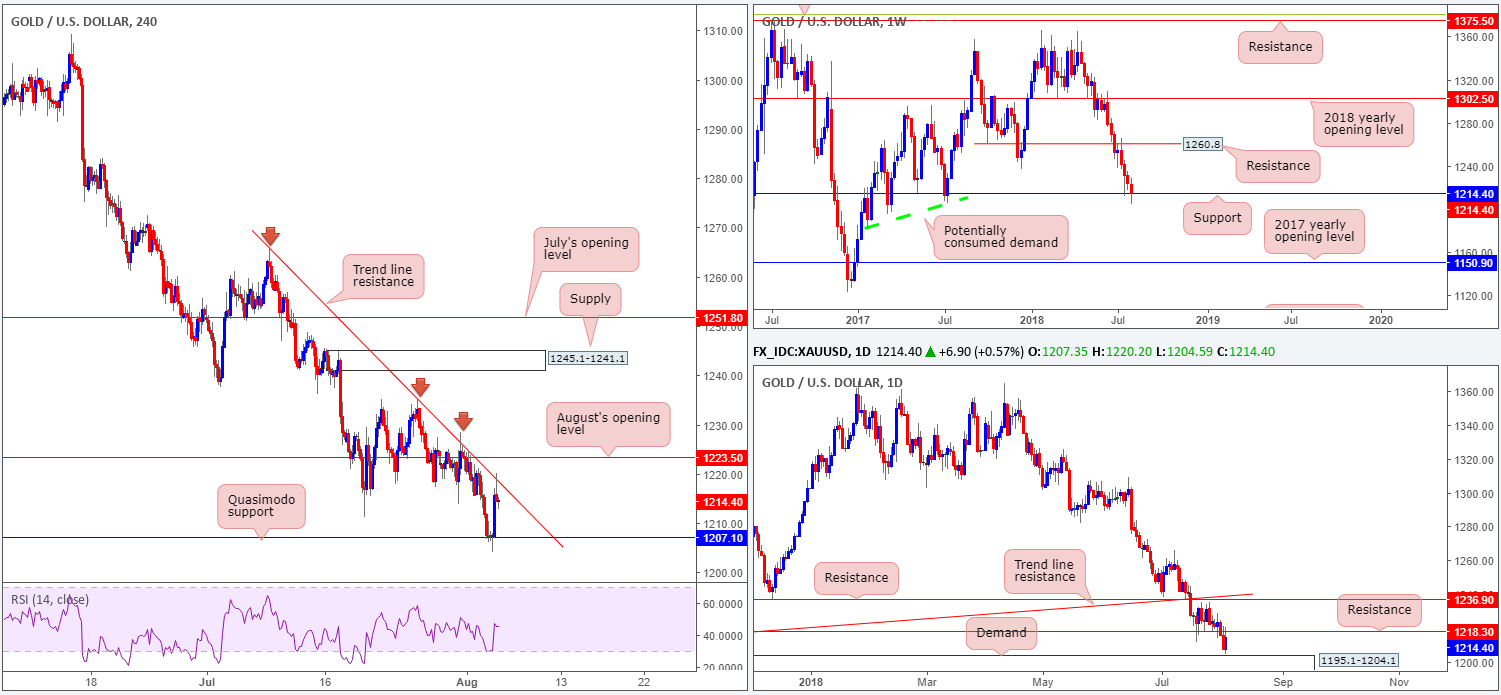
Recording its fourth consecutive losing week, the price of gold managed to pierce through support at 1214.4 and clock lows of 1204.5 last week. Though the market managed to recover from the said lows and close to-the-pip at the noted support, stop-loss orders below this level have likely been triggered. A close beneath 1214.4 would, in our technical opinion, open up the possibility for further downside as far south as the 2017 yearly opening level at 1150.9. Note there’s limited active demand to the left of current price between these two levels.
Daily perspective:
After crunching through support at 1218.3, the metal headed for demand at 1195.1-1204.1. As you can see, though, price failed to shake hands with this area before turning north and retesting 1218.3 as resistance. Areas outside of these barriers to have noted fall in at resistance drawn from 1236.9 and demand at 1171.1-1185.0 (not seen on the screen).
H4 perspective:
Quasimodo support at 1207.1 surprisingly held its ground amid trade on Friday, lifting the yellow metal towards nearby trend line resistance (taken from the high 1265.9). Those who read Friday’s report may recall the team highlighting this trend line resistance as a possible sell, as daily price showed resistance at 1218.3 converging closely with the descending line.
Areas of consideration:
As shown on the H4 chart, the trend line resistance has so far held price lower in the shape of a bearish pin-bar candle formation, but whether it will continue to hold going into today’s sessions is difficult to judge since weekly buyers may push price action higher to challenge August’s opening level at 1223.5. It is our opinion, however, lower prices will eventually be seen, owing to buyers’ stops likely triggered from beneath weekly support at 1214.4.
Shorts based on the H4 bearish pin-bar candle formation, therefore, could be an option today (stop-loss orders best placed above the candle’s wick). Apart from the H4 Quasimodo support seen nearby at 1207.1, the next downside support target can be seen around the top edge of daily demand at 1204.1.
The use of the site is agreement that the site is for informational and educational purposes only and does not constitute advice in any form in the furtherance of any trade or trading decisions.
The accuracy, completeness and timeliness of the information contained on this site cannot be guaranteed. IC Markets does not warranty, guarantee or make any representations, or assume any liability with regard to financial results based on the use of the information in the site.
News, views, opinions, recommendations and other information obtained from sources outside of www.icmarkets.com.au, used in this site are believed to be reliable, but we cannot guarantee their accuracy or completeness. All such information is subject to change at any time without notice. IC Markets assumes no responsibility for the content of any linked site. The fact that such links may exist does not indicate approval or endorsement of any material contained on any linked site.
IC Markets is not liable for any harm caused by the transmission, through accessing the services or information on this site, of a computer virus, or other computer code or programming device that might be used to access, delete, damage, disable, disrupt or otherwise impede in any manner, the operation of the site or of any user’s software, hardware, data or property.


