
A note on lower timeframe confirming price action…
Waiting for lower timeframe confirmation is our main tool to confirm strength within higher timeframe zones, and has really been the key to our trading success. It takes a little time to understand the subtle nuances, however, as each trade is never the same, but once you master the rhythm so to speak, you will be saved from countless unnecessary losing trades. The following is a list of what we look for:
- A break/retest of supply or demand dependent on which way you’re trading.
- A trendline break/retest.
- Buying/selling tails/wicks – essentially we look for a cluster of very obvious spikes off of lower timeframe support and resistance levels within the higher timeframe zone.
- Candlestick patterns. We tend to only stick with pin bars and engulfing bars as these have proven to be the most effective.
We search for lower timeframe confirmation between the M15 and H1 timeframes, since most of our higher-timeframe areas begin with the H4. Stops are usually placed 5-10 pips beyond confirming structures.
EUR/USD:
Weekly gain/loss: – 41 pips
Weekly closing price: 1.1151
Weekly opening price: 1.1156
Weekly view: The past week saw the EUR extended losses from the major resistance area seen at 1.1533-1.1278. Seeing as how this zone has managed to cap upside since May 2015, further selling is likely on the cards. The next downside target to have an eye on this week falls in around the 1.0970 region, followed closely by a major support seen at 1.0819.
Daily view: As things stand on the daily chart, however, the candles remain loitering within a support area coming in at 1.1224-1.1072. A break below this hurdle (and its merging trendline taken from the low 1.0516) will likely see a continuation move down to a support area at 1.0909-1.0982, which, as you can see, hovers just above the aforementioned weekly support level. Conversely, a rotation from here could prompt this unit to connect with supply drawn from 1.1446-1.1369.
H4 view: Friday’s US employment report came in below expectations, which initially saw the EUR gravitate to highs of 1.1252. However, as can be seen from the chart, price failed to sustain gains beyond the mid-way point 1.1250 and collapsed around 100 pips, closing the week just ahead of demand seen at 1.1131-1.1143.
Direction for the week: While we expect further consolidation to take place within the current daily support area, we feel pressure from the overhead weekly supply will eventually push prices south to test the daily support area mentioned above at 1.0909-1.0982.
Direction for today: With both US and Canadian banks closed in observance of Labor Day, we feel price may enter into a phase of consolidation around the nearby H4 demand at 1.1131-1.1143. Eventually, however, the single currency will likely probe lower to test the 1.11 handle. This number – coupled with the H4 support at 1.1075 (green circle) as well as its fusing H4 trendlines (1.1427/1.0951) may be enough to trigger a small bounce north this week.
Our suggestions: A decisive close below the current H4 demand followed by a retest is, given the position of price on the weekly chart (see above), sufficient enough to condone an intraday sell, targeting the 1.11 band. Furthermore, should this come to fruition, watch for lower timeframe confirmed (see the top of this report for lower timeframe entry techniques) buying opportunities around the 1.1075/1.11 region for an intraday move north.
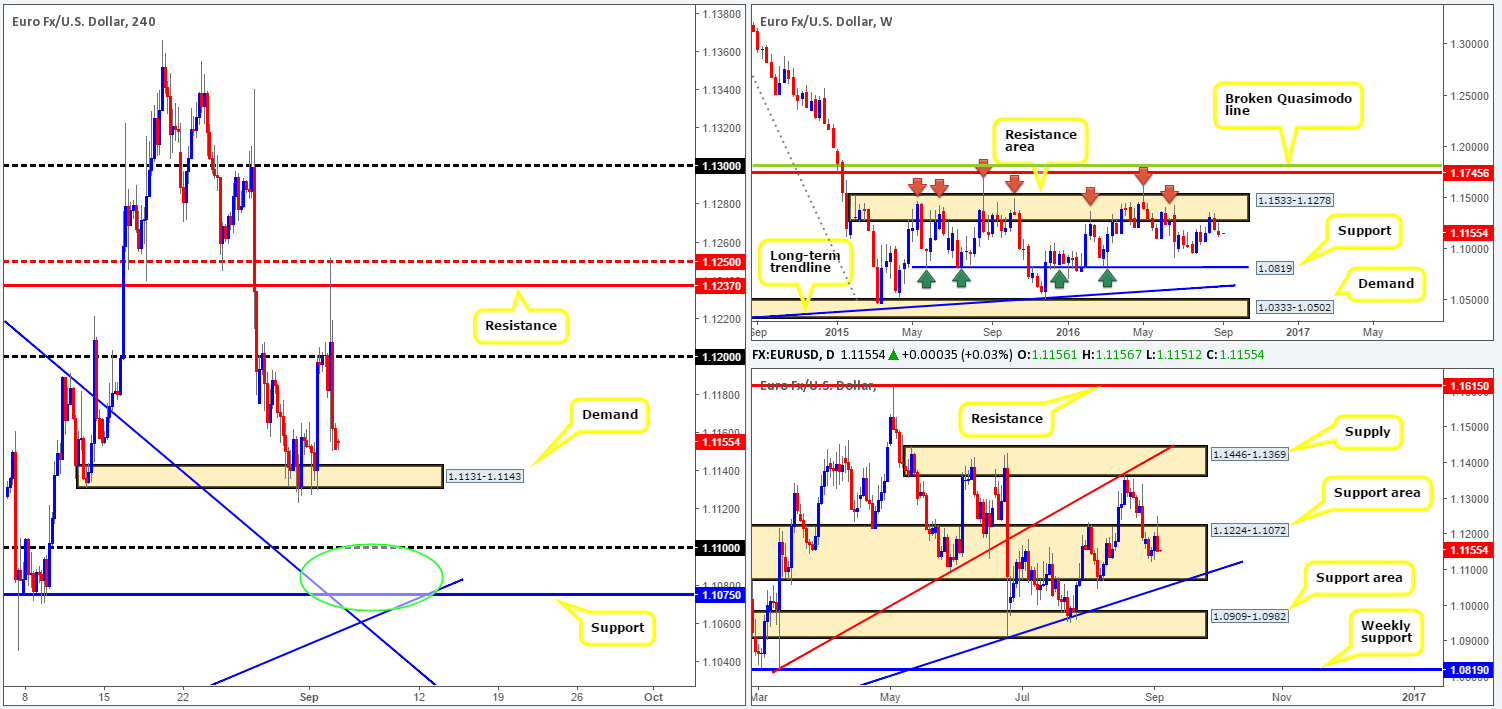
Levels to watch/live orders:
- Buys: 1.1075/1.11 [tentative – confirmation required] (Stop loss: dependent on where one confirms this area).
- Sells: Watch for price to close below the H4 demand at 1.1131-1.1143 and then look to trade any retest seen thereafter.
GBP/USD:
Weekly gain/loss: + 161 pips
Weekly closing price: 1.3289
Weekly opening price: 1.3291
Weekly view: Over the course of the last two months, we’ve seen the GBP/USD begin to put in a bottom around the 1.2942 region. In addition to this, along with the pair posting its third consecutive bull candle last week, price looks all set to extend north up to the resistance area logged in at 1.3501-1.3804.
Daily view: The story on the daily chart, however, shows that the daily candles recently connected with supply coming in at 1.3371-1.3279, and printed a relatively nice-looking bearish selling wick. Before considering a sell from here though, we’d urge you to consider the fact that there’s a slightly more attractive supply zone sitting directly above at 1.3533-1.3426. Not only is this area glued to the underside of the aforementioned weekly resistance area but it also sports a daily AB=CD approach (see chart).
H4 view: The impact of Friday’s US employment report saw cable rally north. However, similar to EUR/USD, the pair was unable to sustain gains beyond the mid-way resistance level 1.3350, and ended the week closing beyond the 1.33 figure, and also within touching distance of a H4 support area at 1.3290-1.3242.
Direction for the week: Although price could still enter into a sell off, to our way of seeing things it’s highly possible that this market will continue northbound towards the daily supply area mentioned above at 1.3533-1.3426.
Direction for today: Given US and Canadian bank holidays the unit will likely range between the 1.33 handle and the H4 support area at 1.3290-1.3242. Tuesday’s action, nevertheless, is likely to see a breach of 1.33 and a continuation move north to test at least NFP-induced highs.
Our suggestions: Should the market close above 1.33 and hold firm as support, one could look to begin entering long, preferably using lower timeframe confirmation (see the top of this report). As we outlined above, the overall target for longs would be the underside of the daily supply at 1.3426.
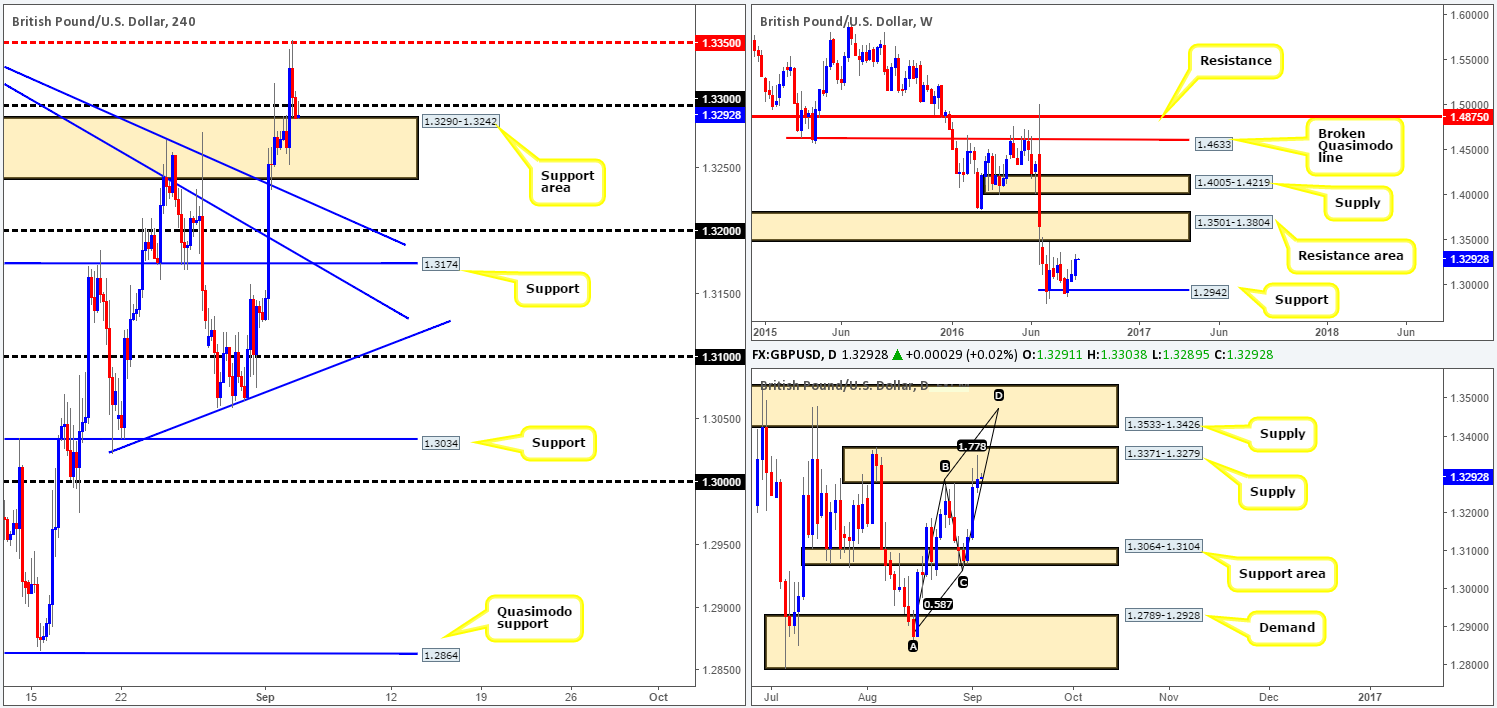
Levels to watch/live orders:
- Buys: Watch for price to close above the 1.33 handle and then look to trade any retest seen thereafter (waiting for lower timeframe confirmation is preferable).
- Sells: Flat (Stop loss: n/a).
AUD/USD:
Weekly gain/loss: + 8 pips
Weekly closing price: 0.7566
Weekly opening price: 0.7568
Weekly view: Despite the week ranging around 125 pips, as well as retesting the underside of a recently broken support at 0.7604, the pair closed the week relatively unchanged. In view of the current indecision candle, our team still feels that a move south down to the support area at 0.7438-0.7315 is on the horizon.
Daily view: From this angle, a rather nice-looking selling wick was printed on Friday off the back of the aforementioned weekly resistance level, which, as you can see from here, fuses with a trendline extended from the low 0.7148. Given this, the pair is likely to sweep lower to test the support area coming in at 0.7517-0.7451 (sits only a few pips above the current weekly support area).
H4 view: A quick recap of Friday’s session on the H4 chart shows that the commodity currency gravitated higher on the back of poor US employment data. This rally, however, was a short-lived one as prices found resistance around the 0.76 handle (ties in with channel resistance taken from the high 0.7759) and concluded trade for the week just ahead of the mid-way support 0.7550.
Direction for the week: Well, in light of the higher-timeframe structures there’s likely going to be downside move posted this week. Be that as it may, once price shakes hands with the above said daily support area we could see a bout of consolidation take place, and even a slight correction.
Direction for today: The Aussie will likely go on to attack the 0.7550 region today. Should price close beyond this number, a continuation move south will likely be seen down to the 0.75 handle.
Our suggestions: Watch for a decisive close beyond 0.7550. Should this come into view, and price retests the underside of this level along with lower timeframe confirmation (see the top of this report), we would look to short this market, targeting 0.75. For all that though, do remain aware that prices could potentially stall ahead of 0.75 given the top edge of the daily support area sits at 0.7517.
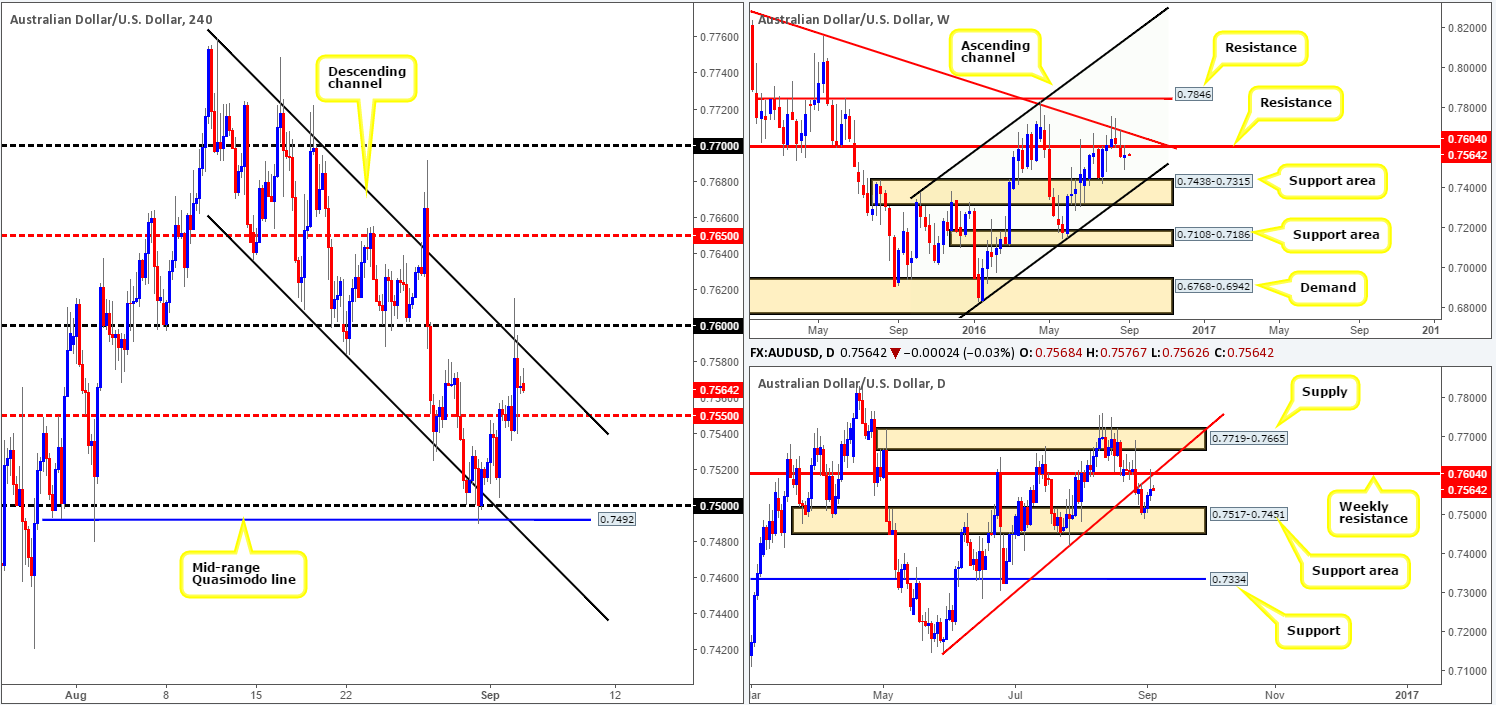
Levels to watch/live orders:
- Buys: Flat (Stop loss: n/a).
- Sells: Watch for price to close below the mid-way support 0.7550 and then look to trade any retest seen thereafter (lower timeframe confirmation required).
USD/JPY:
Weekly gain/loss: + 212 pips
Weekly closing price: 103.87
Weekly opening price: 104.08
Weekly view: Resistance at 103.22 was, as you can see, aggressively taken out during last week’s session, leaving the market open to further upside this week to the resistance area coming in at 105.19-107.54. The other key thing to note here is that market participants should be prepared for the possibility that price may retest 103.22 as support prior to an advance north.
Daily view: Over on the daily chart, we can see that Friday’s action chalked up a clear-cut bullish engulfing candle around a resistance area registered at 103.50-103.89. In the event that the buyers follow through here, we could see prices lifted up to the resistance area drawn from 106.81-106.22 (positioned within the above noted weekly resistance area).
H4 view: A brief look at recent dealings on the H4 chart shows that price initially pierced through the 103 handle shortly after the US labor market reported a lower than expected reading. Following this, however, we saw the pair spring back and rally over 100 pips to touch gloves with the 104 handle going into the close.
Direction for the week: Should price remain above the current weekly support hurdle at 103.22 this week, it’s likely a rally north will take place at least until price hits the weekly resistance area mentioned above at 105.19-107.54.
Direction for today: In light of the US/Canadian bank holidays today we feel price will meander around the 104 handle. However, should a decisive close be seen above this number, the next areas to watch are the 104.50 region (merges with a H4 61.8% Fib at 104.45) and the 105 handle, which sits only 20 pips below the current weekly resistance area!
Our suggestions: Look for a close above 104. This – coupled with a retest, is in our opinion, enough to condone a long position, targeting 104.50, followed closely by the 105 hurdle. From here, we’d look to unwind long positions and begin considering shorts due to the nearby weekly resistance area.
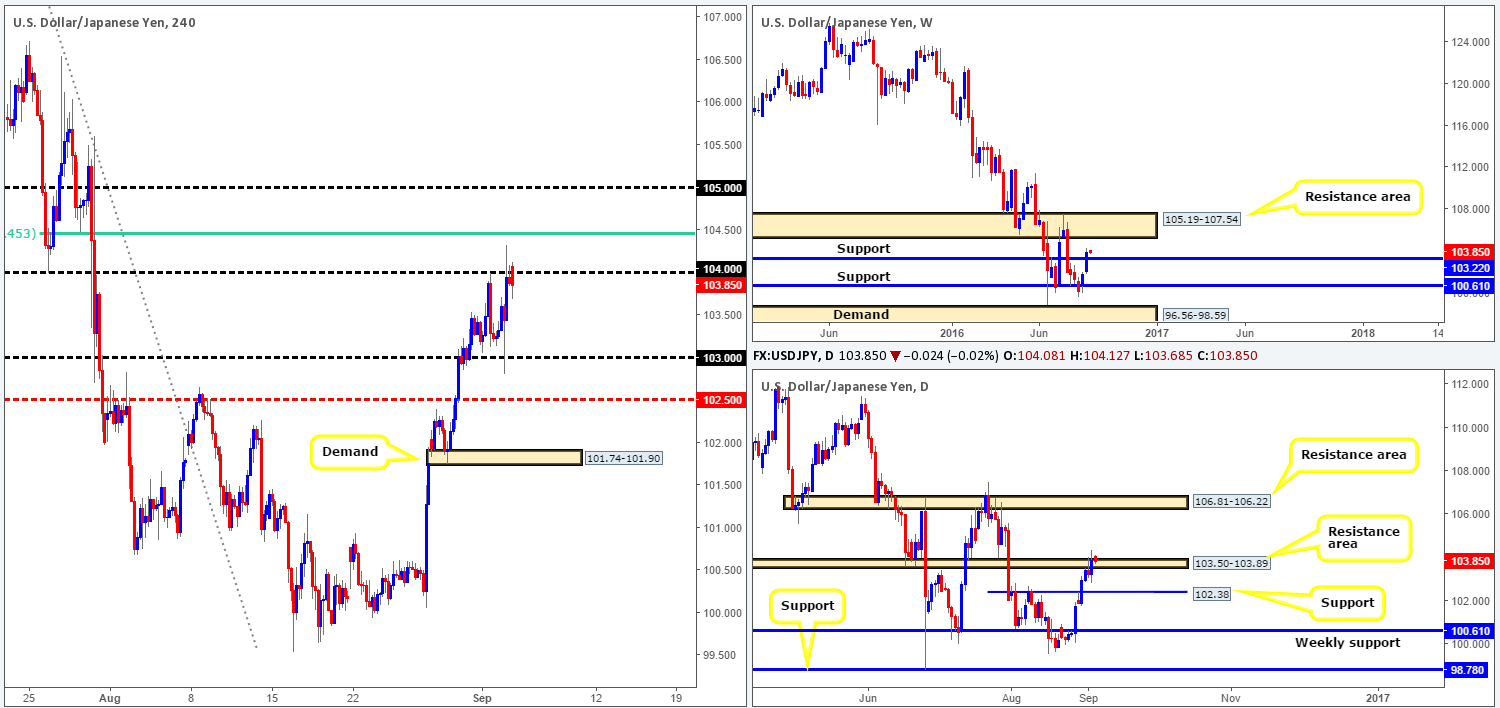
Levels to watch/live orders:
- Buys: Watch for price to close above the 104 handle and then look to trade any retest seen thereafter.
- Sells: Flat (Stop loss: n/a).
USD/CAD:
Weekly gain/loss: – 15 pips
Weekly closing price: 1.2981
Weekly opening price: 1.2982
Weekly view: During the course of last week’s session, a beautiful-looking selling wick was chalked up from within a supply zone at 1.3295-1.3017. From our point of view, this move could possibly encourage further selling this week and bring the pair down to a trendline support extended from the high 1.1278 (intersects beautifully with a Fib support line at 1.2649).
Daily view: With the weekly picture in mind, we can also see that price ended the week closing beyond a minor support level at 1.3001. Assuming that this line now acts as resistance, price could push on down to the support area marked at 1.2653-1.2753, which sits directly above the aforementioned weekly Fib support line.
H4 view: The after-effects of Friday’s US jobs report saw the loonie aggressively tumble lower, taking out both the H4 support area at 1.3079-1.3065 and also the key figure 1.30. In addition to this, traders may have also noted that additional support was seen over in the oil market around the 94.69ish range, consequently fuelling Friday’s descent.
Direction for the week: Through the simple lens of a technical trader, the more likely path is south due to where price is positioned on the higher-timeframe picture.
Direction for today: With 1.30 now clear, the mid-way support 1.2950 will likely be the next target on the hit list. However, with both the US and Canada vacationing today the pair may stagnate.
Our suggestions: Watch for price to retest 1.30 again. If this comes into view and a H4 bearish close is seen, we feel this is sufficient enough to permit a short position, targeting 1.2950 as one’s initial take-profit zone. According to the higher timeframes, however, 1.2750 is an ideal final take-profit target given that it sits directly above the daily support area at 1.2653-1.2753.
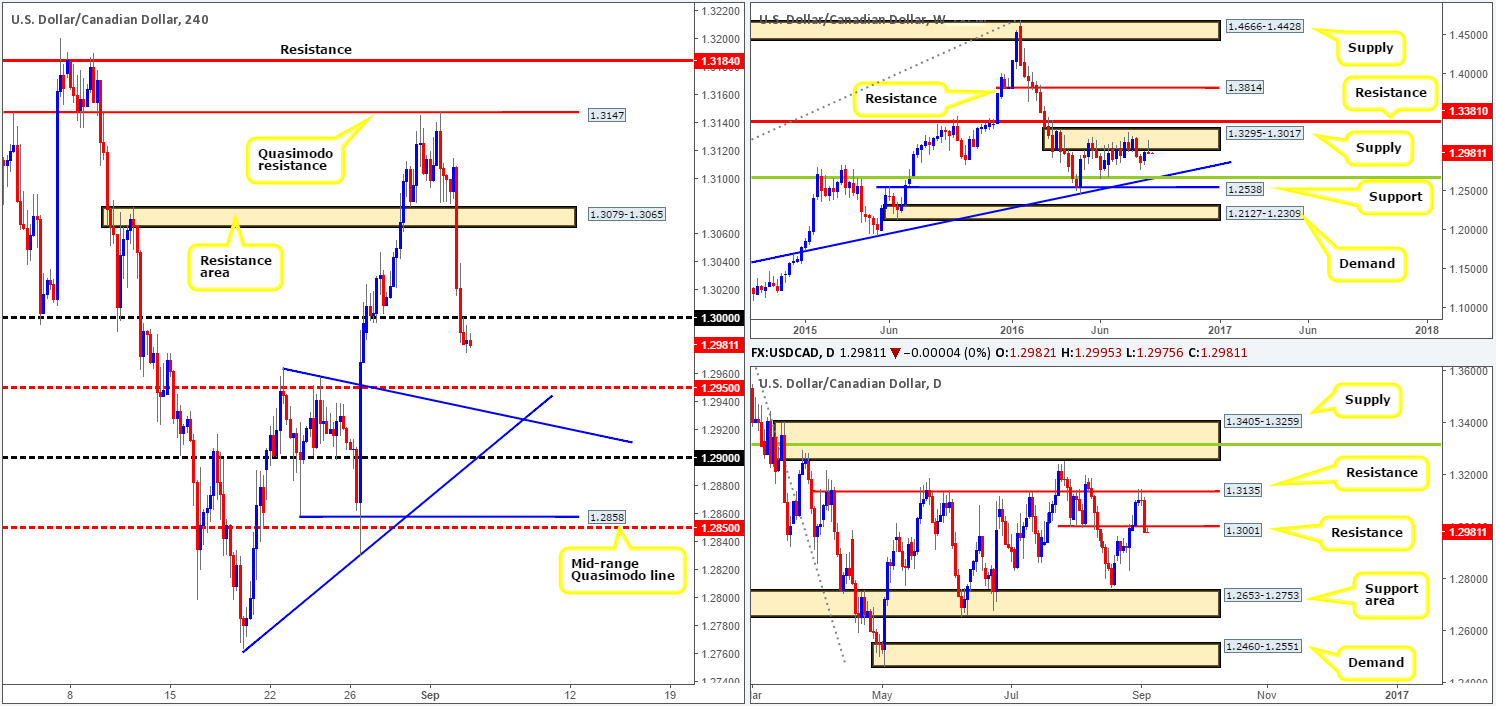
Levels to watch/live orders
- Buys: Flat (Stop loss: n/a).
- Sells: 1.30 region [watch for a H4 bearish close off of this number] (Stop loss: preferably beyond the bearish trigger candle).
USD/CHF:
Weekly gain/loss: + 22 pips
Weekly closing price: 0.9800
Weekly opening price: 0.9796
Weekly view: After a rather aggressive move north two weeks ago, the Swissy found renewed selling interest last week just ahead of supply seen at 1.0092-0.9928. Despite this, there is still a good chance that the pair could extend above last week’s high to connect with this supply area. Failing this, a bout of selling in this market could bring prices back down to 0.9508: a support level which intersects with a trendline support extended from the low 0.8703.
Daily view: Turning our attention to the daily candles, the support area at 0.9819-0.9784 remains intact, despite last week’s selling. A rally from this zone could prompt buyers to tag the supply zone seen at 0.9956-0.9921 (glued to the underside of the aforementioned weekly supply). Conversely, a violation of the current support area would likely stimulate a decline down towards the support area drawn from 0.9648-0.9708.
H4 view: Despite US labor conditions reporting a disappointing month, the pair traded flat going into the day’s close. A knee-jerk reaction to the report, however, forced prices to break through the H4 support 0.9762, but, as you can see, lost ground was quickly recovered back up to the 0.98 region.
Direction for the week: Personally we believe the Swissy has a little more gas in the tank yet, and will see a rally up to the aforementioned daily supply zone.
Direction for today: Should price manage to find a foothold above 0.98, we feel prices may stretch up to at least 0.9841: a H4 Quasimodo resistance level. However, do keep in mind that both the US and Canada are on vacation today, so movement could potentially be sluggish.
Our suggestions: The only area that really jumps out to us this morning is 0.99. Now, don’t get us wrong, the H4 Quasimodo at 0.9841 could hold prices lower, but 0.99 is, by far, still the more attractive zone. Here’s why:
- Sits thirty pips below the underside of weekly supply at 1.0092-0.9928.
- Merges with a H4 trendline resistance taken from the high 0.9841.
- Boasts a H4 88.6% Fib resistance at 0.9901.
Therefore, as long as one is comfortable placing there stops above the high 0.9950, a pending sell order could be placed at 0.9899.
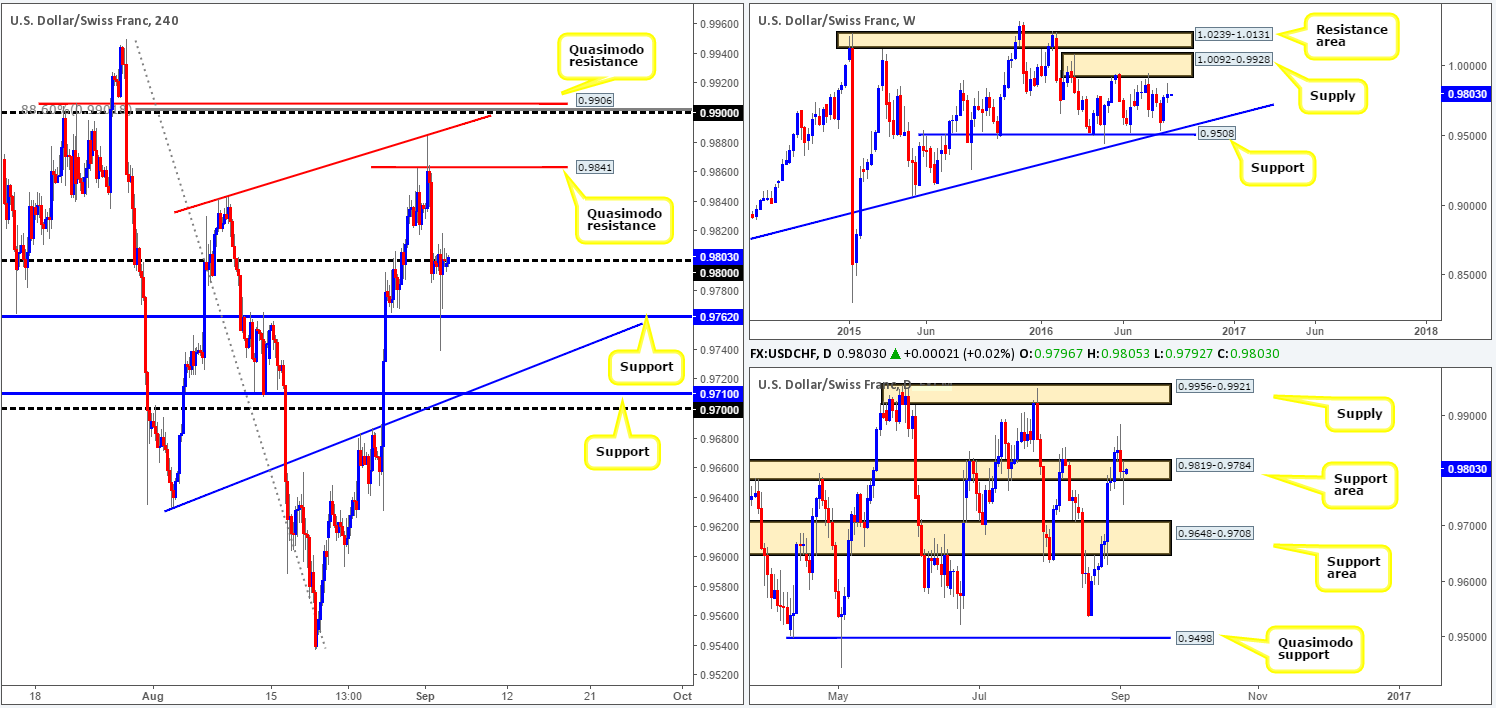
Levels to watch/live orders:
- Buys: Flat (Stop loss: N/A).
- Sells: 0.9899 [pending order] (Stop loss: 0.9952).
DOW 30:
Weekly gain/loss: + 86 points
Weekly closing price: 18489
Weekly opening price: 18489
Weekly view: From the top, we can see that weekly movement rotated from the top edge of a support area seen at 18365-18158 last week. This – coupled with the DOW currently entrenched within a strong uptrend could potentially force price to challenge the all-time high 18668 this week.
Daily view: Daily price on the other hand is presently trading mid-range between 18322/18636. Nevertheless, we’re confident that the index will, given the weekly picture, attack the top-side of this range sometime this week, and quite possibly close above it!
H4 view: Despite a disappointing NFP print on Friday, US stocks aggressively advanced to highs of 18547, consequently stabbing through supply at 18524-18503. With sellers now likely cleared from this zone and breakout buyers likely still in play, we may see H4 price gravitate towards the nearby Quasimodo resistances at 18579/18599.
Direction for the week: With the predominant trend in place, the weekly support area and also space to move north on the daily chart, we feel there is only one way this unit is heading this week and that is northbound.
Direction for today: A close above the current H4 supply area is likely going to be seen within the next few candles. Following this, we see no reason, except that the US is on vacation today and price may be slow, why prices will not extend up to the above said H4 Quasimodos.
Our suggestions: Watch for a decisive push above the current H4 supply. This, along with a strong retest should be enough to condone a long entry, targeting 18579. If this comes to fruition, we would personally look at holding some of this position past this target, since there’s potential for this market to break all-time highs here!
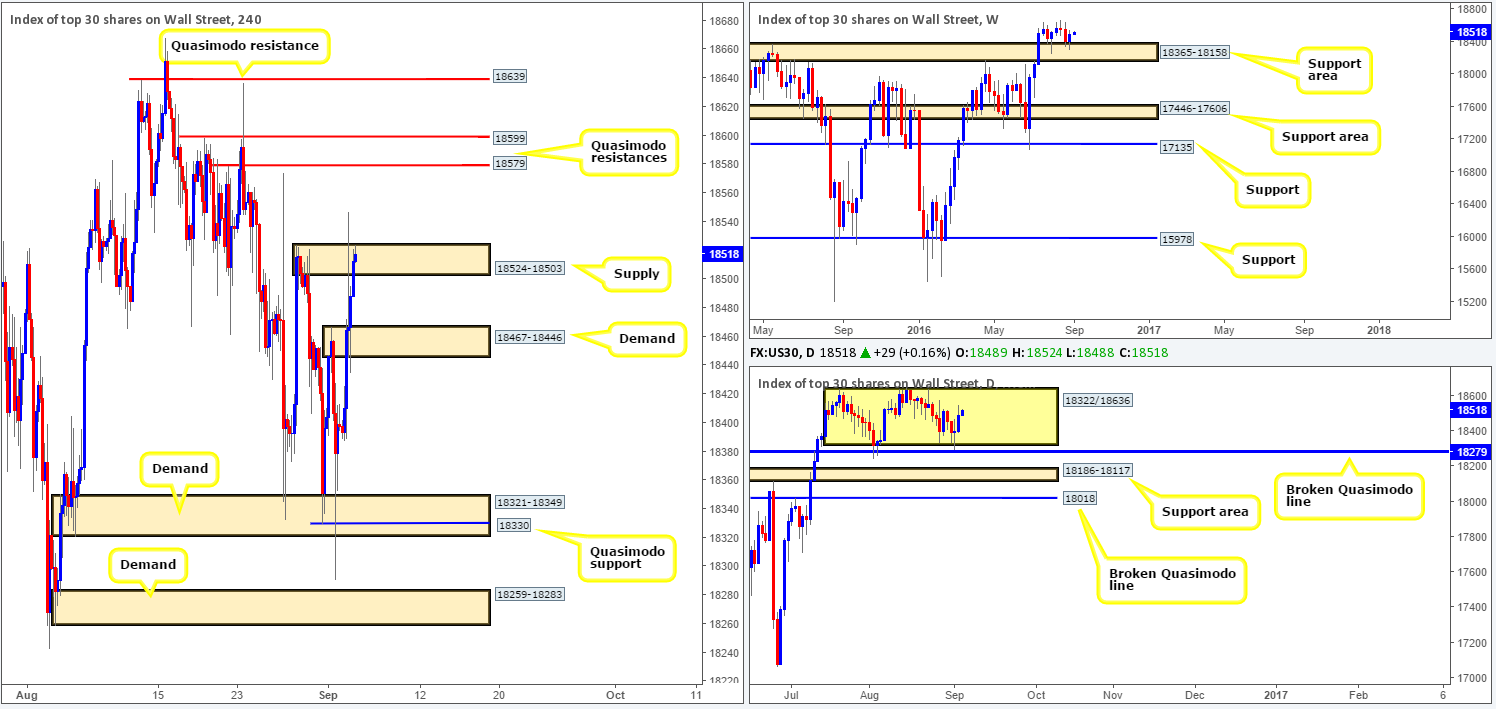
Levels to watch/live orders:
- Buys: Watch for price to close above the H4 supply at 18524-18503 and then look to trade any retest seen thereafter.
- Sells: Flat (Stop loss: N/A).
GOLD:
Weekly gain/loss: + $3.6
Weekly closing price: 1323.6
Weekly opening price: 1323.6
Weekly view: A stronger than expected rebound from the support area at 1307.4-1280.0 was seen last week. This, as you can see, forced price to print a rather attractive buying tail, which could, given where price bounced from, lead to further buying this week. The next upside target from this angle can be seen at 1361.7: a Quasimodo resistance level.
Daily view: Thursday’s fakeout beyond the demand zone at 1305.3-1322.8, as can be seen from the chart, propelled prices higher on Friday. In view of the large wick seen marked with a green arrow at 1342.2, we feel most of the supply above current price is consumed. Therefore, the next barrier of resistance we have on our watchlist is 1354.6.
H4 view: Friday’s action saw the yellow metal shoot north on Friday, boosted by lower than expected US employment data. This move aggressively spiked through supply seen at 1325.3-1322.8 and has since fell into a phase of consolidation. With the sellers likely cleared out from this area, and breakout buyers still hanging on in there, we could see a surge in buying up to resistance at 1332.3, followed by supply at 1344.5-1341.0 and then the aforementioned daily resistance level.
Direction for the week: In view of what’s been noted on the higher timeframes, the price of gold will likely appreciate during the week.
Direction for today: Given the US and Canadian bank holiday’s today, we see price consolidate between the current H4 supply and the H4 support area at 1315.6-1319.6. In the event that bullion does decide to break higher today though, keep an eye on the 1332.3 band.
Our suggestions: Quite simply either watch for a close above the current H4 supply area followed by a strong retest to buy, targeting 1332.3, or if price drops lower to test the current H4 support area, one could then begin hunting for lower timeframe entries into the market (see the top of this report for entry techniques), as the overhead supply is likely to be severely weakened now.
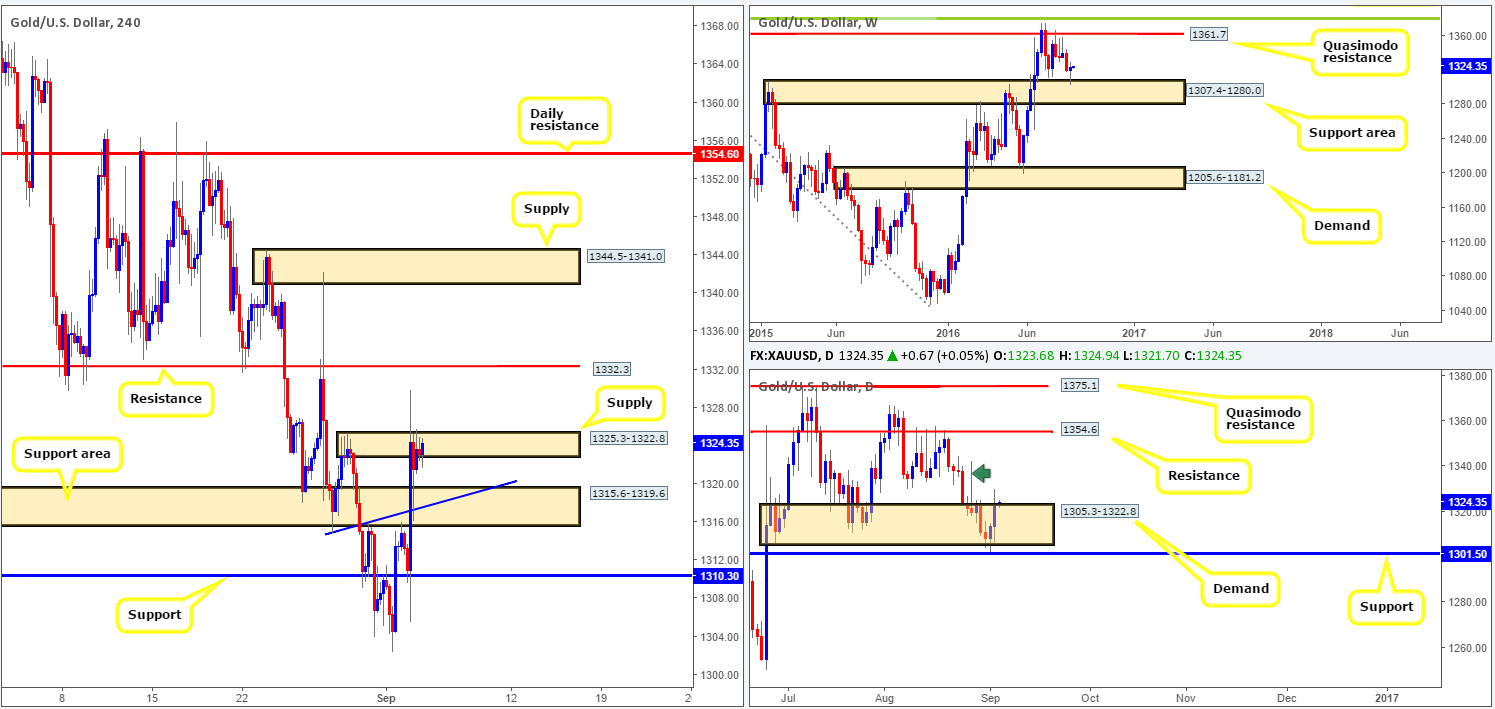
Levels to watch/live orders:
- Buys: Watch for price to close above the H4 supply at 1325.3-1322.8 and then look to trade any retest seen thereafter. 1315.6-1319.6 [tentative – confirmation required] (Stop loss: dependent on where one confirms this area).
- Sells: Flat (Stop loss: N/A).


