
A note on lower timeframe confirming price action…
Waiting for lower timeframe confirmation is our main tool to confirm strength within higher timeframe zones, and has really been the key to our trading success. It takes a little time to understand the subtle nuances, however, as each trade is never the same, but once you master the rhythm so to speak, you will be saved from countless unnecessary losing trades. The following is a list of what we look for:
- A break/retest of supply or demand dependent on which way you’re trading.
- A trendline break/retest.
- Buying/selling tails – essentially we look for a cluster of very obvious spikes off of lower timeframe support and resistance levels within the higher timeframe zone.
- Candlestick patterns. We tend to only stick with pin bars and engulfing bars as these have proven to be the most effective.
EUR/USD:
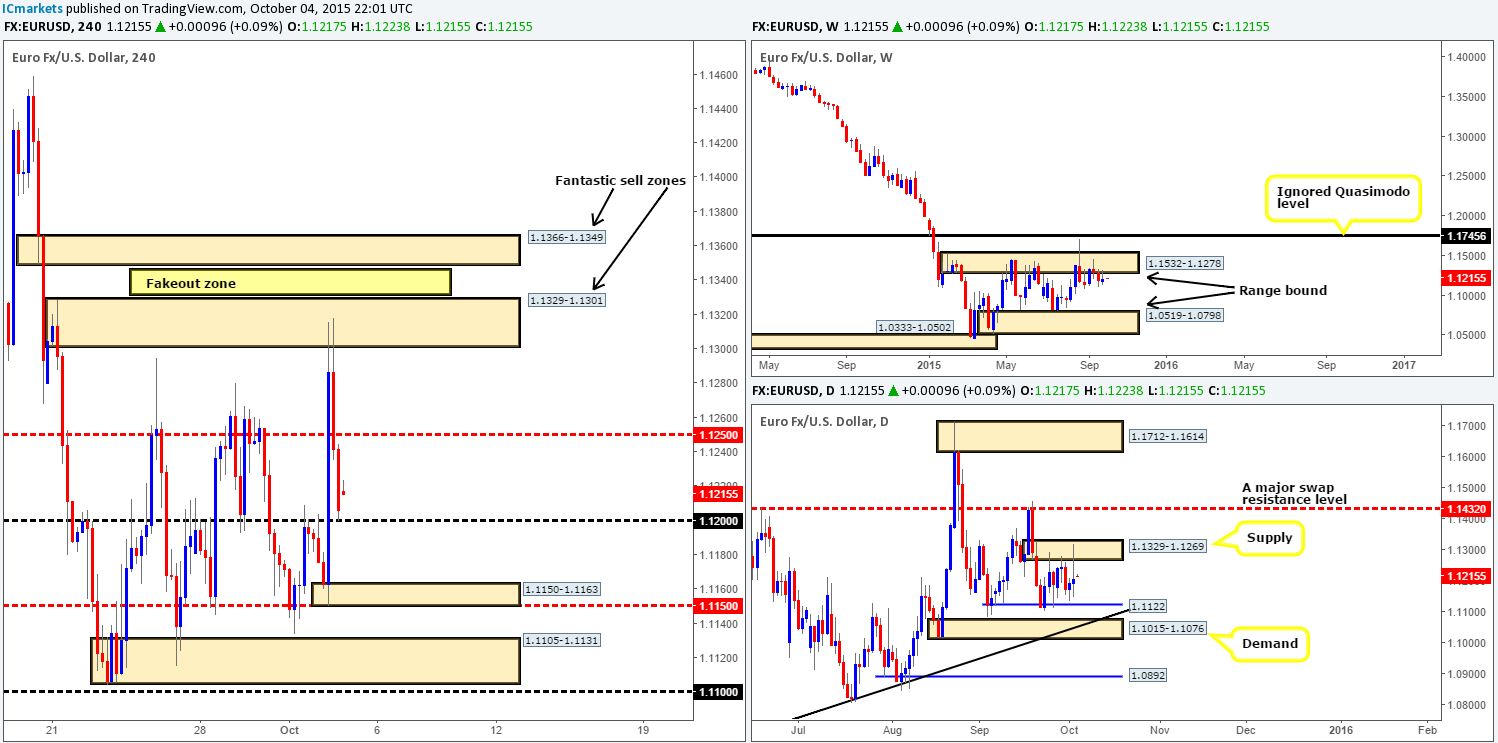
Weekly view: From this angle, we can see that the EUR/USD remained relatively unchanged last week, closing only a mere fifteen pips higher than the prior weekly close close at 1.1205. Although market action printed a relatively nice-looking selling tail off the underside of supply drawn from 1.1532-1.1278, there’s been very little change seen on this timeframe. For five weeks now this market has been and continues to range around the aforementioned supply area.
Should price break above this zone in the coming week, the next objective to reach can be seen at 1.1745 – an ignored Quasimodo level. On the flip side, a continuation move lower would possibly see prices drive deeper into the weekly range down as far as demand coming in at 1.0519-1.0798.
Weekly levels to watch this week fall in at: 1.1532-1.1278/1.1745.
Daily view: Turning our attention to the daily timeframe shows that price remained confined between supply at 1.1329-1.1269 and support taken from 1.1122 during trade last week. Should weekly sellers muster enough strength from supply this week, we could see this support consumed and price attack demand just below it at 1.1015-1.1076. Not only is this barrier fresh, it also converges nicely with an ascending trendline extended from the low 1.0319. Conversely, a push above the current daily supply may very well force this market to connect with a major swap resistance level at 1.1432 (positioned within the aforementioned weekly supply).
Daily levels to watch this week fall in at: 1.1329-1.1269/1.1432/1.1122/1.1015-1.1076.
4hr view: Friday’s U.S. jobs report showed 142k jobs were added to the economy in the month of September, falling short of the forecasted projection 201k. This, of course, set the EUR on fire! Price bounced from the mid-level support 1.1150, aggressively punching through offers at 1.1200 and 1.1250, before finally reaching fresh supply at 1.1329-1.1301 which saw this market reverse over a 100 pips by the weeks end.
Going forward, little activity was seen during the weekend as the pair began the week calmly with a small twelve-pip gap north at 1.1217 this morning. With regards to today’s upcoming sessions, this market, in our opinion, has the potential to move either way. Just below current price, we have psychological support 1.1200, and below this, there’s an NFP-formed demand sitting at 1.1150-1.1163. Both areas are somewhere an intraday bounce north is possible. However, do take into account that price is still loitering around the underside of weekly supply (see above) so these areas could easily break. Waiting for lower timeframe confirmation here is highly recommended! Furthermore, directly below these two buy zones sits another demand at 1.1105-1.1131, which is certainly an interesting area since it ties in nicely with daily support mentioned above at 1.1122.
Above current price, however, there’s both mid-level resistance 1.1250 and 4hr supply at 1.1329-1.1301 (located within daily supply at 1.1329-1.1269) to consider today. Nevertheless, judging how far price drove into this supply zone on Friday, a ton of supply/offers was likely consumed. As such, should this market rally today/this week, do be prepared for a fake above here to a small fresh supply coming in at 1.1366-1.1349.
Levels to watch/live orders:
- Buys: 1.1200 [Tentative – confirmation required] (Stop loss: depending on where one confirms this level) 1.1105-1.1131 [Tentative- confirmation required] (Stop loss: dependent on where one confirms this area) 1.1105-1.1131 [Tentative- confirmation required] (Stop loss: dependent on where one confirms this area).
- Sells: 1.1250 [Tentative- confirmation required] (Stop loss: dependent on where one confirms this area) 1.1329-1.1301/1.1366-1.1349 [Tentative- confirmation required] (Stop loss: dependent on where one confirms these two areas).
GBP/USD:
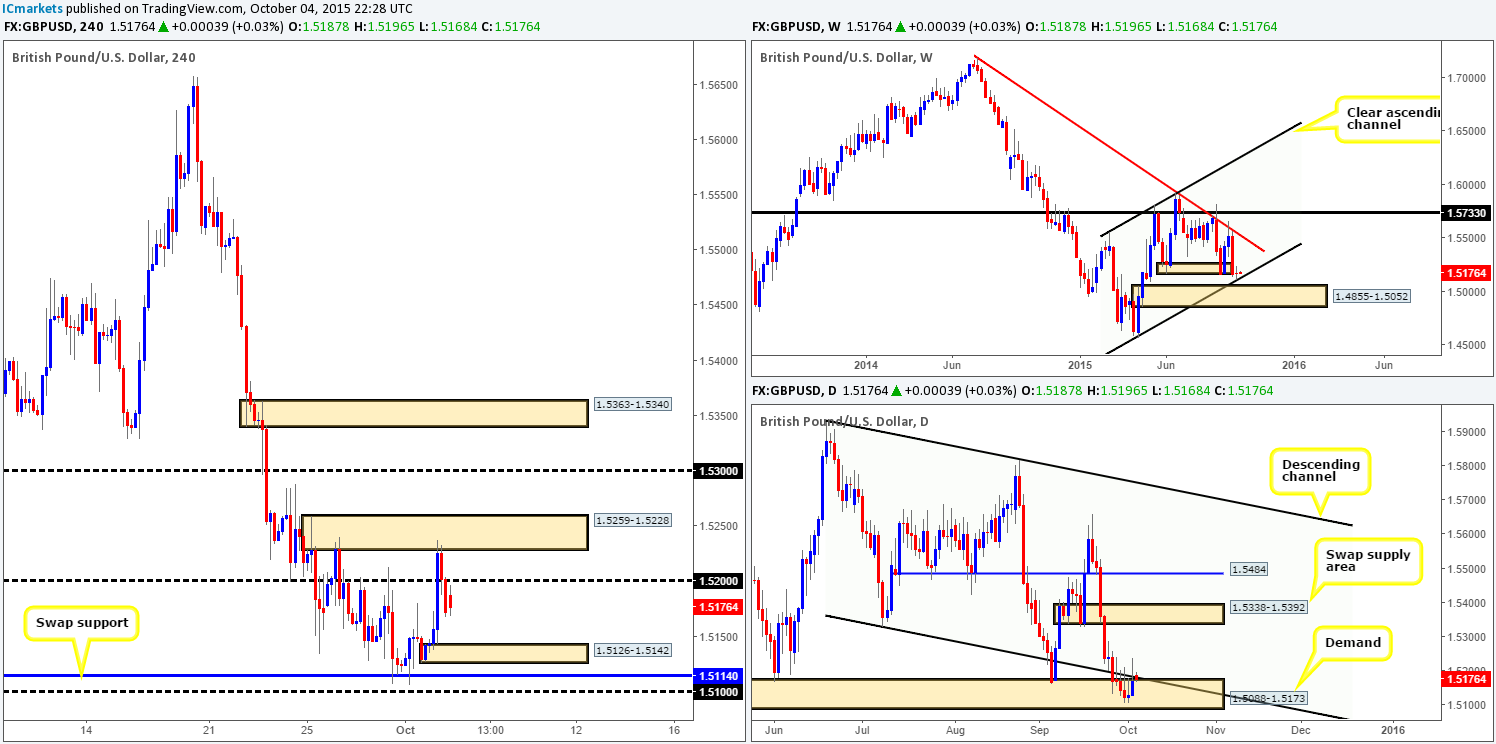
Weekly view: There was absolutely no change seen during last week’s trade as price closed at 1.5172, a mere pip above the prior week’s close. This, as a consequence, printed a very clear indecision candle. Price did, however, break below demand at 1.5169-1.5260 and connect with channel support (1.4564), as reported may happen in our previous weekly analysis.
Given the fact that there were active buyers lurking at the above said channel support, we believe this could encourage further buying in this market this week, potentially binging prices back up to the trendline resistance taken from the highs 1.7190.
Weekly levels to watch this week fall in at: Channel support (1.4564)/Trendline resistance (1.7190).
Daily view: Daily action shows that Cable appears to be carving out at bottom deep within demand seen at 1.5088-1.5173. Despite this, before this market can advance from here, offers at the underside of the recently broken channel support (now resistance) taken from the low 1.5329 must be consumed. Should this occur, the runway north will possibly be clear up to swap supply drawn at 1.5338-1.5392.
Daily levels to watch this week fall in at: 1.5088-1.5173/Underside of channel support (1.5329)/ 1.5338-1.5392.
4hr view: Friday’s trade on the 4hr scale was similar to that of the EUR/USD. An NFP-induced rally sent this market higher, breaking through offers at psychological resistance 1.5200 and connecting nicely with supply at 1.5259-1.5228, which sent price back below 1.5200 to end the week.
Pushing forward, Cable opened fifteen pips higher this morning at 1.5187, and has, at the time of writing, seen a small ripple of offers trickle into this market. With price seen trading from support on the weekly chart, and battling between demand and resistance on the daily chart (see above), here’s a list of areas we have our eye on today on the 4hr timeframe:
Buys:
- Demand seen at 1.5126-1.5142 may be good for a bounce today, since this was formed during NFP, hence there may still be some unfilled orders present within this region.
- The 1.5114 swap support. This level beautifully rebounded price last week due to its higher timeframe convergence, thus we see little reason for it not to do the same today/this week.
Sells:
- Psychological resistance 1.5200 could be somewhere to consider trading from today.
- Supply at 1.5126-1.5142, which coincides with the aforementioned daily channel resistance currently holding the market lower.
Levels to watch/ live orders:
- Buys: 1.5114 region [Tentative – confirmation required] (Stop loss: dependent on where one confirms this level). 1.5126-1.5142 [Tentative – confirmation required] (Stop loss: dependent on where one confirms this area).
- Sells: 1.5200 [Tentative – confirmation required] (Stop loss: dependent on where one confirms this level) 1.5259-1.5228 [Tentative – confirmation required] (Stop loss: dependent on where one confirms this area).
AUD/USD:
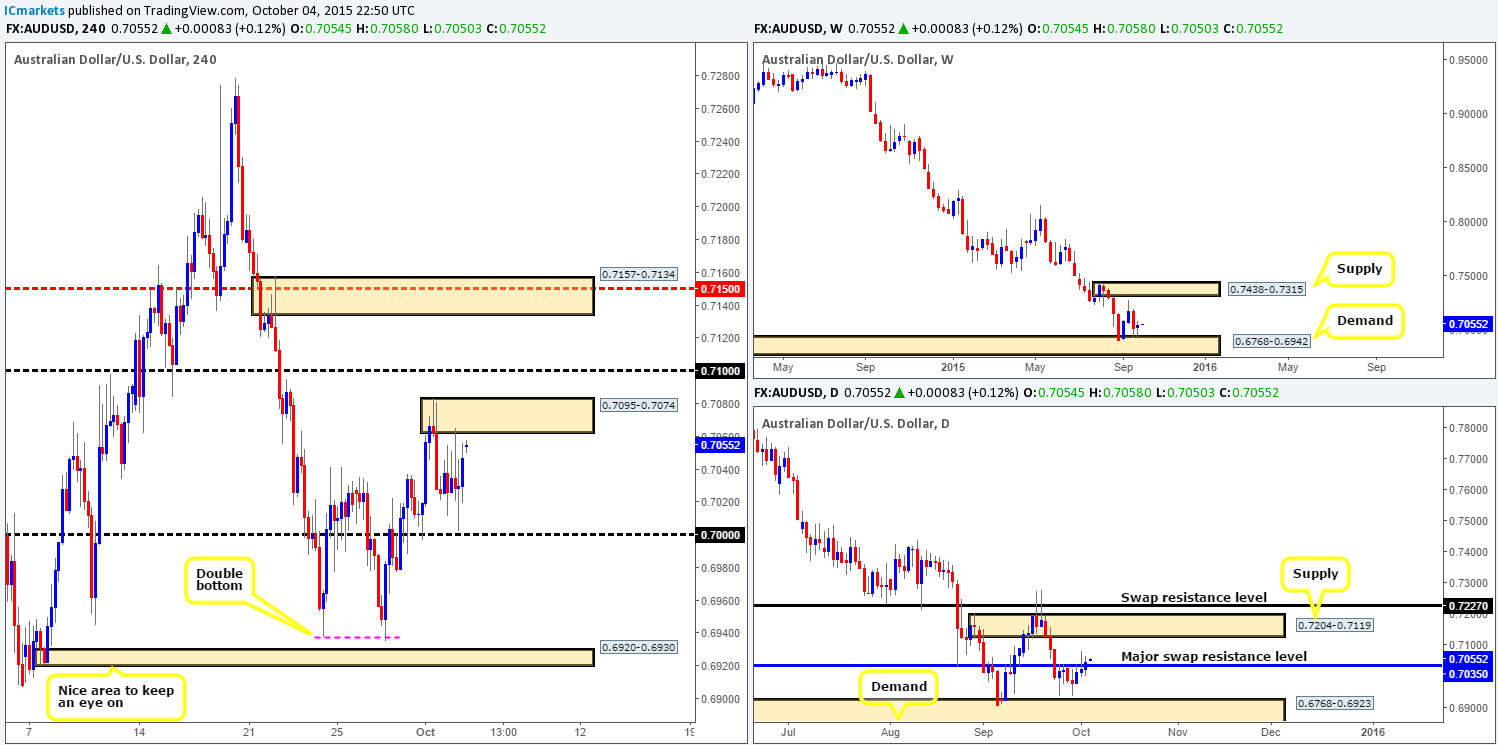
Weekly view: Demand at 0.6768-0.6942 continued to support this market last week, consequently pushing price in the green by twenty or so pips at the close 0.7046. Whether this area can remain a supportive structure this week is very difficult to judge, seeing as this pair remains in a humongous downtrend at present. On the assumption that this zone does give way in the near future, the next area we have in our sights is demand at 0.6284-0.6525.
Weekly levels to watch this week fall in at: 0.6768-0.6942/0.6284-0.6525.
Daily view: The recent advance seen from the above said weekly demand barrier forced price to close above a major swap resistance level at 0.7035 by the weeks end. In the event that the buyers can maintain a position above here this week, we might, just might, see price challenge supply at 0.7204-0.7119, followed closely by 0.7227 – another swap resistance hurdle.
Daily levels to watch this week fall in at: 0.7035/0.7204-0.7119/0.7227.
4hr view: From here, we can see there was certainly some indecision in the market during trade on Friday even with the mighty NFP news event. Price found resistance at a small minor supply at 0.7095-0.7074 and also support from just above the large psychological number 0.7000.
Breaking into a new week shows the market opened a little higher this morning at 0.7054, bringing price within touching distance of the aforementioned supply. Now, taking into account the position of price on the higher timeframes right now (see above), it’s very possible we’re going to see this market continue to appreciate this week. This is certainly not to say a short from the above said supply is not going to work out, all we’re implying here is that traders should be prepared for a possible break or even a spike above to psychological resistance 0.7100. Ideally, for us, it would be great to see price to head back down to 0.7000 and fakeout lower today, as this would be a beautiful buy considering where it sits on the higher timeframes (see above).
Levels to watch/ live orders:
- Buys: 0.7000 [Tentative – confirmation required] (Stop loss: dependent on where one confirms this level).
- Sells: 0.7083-0.7062 [Tentative – confirmation required] (Stop loss: dependent on where one confirms this area) 0.7100 [Tentative – confirmation required] (Stop loss: dependent on where one confirms this level).
USD/JPY:
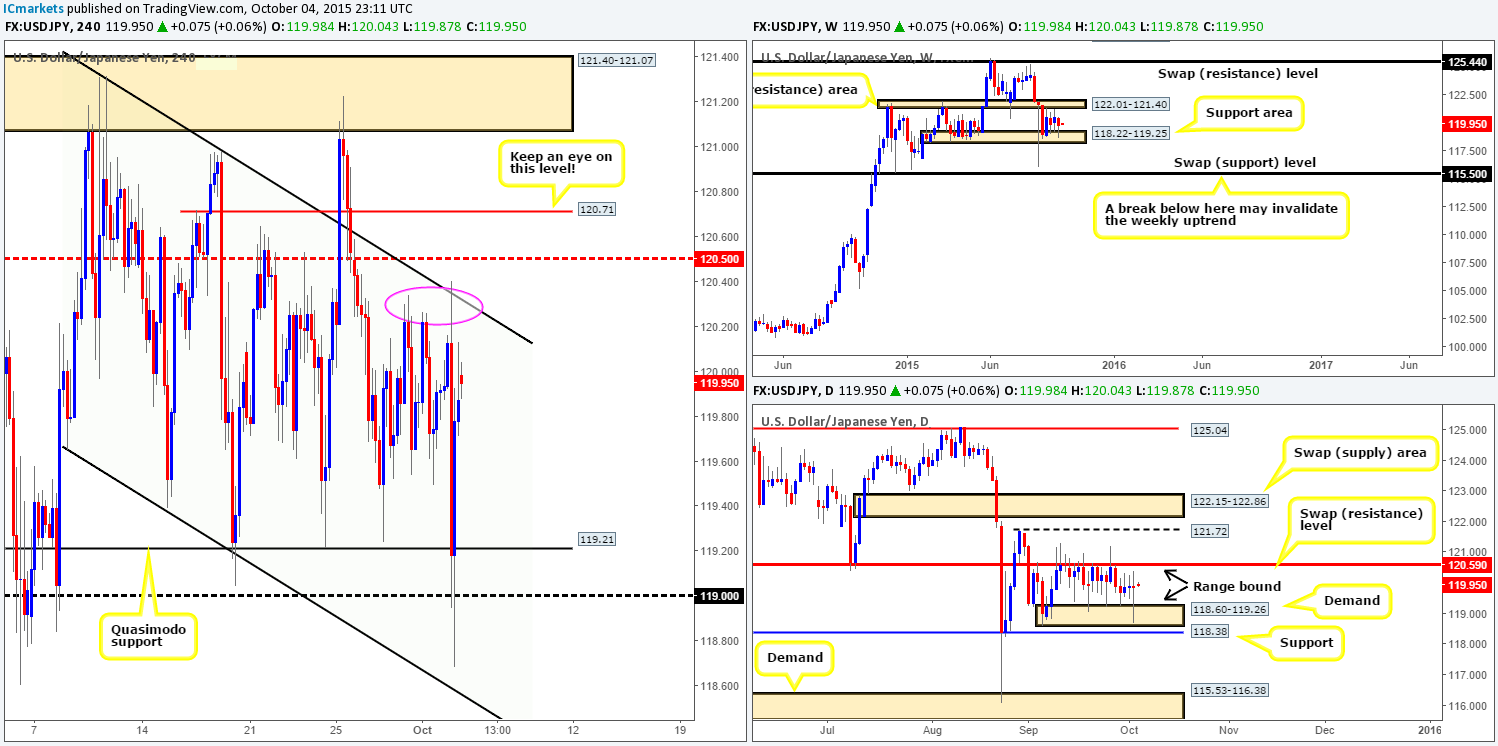
Weekly view: As can be seen from the chart, there’s once again very little to report on last week’s action. Market activity continued to trade in between a swap resistance zone at 122.01-121.40 and a support area drawn from 118.22-119.25.
Weekly levels to watch this week fall in at: 122.01-121.40/118.22-119.25.
Daily view: With little change being seen on the weekly timeframe last week, we can see that price also remained confined on this timeframe between demand at 118.60-119.26 and a swap resistance level at 120.59. A breakout above here this week would likely see this market head towards at least swing resistance at 121.72, followed closely by a swap supply zone at 122.15-122.86. On the other hand, a push lower would immediately see price shake hands with support coming in at 118.38.
Daily levels to watch this week fall in at: 118.60-119.26/118.38/120.59/121.72/122.15-122.86.
4hr view: A disappointing U.S. jobs report sent this pair tumbling lower spiking through both Quasimodo support at 119.21/psychological support 119.00 and nearly connecting with the descending channel support taken from the low 119.65. However, the majority of losses from this NFP dive were quickly erased as price reversed and aggressively rallied north into the close 119.87.
This morning’s open 119.98 saw a small eleven-pip gap print on the chart, which consequently has made very little difference to the overall structure of this pair. Since we’re receiving little Intel from the higher timeframe structures right now, other than of course, price is range bound, here are some intraday levels we have our eye on today (lower timeframe confirmation required):
Buys:
- Quasimodo support at 119.21/psychological support 119.00 (converges with the lower limit of the daily range, demand at 118.60-119.26). This area has been, and, in our opinion, continues to be the ‘floor’ of this market for the time being.
Sells:
- Channel resistance extended from the high 121.31. Be careful here traders, as fakeouts are common around the extremes of channel formations!
- Mid-level number 120.50. This barrier, as you can see, ties in beautifully with the upper limit of the daily range, 120.59, making it an area likely to see a bounce. Furthermore, checkout the highs just below it circled in pink (120.34/120.40) which line up perfectly with the aforementioned downward channel. Traders will be looking to fade these highs and place their stops just above, which will in turn form a beautiful pool of liquidity for daily sellers to short into! Hence our reason for expecting the fakeout of the current channel.
Levels to watch/ live orders:
- Buys: 119.21/119.00 [Tentative – confirmation required] (Stop loss: dependent on where one confirms this area).
- Sells: Downward channel resistance taken from the high 121.31 (120.50 [Tentative – confirmation required] (Stop loss: dependent on where one confirms this level).
USD/CAD:
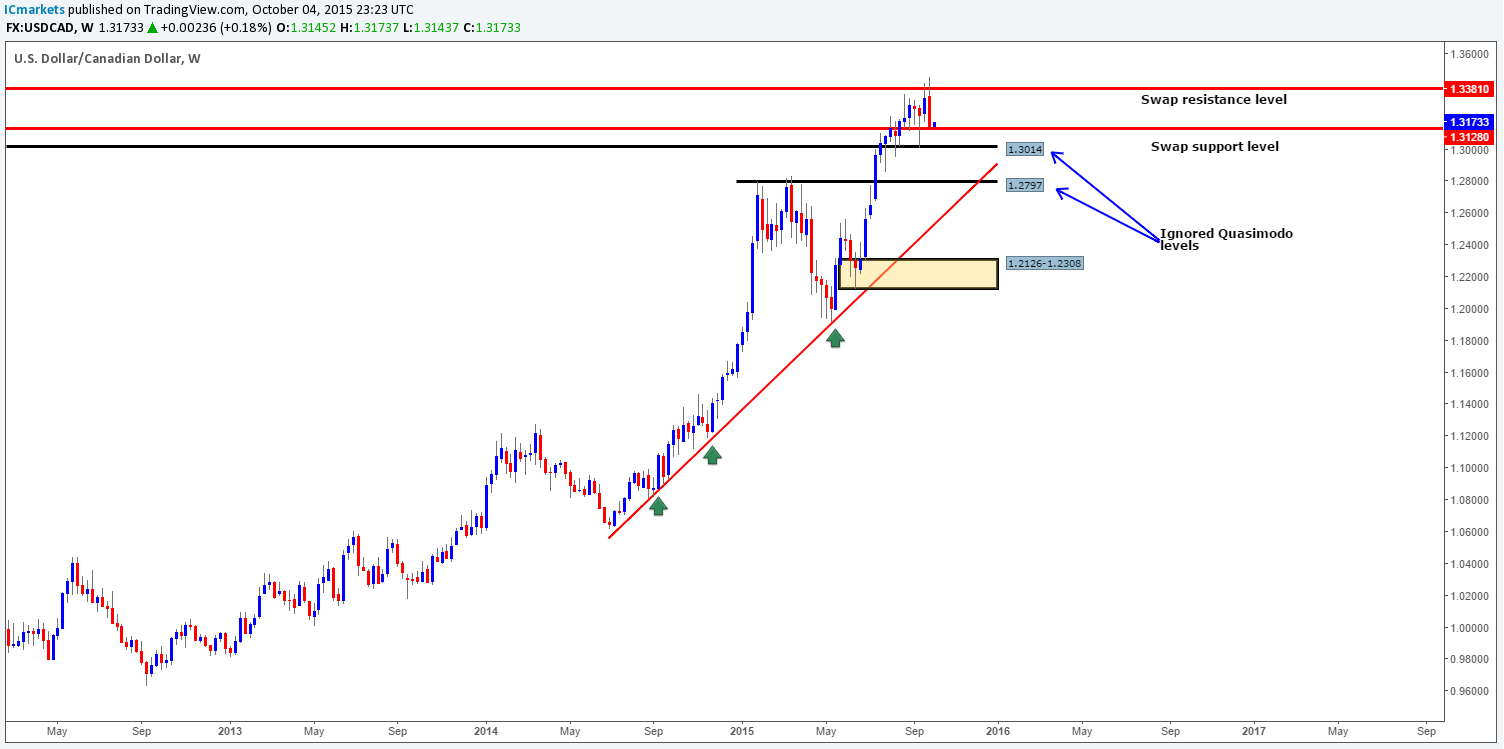
Weekly view: The USD/CAD suffered a relatively nasty decline in value last week from 1.3381, losing around 180 pips into the close 1.3149 and erasing any gains accrued over the past five weeks. The aftermath of this sell-off pulled this market down to within shouting distance of a swap support level given at 1.3128. Assuming that price shakes hands with this boundary this week, a bounce may be seen here. Nevertheless, traders need to be prepared for the possibility that price may fake lower to the ignored Quasimodo level at 1.3014 before an advance takes place from here as we saw happen three weeks ago.
Weekly levels to watch this week fall in at: 1.3128/1.3014/1.3381.
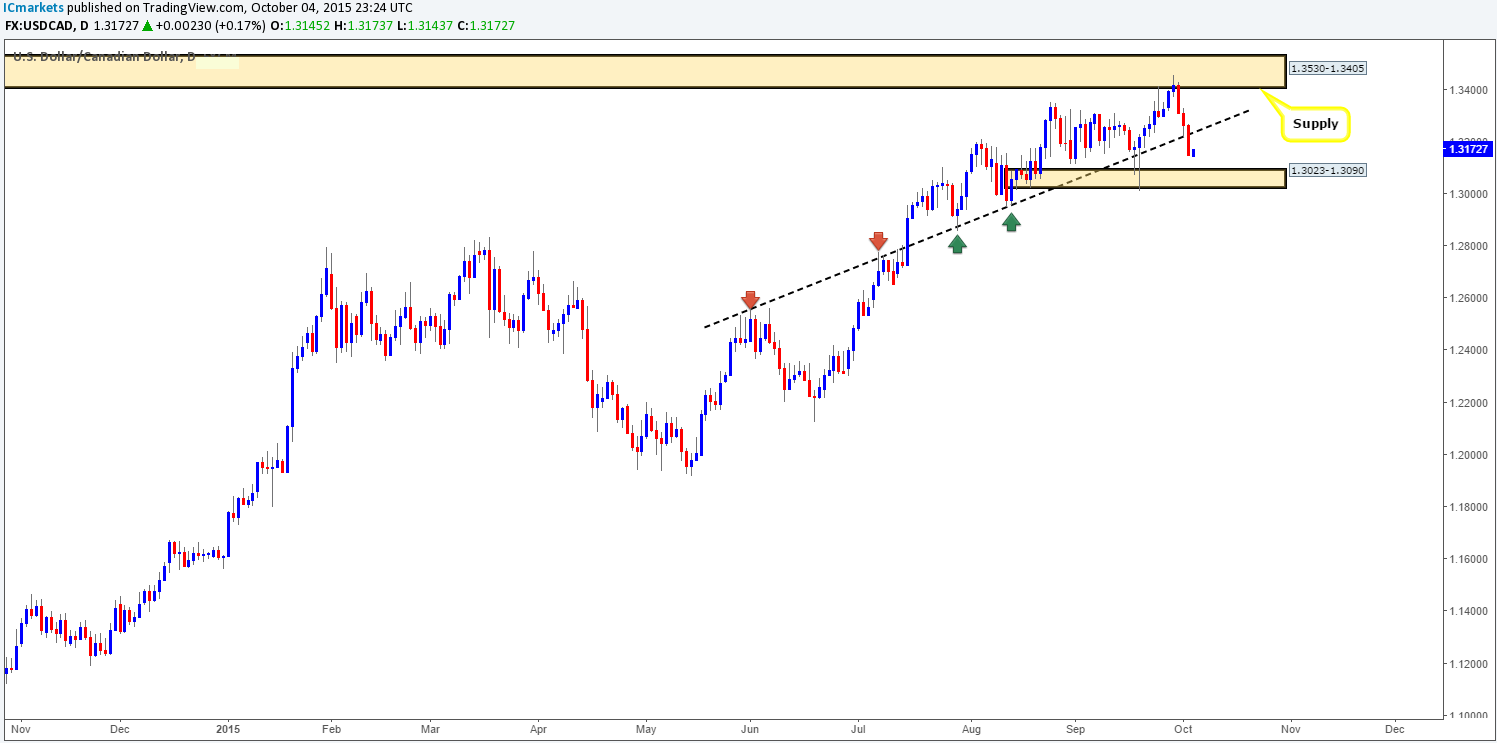
Daily view: From this viewpoint, it’s clear to see that the sell-off stemmed from the underside of supply coming in at 1.3530-1.3405. This, as you can see, eventually took out bids sitting at the ascending trendline drawn from 1.2562, closing with a full-bodied bearish candle sixty or so pips from a support barrier seen at 1.3023-1.3090 by the week’s end. Considering that this barrier sits nicely in between the aforementioned weekly swap (support) level and ignored Quasimodo support, this is certainly an area to keep a close tab on this week.
Daily levels to watch this week fall in at: 1.3023-1.3090/The underside of the recently broken trendline (1.2562).
USD/CHF:
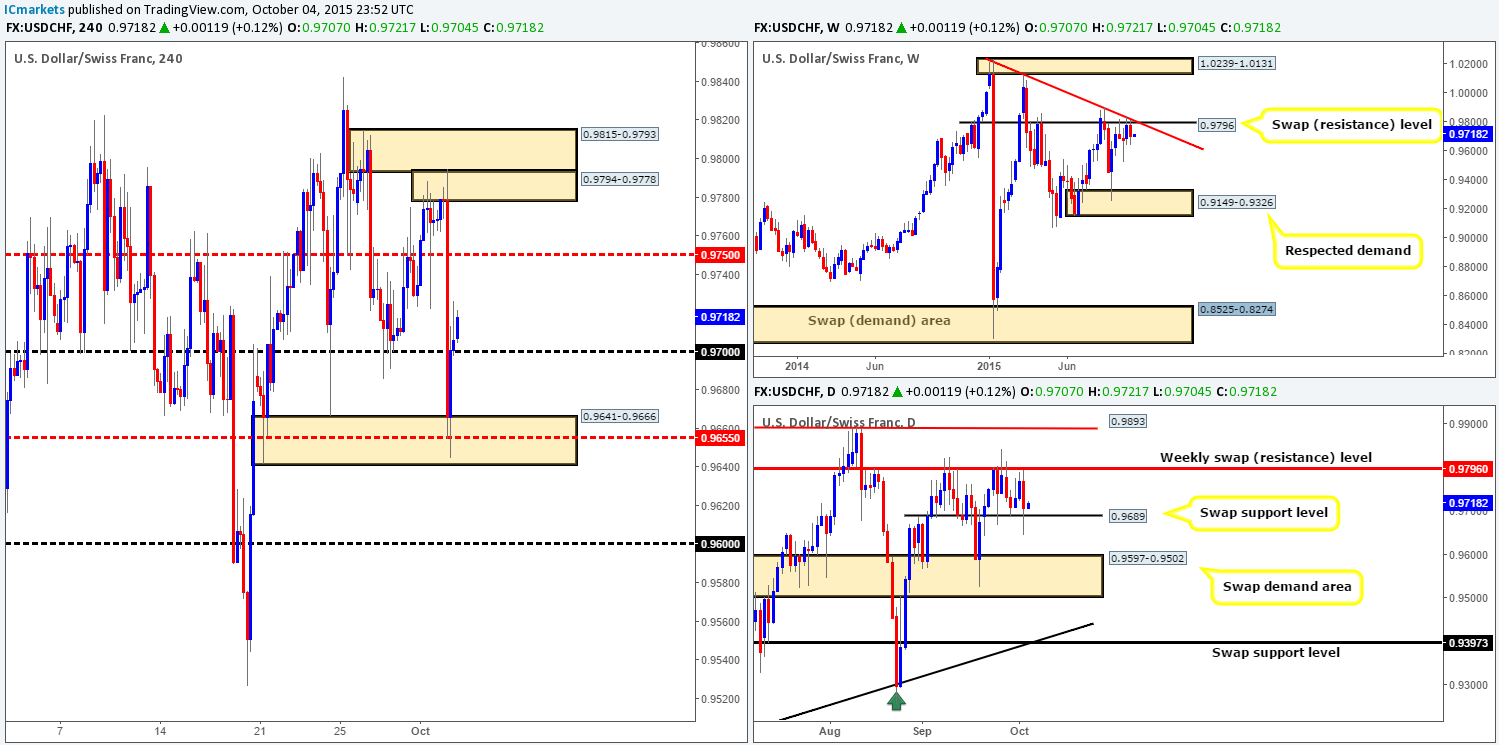
Weekly view: Once more, the swap resistance level at 0.9796 (converges with trendline resistance from the high 1.0239) managed to hold this pair lower last week. This, as a result, shredded close to eighty pips of value from this market and took back 85% of last week’s gains at the close 0.9706.
In spite of the above, the previous rebound seen from this level four weeks ago managed to only hit lows of 0.9526, thus the validity of this hurdle still remains in question for us. With that said, a close above this level this week could open the trapdoor for prices to eventually challenge supply given at 1.0239-1.0131.
Weekly levels to watch this week fall in at: 0.9796/1.0239-1.0131.
Daily view: Down on the daily timeframe, it’s relatively clear to see that the swap support level lurking just below the aforementioned weekly swap (resistance) area at 0.9689 continues to hold firm. Both levels are proving stubborn barriers to break, hence the current ranging formation being seen on this chart.
A push above the weekly level on the daily scale this week may suggest further upside towards 0.9893 – a clean resistance which proved itself beautifully back in mid-August. On the flip side, should daily support fail to hold, we may see an attack on the swap demand area coming in at 0.9597-0.9502.
Daily levels to watch this week fall in at: 0.9689/0.9893/0.9597-0.9502.
4hr view: The USD/CHF pair heavily sold off from supply at 0.9815-0.9793 following Friday’s release of lower-than-expected US non-farm payrolls data. This knee-jerk reaction punched through bids at 0.9750/0.9700 and sent prices crashing into demand at 0.9641-0.9666, which, as you can see, was clearly enough to support a counter-attack back up above 0.9700 by the weeks end.
Not too long after the market opened at 0.9707 this morning, we can see a steady wave of bids hit the line. Should the buyers maintain a position just above psychological support today, there’s little reason why this pair will not continue to rally up to at least mid-level resistance 0.9750 today.
So that we’re all on the same page here, let’s just quickly run through what we have:
- Weekly sellers holding firm below a swap resistance level at 0.9796.
- Daily chart shows that price is now range bound (see above).
- 4hr action shows room to move higher.
Given these points, buying into this market is certainly a possibility today since price has just reacted from a daily swap (support) barrier at 0.9689 – the lower limit of the range. Nevertheless, In spite of having daily convergence backing a long trade today, we still need to be aware that weekly sellers are potentially lurking around the weekly swap (resistance) level at 0.9796. Personally, we would not be comfortable trading this pair long knowing there is somewhat of a tug-of-war taking place on the higher timeframes at the moment. As such, we have chosen to humbly stand aside on this pair for the time being until clearer price action presents itself.
Levels to watch/ live orders:
- Buys: Flat (Stop loss: N/A).
- Sells: Flat (Stop loss: N/A).
DOW 30:
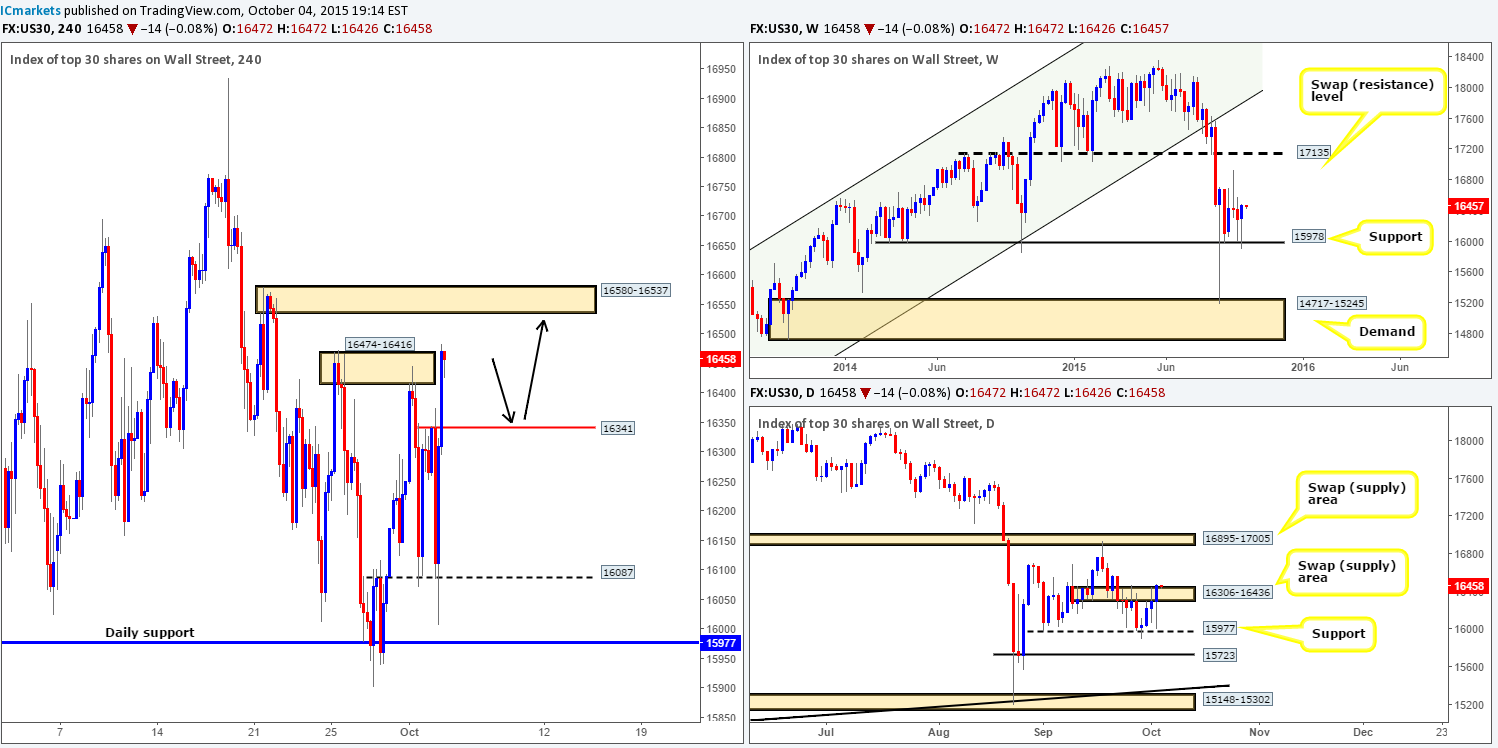
Weekly view: As we can all see, support at 15978 once again held firm last week, forming a beautiful-looking pin tail and gaining around 170 points at the close 16472. There is clear buying interest here and since only pro money can produce buying tails of this magnitude, we consider this to be a strong support. Should this market remain well-bid this week, there’s room, as far as we see, for price to appreciate up to at least the weekly swing high 16935, followed closely by the swap resistance level drawn from 17135.
Weekly levels to watch this week fall in at: 15978/17135.
Daily view: Branching lower to the daily chart, we can see that price found support at 15977 on Tuesday, where indecision was clearly present in the market on that day. However, this was quickly resolved with a surge of buying on Wednesday, which, as shown on the chart, eventually saw price close above a swap supply area at 16306-16436. This, in itself, could encourage further upside in this market this week towards the swap supply area coming in at 16895-17005.
Daily levels to watch this week fall in at: 15977/ 16306-16436/ 16895-17005.
4hr view: Friday’s trade saw the DOW fall more 350 points, forcing price to collide with support sitting at 16087. As can be seen from the chart though, it did not take too long for this market to recover from its recent losses and then some, as candle action pushed itself up to and slightly above supply coming in at 16474-16416.
Taking into consideration that the weekly scale shows supportive pressure, and daily action recently taking out supply along with 4hr also just jabbing above supply (see above), we’re confident this market is heading higher today/this week.
However, for us to confidently long this market, we’d need to see a clean pullback to a minor swap support level at 16341. What we mean by ‘clean’ is simply a fast push, that way little supply is created on the way down, which, in theory should make it less difficult for price to appreciate from 16341 should there be active bids residing here. Ultimately, we only have one target in mind for this trade should it come to fruition, and that is supply seen at 16580-16537.
Levels to watch/ live orders:
- Buys: 16341 [Tentative – confirmation required] (Stop loss: dependent on where one confirms this level).
- Sells: Flat (Stop loss: N/A).
XAU/USD: (Gold)
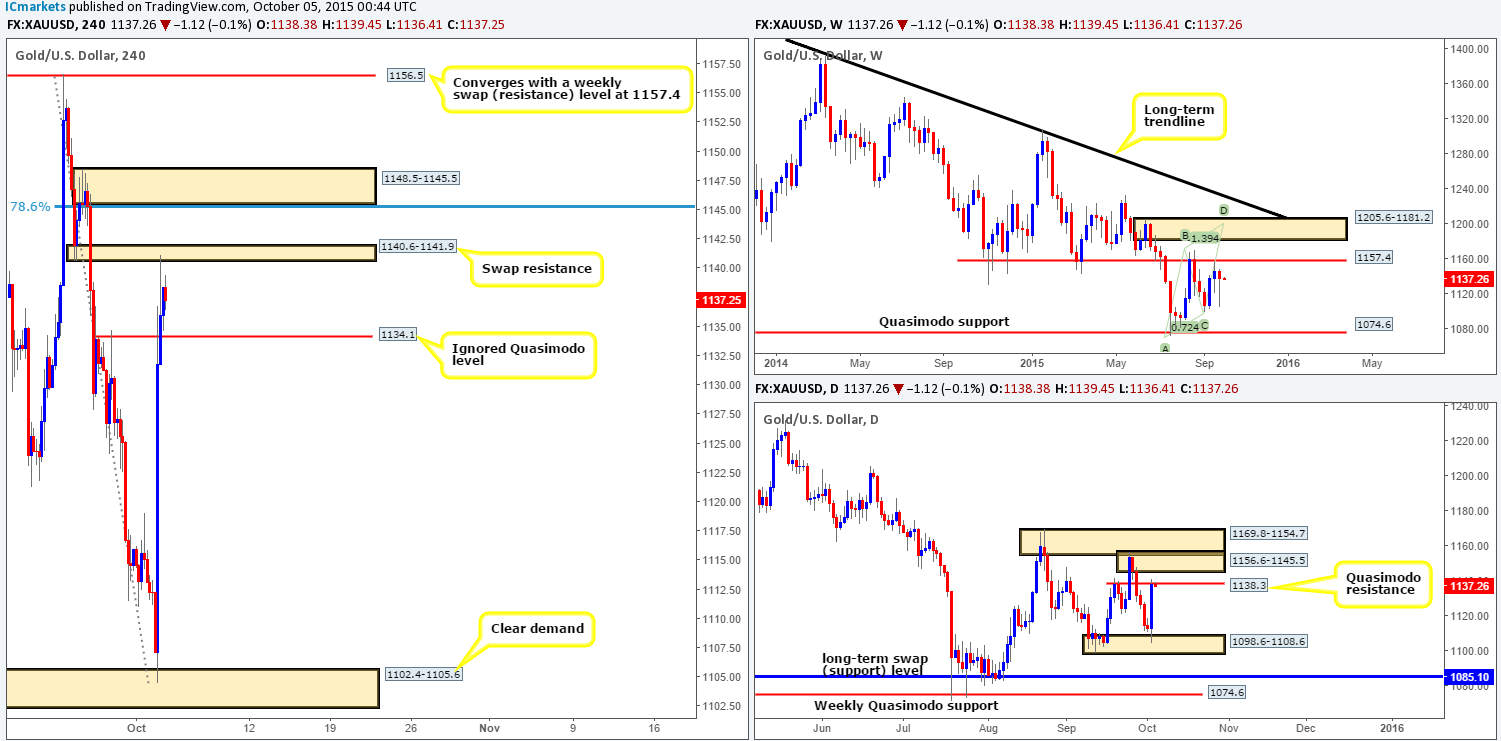
Weekly view: Although Gold still remains below the swap resistance barrier at 1157.4, the rebound from this area has, at least for us, been relatively disappointing so far. This market lost around 700 pips last week at the close 1138.3, which, in the overall scheme of things means very little to us considering the size of the buying tail that printed from the low 1104.4.
Should 1157.4 give way this week, it’s likely this market will head in the direction of supply taken from 1205.6-1181.2. This area, in our book, is a perfect zone to look for shorts. It not only converges with a bearish Harmonic AB=CD pattern (1199.4), but also with the underside of a long-term trendline extended from the high 1488.0.
Weekly levels to watch this week fall in at: 1157.4/1205.6-1181.2.
Daily view: From the pits of the daily timeframe, it’s clear to see, at least technically, why Gold printed the weekly pin tail last week. This market had been in a decline all week, it was only once price connected with demand at 1098.6-1108.6, no doubt during the NFP release, did we see price aggressively rally on Friday, closing the week out at Quasimodo resistance drawn from 1138.3. This level, coupled with the stacked supply seen above (1156.6-1145.5/ 1169.8-1154.7), will likely make it hard for Gold to appreciate this week, no matter what we’re currently seeing on the weekly scale. It will be interesting to see what the 4hr timeframe has to offer…
Daily levels to watch this week fall in at: 1098.6-1108.6/1138.3/1156.6-1145.5/ 1169.8-1154.7.
4hr view: At this viewpoint, we can see that Gold rapidly gained altitude shortly after NFP’s disappointing release, which saw little sign of slowing down until connecting with a small swap resistance area given at 1140.6-1141.9. The reason for initially marking this area on Friday simply came down to it converging with a daily Quasimodo resistance level drawn from 1138.3.
Going forward, it was a soft start this morning for the yellow metal as prices opened at Friday’s close, 1138.3. Due to price now effectively trading mid-range between the aforementioned swap resistance area, and a slightly obscure ignored Quasimodo level at 1134.1, where do we see this market heading? Well, for today, we have our eye on the two above said levels for confirmed trades. In addition to this, we also like the fresh supply area just above it at 1148.5-1145.5 since it ties in nicely with the 78.6% Fib resistance and also sits just within daily supply at 1156.6-1145.5. As for the week ahead, we do not see this market appreciating much, if at all as explained in the higher timeframe sections above.
Levels to watch/ live orders:
- Buys: 1134.1 [Tentative – confirmation required] (Stop loss: dependent on where one confirms this level).
- Sells: 1140.6-1141.9 [Tentative – confirmation required] (Stop loss: dependent on where one confirms this area) 1148.5-1145.5 [Tentative – confirmation required] (Stop loss: dependent on where one confirms this area).


