
EUR/USD:
Weekly Gain/Loss: -0.14%
Weekly Close: 1.1387
Weekly perspective:
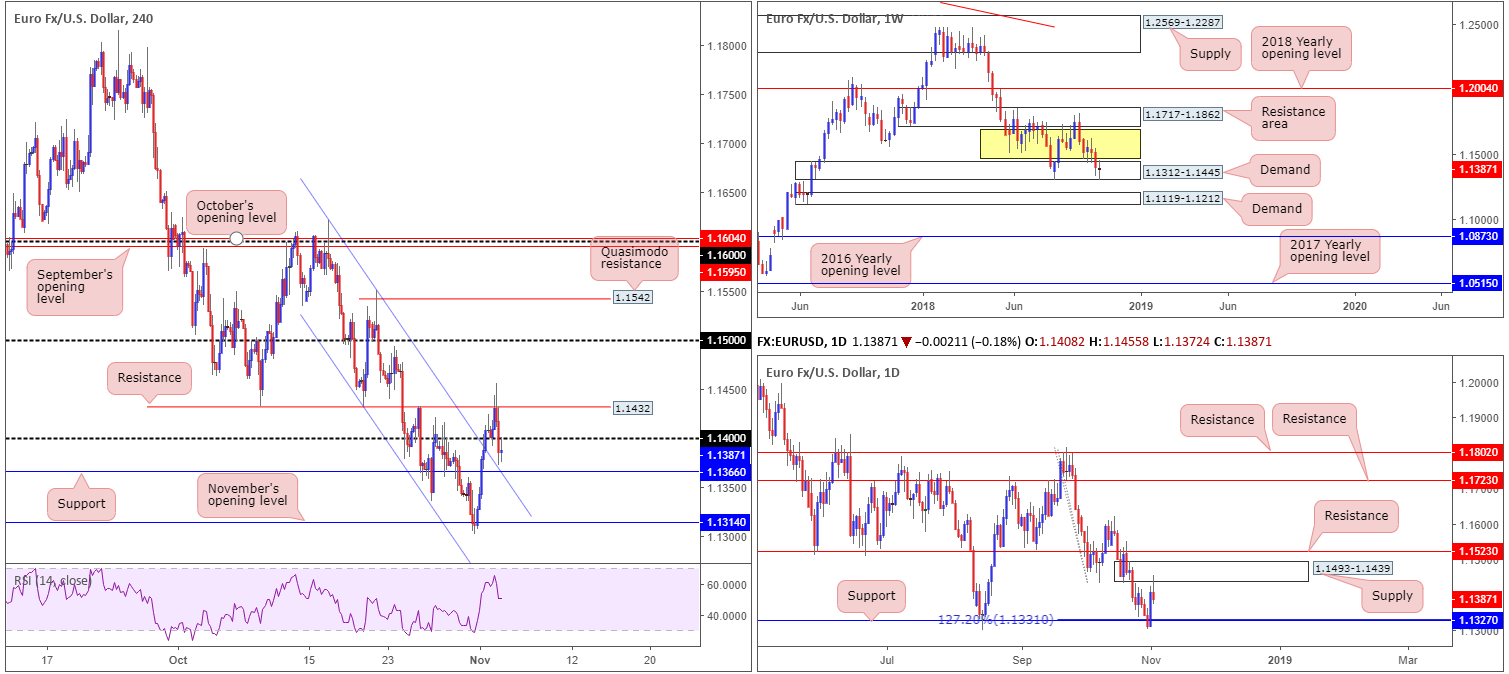
By way of a clear-cut indecision candle, the shared currency concluded the week closing within the walls of demand seen at 1.1312-1.1445. Should buyers regain control from this point, price shows room to extend as far north as a resistance area coming in at 1.1717-1.1862 (capped upside since early June 2018).
On the whole, this timeframe is considered range bound (yellow zone). Areas outside of this border fall in at the 2018 yearly opening level drawn from 1.2004 and demand marked at 1.1119-1.1212.
Daily perspective:
Despite price action rebounding strongly from support at 1.1327 (in motion as support/resistance since Feb 2016 – dovetails nicely with a 127.2% Fib ext. point), supply priced in at 1.1493-1.1439 made an appearance Friday and held the unit lower in the shape of a bearish pin-bar formation.
Beyond the current supply, resistance printed at 1.1523 is the next objective on the hit list, whereas beneath the noted support, demand drawn from 1.1171-1.1220 (glued to the top edge of the weekly demand area mentioned above at 1.1119-1.1212) is seen (not visible on the screen).
H4 perspective:
Friday’s US labour report revealed non-farm payrolls bounced in October to 250k from 118k (above the 190k consensus), providing support in USD-related markets. US unemployment also held steady at 3.7%, while average hourly earnings rose by 0.2%, pushing the y/y headline to 3.2%. The latest labour report, therefore, fortifies expectations for the Fed to hike rates at its December meeting.
After touching fresh highs of 1.1455 mid-way through London’s morning session, the technical picture shows the pair turned lower. Weighed on by strong NFP, the H4 candles respected resistance at 1.1432 and eventually closed out the week marginally under 1.14 in form of an indecision candle.
Areas of consideration:
In essence, we have weekly flow printing an indecisive tone from demand. On the other side of the spectrum daily price indicates the pair could be heading for support at 1.1327 from supply. This implies the current weekly demand base is under pressure and may eventually give way. For that reason, caution on the long side (medium/long term) is recommended.
The expectation on the H4 timeframe is for another higher high to form, according to current market structure (price broke to fresh highs [1.1455] and therefore a lower low, followed by another higher high could be seen). With that in mind, and despite price reclaiming 1.14 to the downside, traders might want to note the possibility of intraday buying entering the fold off support at 1.1366, which happens to converge closely with a channel resistance-turned support (extended from the high 1.1621). Should the market explore lower ground beneath 1.1366, nevertheless, daily support mentioned above at 1.1327 is next on the hit list, followed by November’s opening level at 1.1314.
Today’s data points: US ISM non-manufacturing PMI.
GBP/USD:
Weekly Gain/Loss: +1.06%
Weekly Close: 1.2961
Weekly perspective:
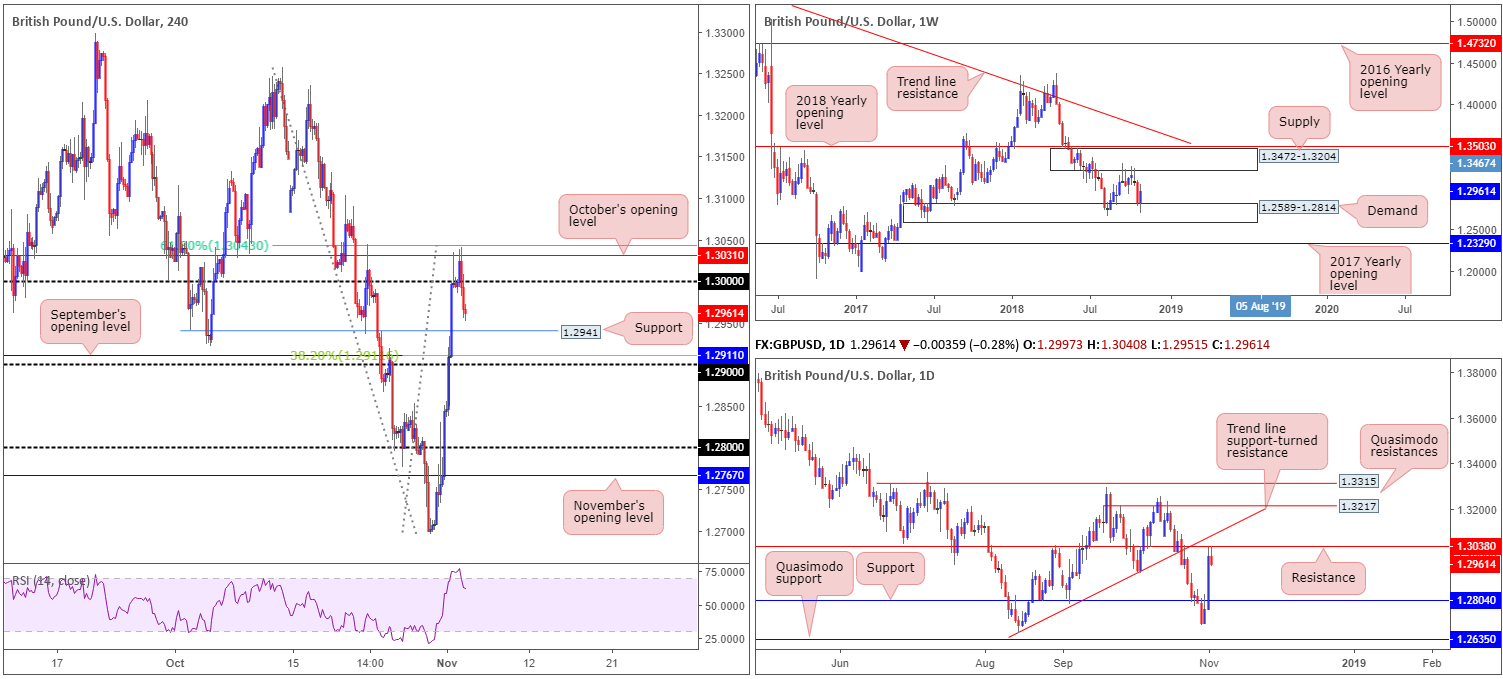
Although ending the week on strong footing, the GBP/USD continues to sculpt a range between demand at 1.2589-1.2814 and a supply drawn from 1.3472-1.3204. Of late, the market tested the lower limit of this consolidation and responded in reasonably strong fashion, nursing a large portion of recent losses.
Daily perspective:
Resistance at 1.3038, as you can see, entered the fight Thursday after a strong move to the upside following reports the EU secured access for UK financial services firms. Downing Street, however, swiftly quashed speculation a Brexit agreement was reached on financial services.
In view of the history surrounding the current resistance (dates back as far as May 2017), the pair could potentially pullback as far south as support registered at 1.2804. Further buying, on the other hand, has trend line support-turned resistance (taken from the low 1.2661) in view, followed closely by Quasimodo resistance penciled in at 1.3217.
H4 perspective:
In spite of a number of attempts to break for higher ground Friday, October’s opening level seen at 1.3031 (shadowed closely by a 61.8% Fib resistance at 1.3043) hindered upside. On the back of a reasonably upbeat US labour report, the H4 candles overthrew 1.30 to the downside, consequently positioning the market within striking distance of support at 1.2941 into the close. It might also be worth mentioning the RSI indicator is currently seen fading overbought territory.
Areas of consideration:
While H4 support at 1.2941 may be sufficient to draw buyers back into the market this week, buyers’ attention will likely be on 1.29. Surrounded closely by September’s opening level at 1.2911 and a 38.2% H4 Fib support (also at 1.2911), a bounce from this angle is more likely. Whether the buyers have enough oomph to get back above 1.2941 (resistance at that point), is difficult to judge since let’s remember although weekly trade is bouncing from demand, daily price is fading resistance at 1.3038.
In the event a push under 1.29 is observed, shorts (preferably on the retest of 1.29) beyond this number are reasonably high probability to 1.2804 (daily support), shadowed closely by the 1.28 handle.
Today’s data points: UK services PMI; US ISM non-manufacturing PMI.
AUD/USD:
Weekly Gain/Loss: +1.57%
Weekly Close: 0.7197
Weekly perspective:
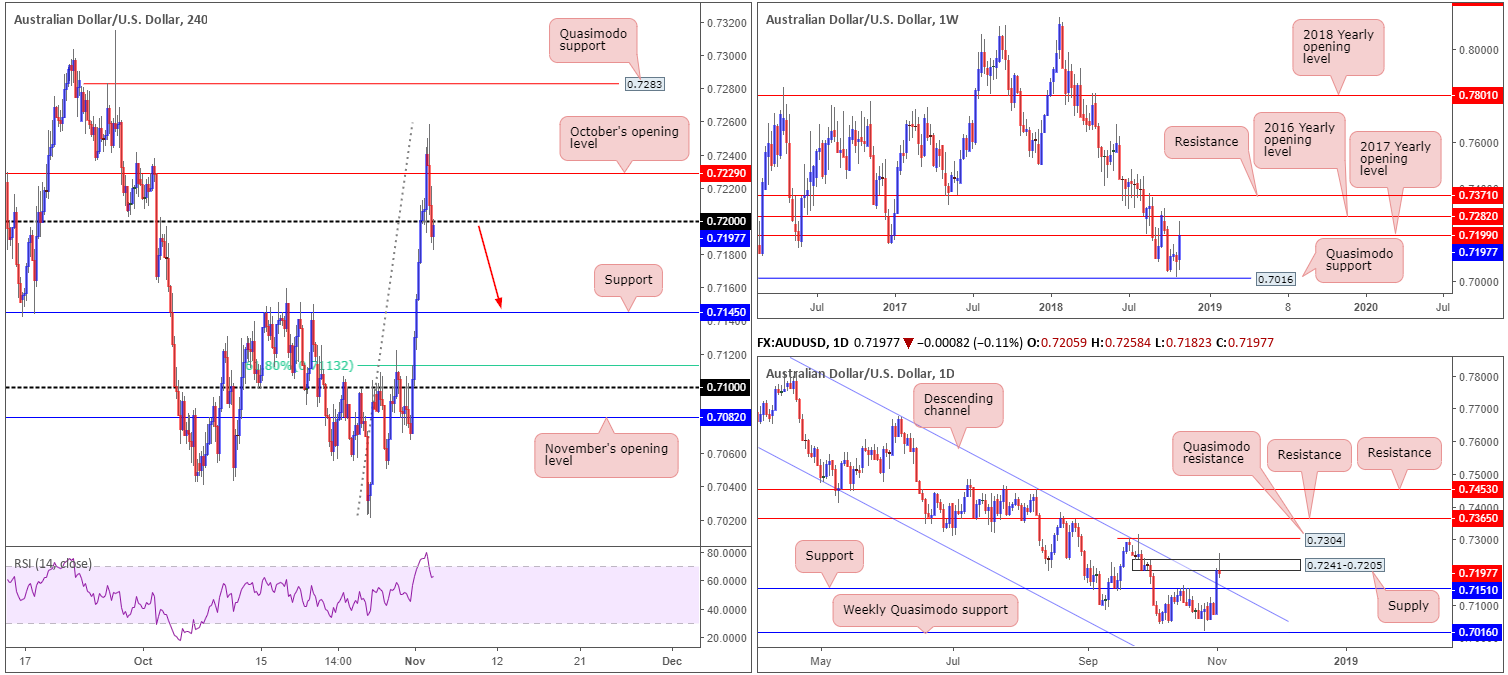
Following a near picture-perfect bullish pin-bar formation just north of a Quasimodo support at 0.7016, the Australian dollar witnessed a strong resurgence of bidding last week. Ending the week among the best performers, price aggressively pushed to highs of 0.7258, though failed to close beyond its 2017 yearly opening level at 0.7199.
Daily perspective:
Thursday’s action saw the AUD/USD firmly break above a long-term channel resistance (etched from the high 0.8135) and shake hands with nearby supply coming in at 0.7241-0.7205. Sellers attempting to fade this area were likely burnt on Friday following a whipsaw to highs of 0.7258 in the form of a bearish pin-bar pattern. A push lower this week will likely bring support at 0.7151 into view that merges nicely with the recently broken channel resistance (turned support).
H4 perspective:
After touching its highest level in six weeks at 0.7258 amid early London trade Friday, the pair retreated from the said peak and pared daily gains. Reclaiming October’s opening level at 0.7229, and then eventually the 0.72 handle, the general vibe on this scale emphasizes a bearish tone at the moment, with little seen in the way of supportive structure until around the 0.7145ish neighbourhood. Another point traders may wish to note is the RSI indicator is seen trading from overbought territory.
Areas of consideration:
With both weekly and daily timeframes portending a move lower (in terms of structure that is), the spotlight, at least in the earlier stages of this week, is likely best focused on shorts.
Having seen the H4 candles retest the underside of 0.72 at the closing stages of last week, a bearish candlestick formation printed off this number would, according to the overall market picture, likely be considered a reasonably attractive signal to sell (entry/stop parameters can be defined by the candlestick structure), targeting daily support at 0.7151/H4 support at 0.7145 as the initial port of call. Do bear in mind, further selling is possible beyond this region back towards the weekly Quasimodo support at 0.7016.
Today’s data points: US ISM non-manufacturing PMI.
The use of the site is agreement that the site is for informational and educational purposes only and does not constitute advice in any form in the furtherance of any trade or trading decisions.
The accuracy, completeness and timeliness of the information contained on this site cannot be guaranteed. IC Markets does not warranty, guarantee or make any representations, or assume any liability with regard to financial results based on the use of the information in the site.
News, views, opinions, recommendations and other information obtained from sources outside of www.icmarkets.com.au, used in this site are believed to be reliable, but we cannot guarantee their accuracy or completeness. All such information is subject to change at any time without notice. IC Markets assumes no responsibility for the content of any linked site. The fact that such links may exist does not indicate approval or endorsement of any material contained on any linked site.
IC Markets is not liable for any harm caused by the transmission, through accessing the services or information on this site, of a computer virus, or other computer code or programming device that might be used to access, delete, damage, disable, disrupt or otherwise impede in any manner, the operation of the site or of any user’s software, hardware, data or property.


