
A note on lower timeframe confirming price action…
Waiting for lower timeframe confirmation is our main tool to confirm strength within higher timeframe zones, and has really been the key to our trading success. It takes a little time to understand the subtle nuances, however, as each trade is never the same, but once you master the rhythm so to speak, you will be saved from countless unnecessary losing trades. The following is a list of what we look for:
- A break/retest of supply or demand dependent on which way you’re trading.
- A trendline break/retest.
- Buying/selling tails/wicks – essentially we look for a cluster of very obvious spikes off of lower timeframe support and resistance levels within the higher timeframe zone.
- Candlestick patterns. We tend to stick with pin bars and engulfing bars as these have proven to be the most effective.
We search for lower timeframe confirmation between the M15 and H1 timeframes, since most of our higher-timeframe areas begin with the H4. Stops are usually placed 5-10 pips beyond confirming structures.
EUR/USD:
Weekly gain/loss: + 68 pips
Weekly closing price: 1.0658
Weekly opening price: 1.0665
Weekly view: After coming within an inch of tagging the top edge of a support area seen at 1.0333-1.0502 two weeks back, last week’s flow extended to highs of 1.0689. Provided that the bulls continue to bid prices higher this week, the next upside target to have an eyeball on is the trendline resistance extended from the low 0.8231, followed closely by the 2016 yearly opening level at 1.0873 and resistance at 1.0819.
Daily view: Following Friday’s indecision candle, daily action initially looked poised to test the nearby resistance sitting at 1.0710, which, if you look back in history, you’ll notice that this number capped downside (as a support) beautifully at the beginning of the year. Still, given today’s rather vibrant opening, it looks like price may revisit the triple-bottom support formation at 1.0520, seen loitering just ahead of a Quasimodo support coming in at 1.0494.
H4 view: This morning’s action, as you can see, saw a wave of sellers enter the market from within the H4 resistance area at 1.0646-1.0689, as exit polls currently show Italy’s PM Renzi likely to lose in today’s referendum. This somewhat energetic start to a normally lethargic Monday has brought the H4 opening candle below both the 1.06 handle and December’s opening level at 1.0590, and is now currently seen within shouting distance of testing the double-bottom support at 1.0568.
Direction for the week: At the time of writing, this is difficult to foresee. Overall, the trend is pointing south so this will place additional pressure on the current weekly support area and the above noted daily supports. An early telltale sign that the bears are gaining further traction would be a daily close below the daily supports mentioned above. This could eventually portend to a break of the weekly support area.
Direction for today: In light of today’s opening candle, direction seems quite clear for the time being, and in light of the current exit polls further downside MIGHT be at hand. However, as we write, the only area of support we feel is noteworthy comes in at 1.05. This number molds beautifully with the daily Quasimodo support at 1.0494 and also, more importantly, the top edge of the weekly support area at 1.0502. Therefore, under usual trading conditions this level would be stable enough to permit a pending buy order at 1.0495 with a stop placed below the head of the current daily Quasimodo formation at 1.0459.
Our suggestions: We will not be taking any positions in the EUR/USD market today due to current volatility. However, for those who wish to trade, do keep an eye on the above noted 1.05 handle. The (technical) confluence surrounding this barrier is appealing.
Data points to consider: Eurogroup meetings (All day). FOMC member Dudley speaks at 1.30pm, ISM non-manufacturing PMI at 3pm, FOMC member Bullard speaks at 7.05pm GMT.

Levels to watch/live orders:
- Buys: 1.05 region is an interesting barrier for longs today (see above in our ‘suggestions’ section for details).
- Sells: Flat (stop loss: N/A).
GBP/USD:
Weekly gain/loss: + 248 pips
Weekly closing price: 1.2721
Weekly opening price: 1.2677
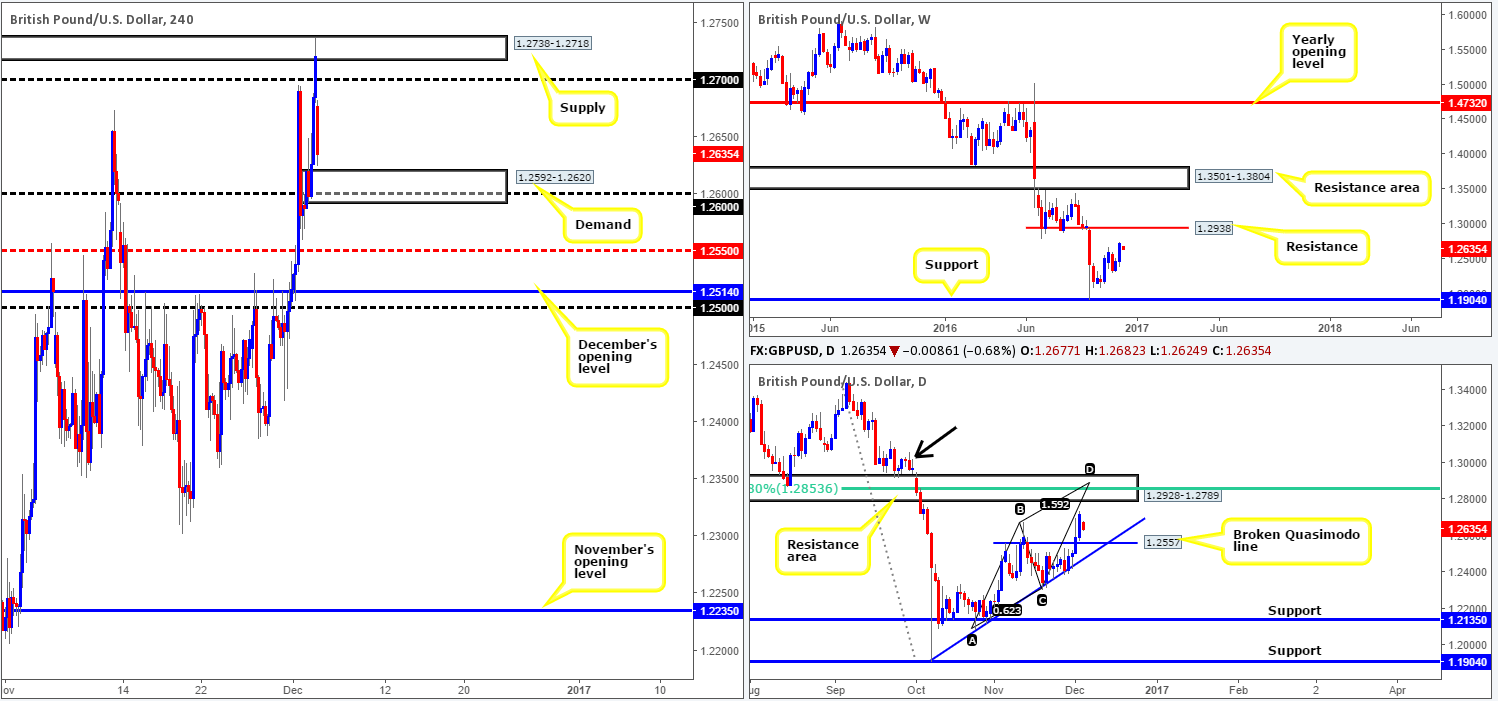
Weekly view: The current move north is, at least in our view, seen as a correctional one so far rather than a trend change. The next upside objective can be seen at 1.2938: a weekly resistance level, which is where we expect the bears to make their presence known.
Daily view: The story on the daily chart shows that price action looks set to extend north to shake hands with a resistance area drawn from 1.2928-1.2789. Of particular interest here is the confluence seen within this zone: an AB=CD bearish completion point at 1.2890 and a 61.8% Fib resistance level at 1.2853. Despite this confluence, traders may also want to note that there’s a chance the market could fake beyond this area to tag the nearby supply marked with a black arrow at 1.3058-1.2966.
H4 view: Following Friday’s drive into the supply at 1.2738-1.2718, the market responded this morning by gapping 40 or so pips to the downside, consequently placing the candle below the 1.27 psychological handle. The move, as you can see, has intensified in recent trading due to the Italian referendum showing ‘No wins’ in most regions. The next support on tap is 1.26 that is smothered by a demand base penciled in at 1.2592-1.2620.
Direction for the week: With room seen on both the weekly and daily charts for sterling to appreciate (see above), we do not anticipate much follow-through selling. The most we see the pair correcting to is the H4 mid-way support boundary at 1.2550/December’s opening level at 1.2514, which sits just below the daily broken Quasimodo line at 1.2557.
Direction for today: The aforementioned H4 demand and its partnering 1.26 psychological support may see a breach today. However, 1.2550 level/December’s opening level at 1.2515 is likely to hold as support given its connection with the daily timeframe.
Our suggestions: Our desk has noted that longs would only be permitted between the 1.2514/1.2550 neighborhood. We would still recommend waiting for the lower timeframes to confirm buyers have an interest here (see the top of this report for ideas on how to enter using lower timeframe price action), since a fake lower to 1.25 is a strong possibility.
Data points to consider: UK services PMI at 9.30am. FOMC member Dudley speaks at 1.30pm, ISM non-manufacturing PMI at 3pm, FOMC member Bullard speaks at 7.05pm GMT.
Levels to watch/live orders:
- Buys: 1.2514/1.2550 ([waiting for lower timeframe confirming action is preferred] stop loss: dependent on where one confirms the area).
- Sells: Flat (stop loss: N/A).
AUD/USD:
Weekly gain/loss: + 14 pips
Weekly closing price: 0.7452
Weekly opening price: 0.7450
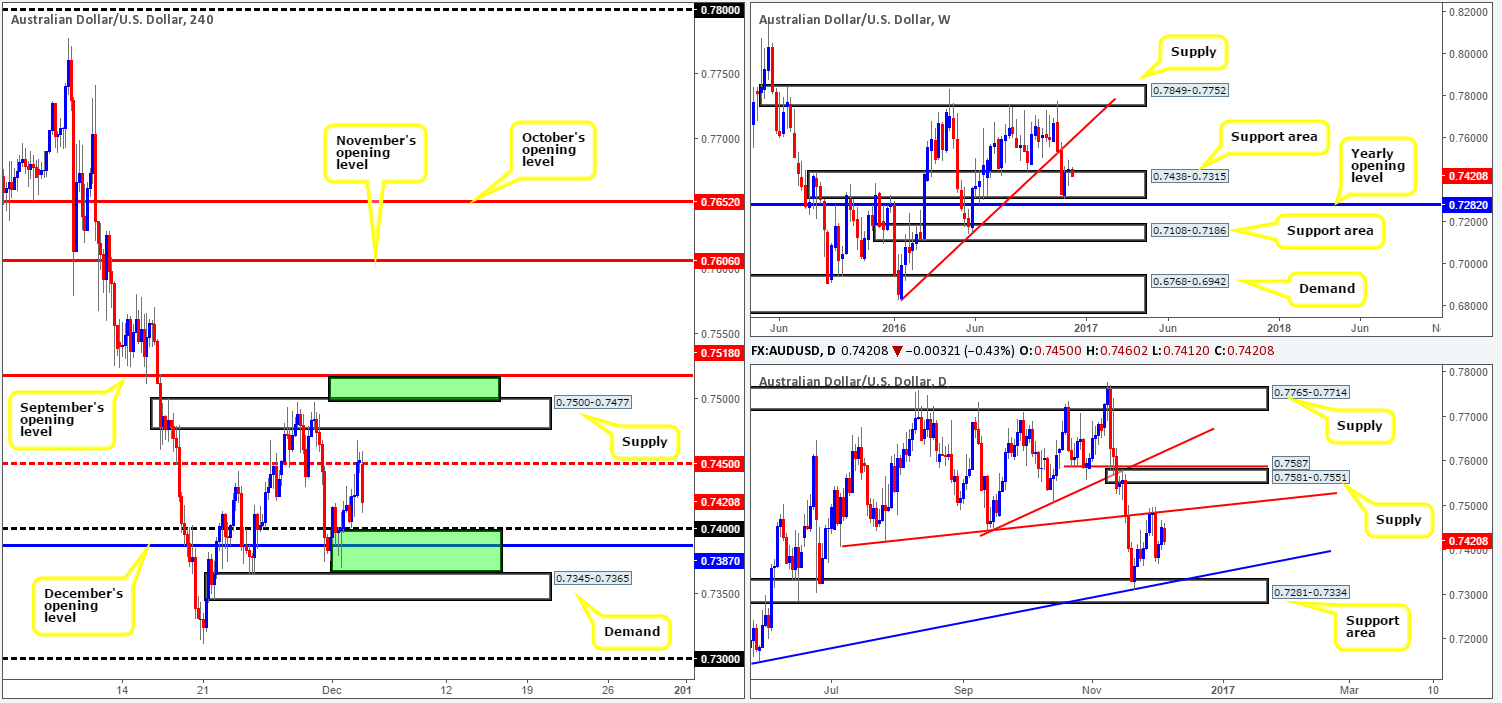
Weekly view: Aussie prices were little changed by the week’s close with a mere 14-pip gain recorded! As a result, an indecision candle was chalked in, which, as you can see, is positioned around the top edge of a support area logged at 0.7438-0.7315. A continuation move higher from this angle could force price to connect with a trendline resistance stretched from the low 0.6827. Meanwhile, a push south from here may portend a fakeout to the 2016 yearly opening level at 0.7282.
Daily view: Despite weekly price floating around a support area at the moment, down here on the daily chart the candles are currently seen loitering within striking distance of a trendline resistance taken from the low 0.7407. This barrier capped upside beautifully on Wednesday last week, so there is a chance we may see history repeat itself here! In the event that this hurdle fails to hold, nevertheless, supply at 0.7581-0.7551, followed closely by a broken Quasimodo line at 0.7587 would very likely be the next areas on the hit list.
H4 view: The H4 mid-way resistance level at 0.7450 is currently doing a superb job in holding price lower this morning. Directly above this line is a supply zone seen at 0.7500-0.7477 (converges with the above noted daily trendline resistance), followed by September’s opening level at 0.7518. Supposing that 0.7450 remains firm, however, the 0.74 handle along with December’s opening level at 0.7387 are the next levels seen in the firing range.
Direction for the week: Before weekly bulls can take control from the current support zone, daily sellers must be consumed around the aforementioned daily trendline resistance. Nonetheless, even with a break above this line there’s not much room to play with given the nearby daily supply at 0.7581-0.7551! Therefore, our team has stamped medium-term direction as ‘restricted’ for the time being.
Direction for today: By and large, we feel there’s equal opportunity for prices to trade in either direction today. Areas of interest our team has noted are as follows:
- For longs: between the top edge of H4 demand at 0.7365 and the 0.74 hurdle is somewhere our desk would consider a good place for a bounce, given that it holds December’s opening level at 0.7387.
- For shorts: the area seen between H4 supply at 0.7500-0.7477 and September’s opening level at 0.7518 looks an attractive fakeout zone. Furthermore, let’s not forget note its connection with the above said daily trendline resistance.
Our suggestions: To trade long from the above said H4 buy zone, we would recommend waiting for at least a H4 bull candle to form, since there’s a chance that price could fake through the current H4 demand at 0.7345-0.7365 down to the daily support area at 0.7281-0.7334 that fuses nicely with trendline support taken from the low 0.7145. In regards to our H4 sell zone, we would also recommend waiting for a H4 bear candle to confirm seller interest, simply due to the fact that weekly bulls could push this market higher (see above).
Data points to consider: Caixin Services PMI at 1.45am. FOMC member Dudley speaks at 1.30pm, ISM non-manufacturing PMI at 3pm, FOMC member Bullard speaks at 7.05pm GMT.
Levels to watch/live orders:
- Buys: 0.7365/0.74 ([reasonably sized H4 bullish close required prior to pulling the trigger] stop loss: ideally beyond the trigger candle).
- Sells: 0.7518/0.75 ([reasonably sized H4 bearish close required prior to pulling the trigger] stop loss: ideally beyond the trigger candle).
USD/JPY:
Weekly gain/loss: + 32 pips
Weekly closing price: 113.48
Weekly opening price: 113.27
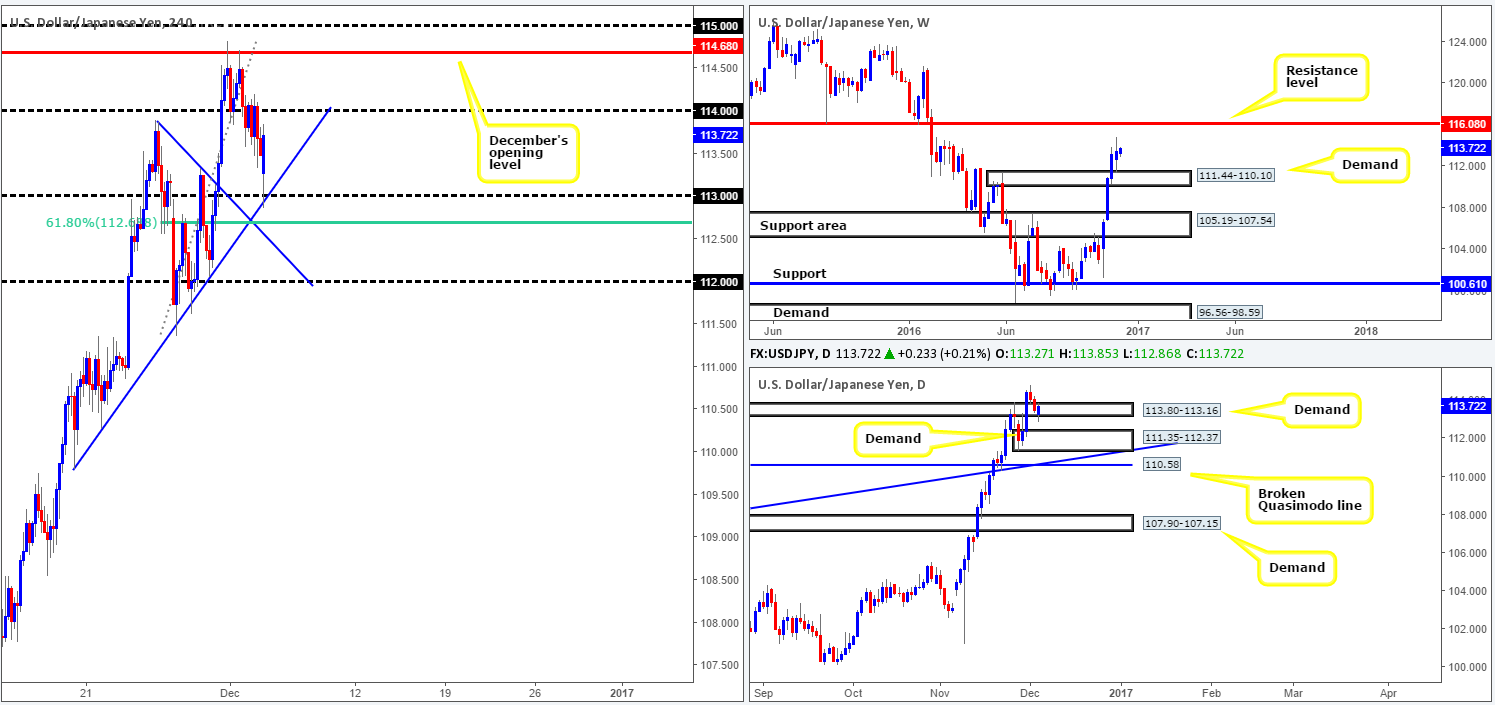
Weekly view: The US dollar continued to advance last week, following a retest off the top edge of a supply-turned demand area at 111.44-110.10. Considering that the three previous weekly candles were near-full-bodied bullish closes, last week’s action shows us that upside momentum may be diminishing given the end-of-week correction. Nevertheless, the next upside resistance from here can be seen at 116.08 – a level that held beautifully as support throughout 2015.
Daily view: Supply-turned demand at 113.80-113.16 is currently holding ground as we write. Providing that the market continues to trade north from here, we see absolutely no reason (due to there being little active supply seen to the left of current price) why price cannot reach the aforementioned weekly resistance level.
H4 view: Consequent to price gapping south this morning, which saw the unit go on to test the 113 handle that aligns with a trendline support extended from the low 109.80, the bulls have been in fine form since! Fast approaching the 114 barrier, a break above here could open the gates for an attack of December’s opening level at 114.68.
Direction for the week: In that the weekly candles show room to stretch north to a weekly resistance at 116.08, as well as the daily chart showing demand at 113.80-113.16 holding firm, we feel the pair will continue to march north this week until we reach the 116 region.
Direction for today: This all depends on how price responds to the 114 barrier. A close above here could suggest further upside to December’s opening level and the 115 handle. A rejection from 114, however, will not likely be productive in that prices will probably only drop to retest the aforementioned H4 trendline support before continuing on its upwardly path, given the bullish stance seen on the bigger picture.
Our suggestions: Ultimately, our team is suggesting holding fire and letting the bulls prove themselves further this morning before attempting to buy this market. A close above 114 followed up with a retest would, at least in our book, be enough to justify a buy position, targeting 114.68/115.
Data points to consider today: FOMC member Dudley speaks at 1.30pm, ISM non-manufacturing PMI at 3pm, FOMC member Bullard speaks at 7.05pm GMT.
Levels to watch/live orders:
- Buys: Watch for a close above 114 and then look to trade any retest seen thereafter (stop loss: ideally beyond the trigger candle).
- Sells: Flat (stop loss: N/A).
USD/CAD:
Weekly gain/loss: – 228 pips
Weekly closing price: 1.3285
Weekly opening price: 1.3282
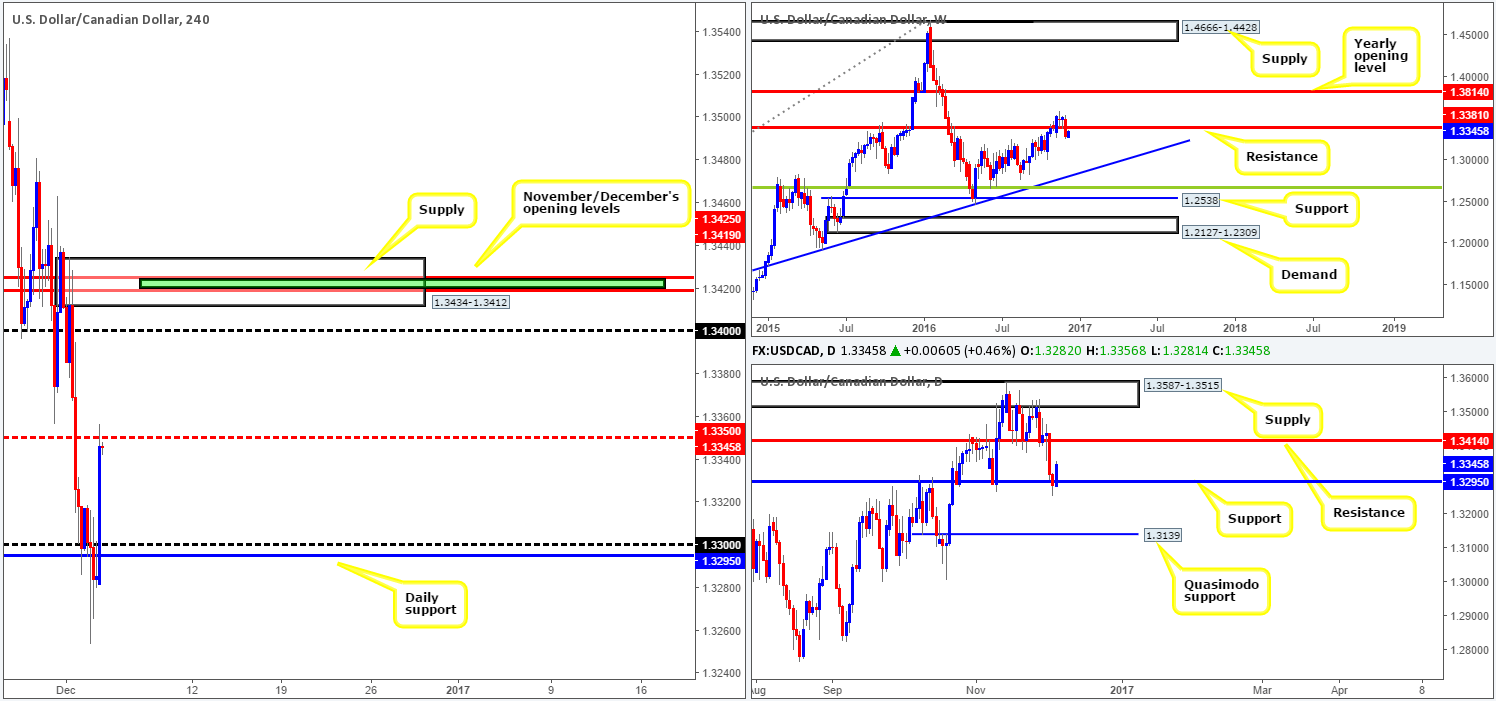
Weekly view: Despite a beautiful-looking buying tail printed off, what was at the time, support at 1.3381, the market collapsed last week, taking out this level and thus forming a resistance. To our way of seeing things, weekly price action below here looks relatively cramped. The only level that really catches our eye right now is the trendline support taken from the high 1.1278.
Daily view: Down here on the daily chart, nonetheless, support at 1.3295 is currently seen in play this morning. A continuation move north from this neighborhood could send the pair back up to retest the 1.3414 region as resistance. A break below the current support on the other hand, could encourage further downside toward a Quasimodo support marked at 1.3139.
H4 view: USD/CAD bulls went on the offensive early on in this morning’s trade, forcing price to connect with a mid-way resistance level coming in at 1.3350. Should offers be squeezed from this region, the next upside objective falls in at the 1.34 psychological resistance, shadowed closely by a supply zone at 1.3434-1.3412 that houses both November and December’s opening levels at 1.3425/1.3419.
Direction for the week: According to the daily candles, there’s scope for further buying toward resistance at 1.3414, whereas weekly price suggests prices may halt before this around the 1.3380 hurdle. Therefore, our team expects to see some appreciation but do not imagine prices extending much past the 1.34 area.
Direction for today: 1.3350 looks vulnerable as a resistance especially considering the fact that it is currently positioned against daily flow. Although a small bounce could be seen from here, we believe it will likely give way sometime today and send the H4 candles up to the 1.34 handle.
Our suggestions: With the above points in mind, our team will not be selling from 1.3350. Also, our team has noted that they will not be buying above 1.3350 considering the risk of price reacting from the weekly resistance level at 1.3381. What we are interested in, nevertheless, is a fakeout through the 1.34 handle into the H4 supply at 1.3434-1.3412. Not only does it hold two Monthly open levels, it also houses the aforementioned daily resistance barrier and sits just above the weekly resistance level mentioned above. In light of this confluence, our team feels comfortable enough to place a pending sell order at 1.3417, with a relatively small stop above the H4 supply at 1.3437.
Data points to consider today: FOMC member Dudley speaks at 1.30pm, ISM non-manufacturing PMI at 3pm, FOMC member Bullard speaks at 7.05pm GMT.
Levels to watch/live orders:
- Buys: Flat (stop loss: N/A).
- Sells: 1.3417 ([pending order] stop loss: 1.3437).
USD/CHF:
Weekly gain/loss: – 33 pips
Weekly closing price: 1.0098
Weekly opening price: 1.0114
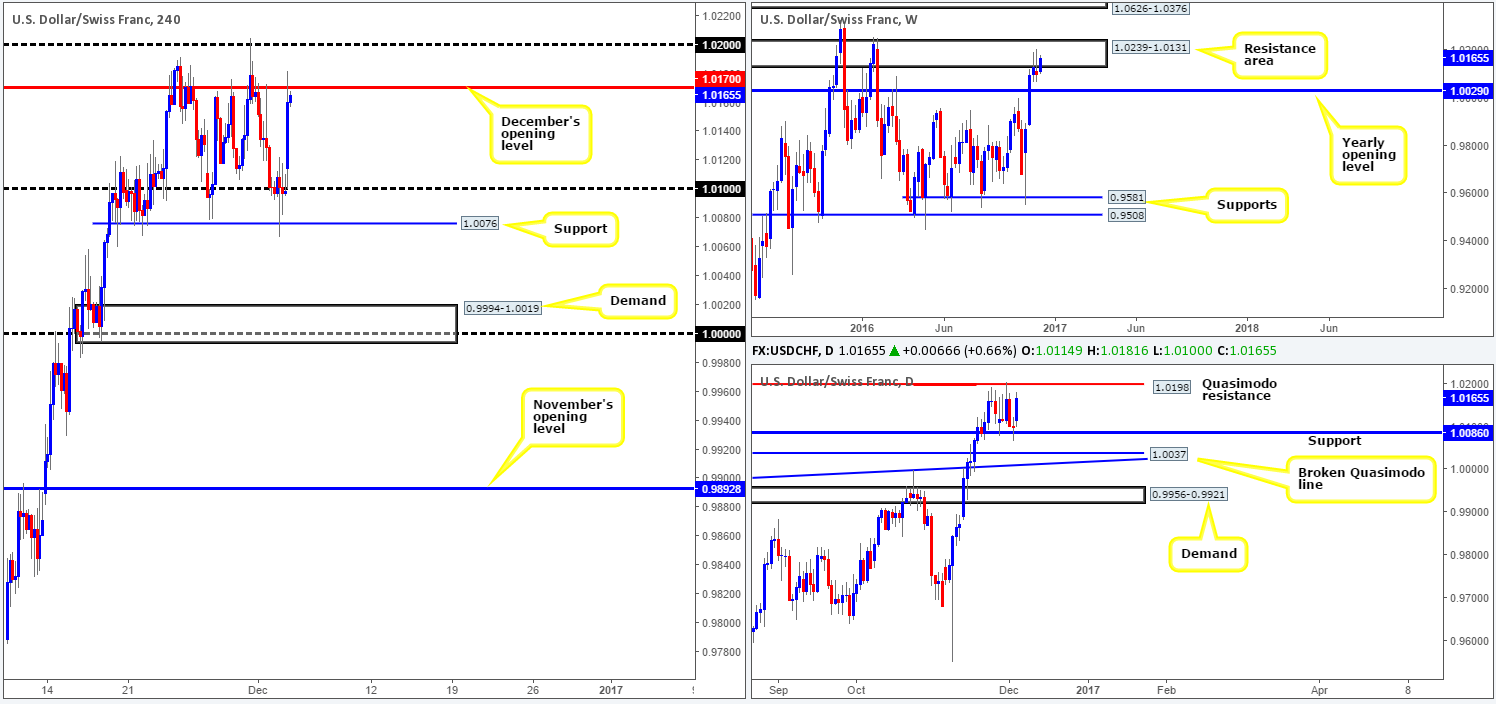
Weekly view: For the past three weeks, the USD/CHF enjoyed a significant increase in value. However, last week’s action printed a relatively strong-looking selling wick from the jaws of a resistance area at 1.0239-1.0131. The 2016 yearly opening level at 1.0029 is, as far as we’re concerned, the next downside target on this scale. Conversely, a break to the upside here could stimulate further buying up to supply coming in at 1.0626-1.0376.
Daily view: As things stand on the daily chart, nonetheless, price is currently capped by a Quasimodo resistance level at 1.0198 and a support boundary carved from 1.0086. A decisive daily close above the Quasimodo resistance base would likely portend weakness within the current weekly resistance area, whereas a break below the support likely advocates selling strength from the weekly zone.
H4 view: This morning’s opening candle certainly had its daily dose of vitamins! This was intensified by the Italian referendum where exit polls began hitting the wires as the market opened for business. As we write, the H4 candles are seen flirting with December’s opening level at 1.0170, which could hold form given its position within the weekly resistance area! A violation through this ceiling places the H4 candles within touching distance of the 1.02 boundary that aligns with the Quasimodo resistance level at 1.0198.
Direction for the week: Well, according to the weekly chart, there is a good chance that we may see a pullback this week. Yet, the current daily support at 1.0086 is certainly not a level one can ignore. Technically speaking, downside can only be confirmed once this daily support has been consumed. Even then however, there is not a lot of room to play with due to how close the next target support is: a daily broken Quasimodo line at 1.0037, which converges with a daily trendline support carved from the high 0.9956.
Direction for today: We do not anticipate a break above 1.02 today. In fact, a sell off from between December’s opening barrier at 1.0170 and this psychological boundary is a strong possibility!
Our suggestions: Bearing in mind that this area is located within a weekly resistance zone and boasts a daily Quasimodo resistance level, it is a difficult region for the bulls to penetrate we believe. Therefore, one may be interested to hunt for shorting opportunities within these walls today. Waiting for a H4 bearish candle to take shape would, in our estimation, be the safer trail to take, thus avoiding any fakeout through 1.02 and also helping avoid any unnecessary losses!
Data points to consider today: FOMC member Dudley speaks at 1.30pm, ISM non-manufacturing PMI at 3pm, FOMC member Bullard speaks at 7.05pm GMT.
Levels to watch/live orders:
- Buys: Flat (stop loss: N/A).
- Sells: 1.02/1.0170 ([reasonably sized H4 bearish close required prior to pulling the trigger] stop loss: ideally beyond the trigger candle).
DOW 30:
Weekly gain/loss: + 16 points
Weekly closing price: 19167
Weekly opening price: 19167
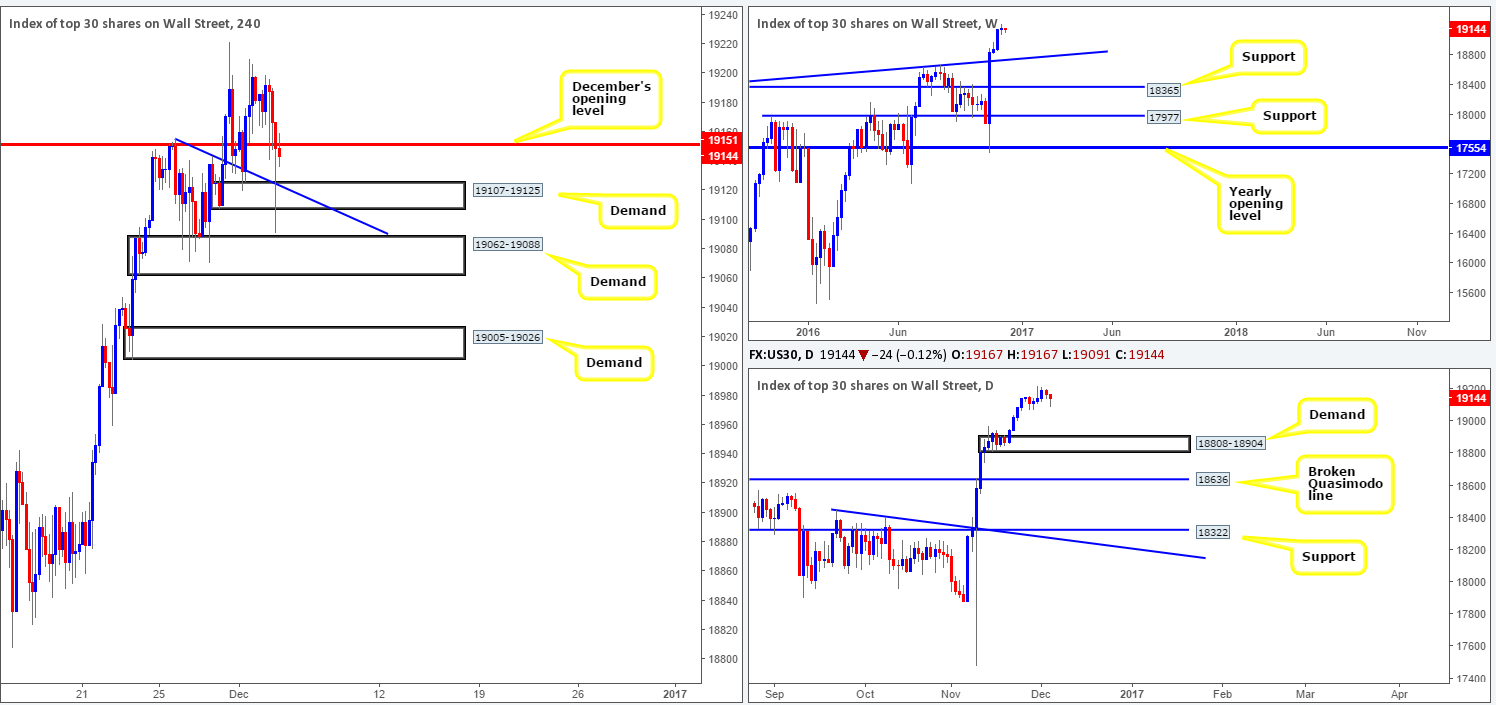
Weekly view: Momentum severely diminished last week in comparison to the prior week’s gain of 277 points, consequently chalking up a clear-cut indecision candle going into the closing bell. In order to join this current trend at support, the closest structure seen on the weekly chart is a trendline support taken from the high 18365.
Daily view: Looking down to the daily candles, the nearest, more obvious, demand to keep an eye on this week comes in at 18808-18904. While this area has a good chance of rebounding price, one needs to remain cognizant of the weekly trendline support mentioned above which lingers just below this zone, hence a fakeout is possible.
H4 view: Equities opened on a bearish footing this morning, smashing through December’s opening level at 19151 and whipsawing through both the trendline support extended from the high 19156 and the demand base at 19107-19125. Price action seems to have now settled around the underside of December’s open, turning up the possibility of a selloff down to the demand seen at 19062-19088 since stops at the above H4 demand have likely been sapped.
Direction for the week: Although a pullback is a possibility, the overall tone remains biased to the upside given the lack of clear higher-timeframe resistance ahead.
Direction for today: With December’s open holding ground, a selloff is likely down to the H4 demand at 19062-19088. A continuation move beyond here opens the door to additional selling down to the H4 demand at 19005-19026. On a side note guys, you may want to bear in mind that none of the above said H4 areas have any connection to higher-timeframe structure.
Our suggestions: A trade from December’s opening level would be valid upon pinning down a lower timeframe sell setup (see the top of this report). Though, do keep in mind that you’re effectively going against the overall uptrend here, and one can never be 100% sure if all the buyers are taken out at the nearby H4 demand. Therefore, to be on the safe side, we would recommend hitting the sidelines today and reassessing going into tomorrow’s sessions.
Data points to consider today: FOMC member Dudley speaks at 1.30pm, ISM non-manufacturing PMI at 3pm, FOMC member Bullard speaks at 7.05pm GMT.
Levels to watch/live orders:
- Buys: Flat (stop loss: N/A).
- Sells: Flat (stop loss: N/A).
GOLD:
Weekly gain/loss: – $5.6
Weekly closing price: 1176.8
Weekly opening price: 1176.8
Weekly view: After three weeks of consecutive losses, the yellow metal extended lower for a fourth session last week. This time, however, price aggressively pierced below the support area visible at 1205.6-1181.3, following a retest off two trendline resistances (1130.1/1071.2). According to our desk, the next downside target can be seen at 1071.3-1097.2: a demand area that boasts exceedingly strong bullish momentum from its base.
Daily view: As of current price, the daily candles are seen entrenched between a supply zone drawn from 1197.4-1187.7 and a support hurdle at 1169.8. To confirm bearish strength from the current weekly resistance area, a daily close below this support would be ideal. This close would likely open up a void down to 1108.2-1117.8: a daily demand.
H4 view: In spite of this morning’s volatility seen across the financial markets, December’s opening level at 1172.9 remains in hand. This could, given the recent spike seen through the resistance area at 1178.5-1182.4, point to further buying today up to supply seen at 1194.8-1189.7.
Direction for the week: A selloff in price is likely according to the weekly candles, but we’d only be convinced of this upon seeing a DAILY close beyond the current daily support level.
Direction for today: Well, considering what we’ve already noted on H4 action, we believe December’s opening level could pressure this market to test the above noted H4 supply at 1194.8-1189.7 today, which happens to be housed within the aforementioned daily supply.
Our suggestions: This is a tricky market to trade! A buy from December’s opening level places one against potential weekly flow and the daily supply (see above). To sell, however, you’d have to contend with not only December’s opening level, but also daily support at 1169.8. With that in mind, we have come to a consensus that technical elements are just too mixed at present, thus we’ll remain on the sidelines for the time being.

Levels to watch/live orders:
- Buys: Flat (stop loss: N/A).
- Sells: Flat (stop loss: N/A).


