
EUR/USD:
Weekly gain/loss: +0.42%
Weekly close: 1.1454
Weekly perspective:
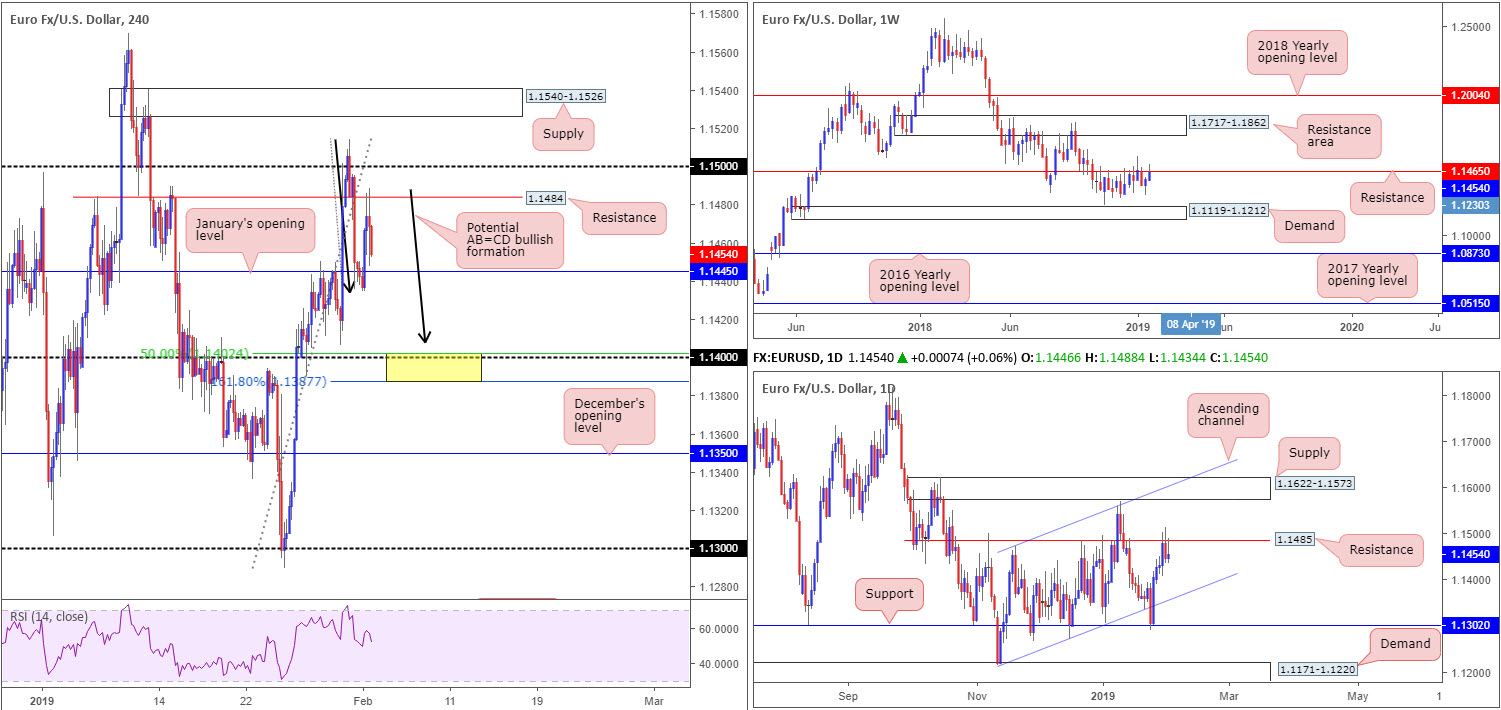
The shared currency enjoyed another reasonably successful week, despite taking a run at resistance priced in from 1.1465. Traders, as pointed out in our previous weekly briefing, are urged not to overlook the current resistance level, as it boasts strong historical significance dating as far back as early February 2015. A rejection to the downside has demand at 1.1119-1.1212 in sight, whereas a push for higher ground this week may eventually bring in the resistance area shown at 1.1717-1.1862.
Daily perspective:
Almost parallel to weekly structure, daily flow encountered active sellers off resistance twenty pips above the current weekly barrier at 1.1485. Approached mid-week, the level responded in the shape of a daily bearish candle Thursday, and followed up with a reasonably nice-looking bearish pin-bar configuration Friday. Downside from this angle has ascending channel support (etched from the low 1.1215) on the radar, while beyond 1.1485 supply at 1.1622-1.1573 is visible, shadowed closely by ascending channel resistance (taken from the high 1.1472).
H4 perspective:
In early US hours Friday, the U.S. Bureau of Labour Statistics reported non-farm payrolls for January saw the US economy add 304,000 new jobs, above the expected 165,000 and the second consecutive month above 300,000. The downside from the report came from the month-on-month average earnings increasing by just 0.1%, under the expected 0.3%, along with the unemployment rate ticking up 0.1% to 4.0%.
The impact of the report triggered an immediate EUR/USD decline (check M5 for a clearer picture) to lows of 1.1453, though swiftly pared losses over the next couple of M5 candles and clocked a high of 1.1485. The M30 timeframe printed an indecision candle. The story on the H4 timeframe, however, reveals a brief flicker of activity was seen around January’s opening level at 1.1445 Friday (price struck lows of 1.1434) before heading for resistance at 1.1484 which held firm into the close.
Areas of consideration:
Having seen weekly flow fading resistance at 1.1465 and daily movement also tackling resistance at 1.1485, a break beneath January’s opening level on the H4 timeframe at 1.1445 could be on the cards this week.
In the event the analysis proves accurate, the H4 candles may complete an AB=CD bullish pattern (black arrows) just ahead of the 1.14 handle around 1.1408. Note 1.14 is joined by a 50.0% support value at 1.1402 and a nearby 161.8% Fibonacci ext. point at 1.1387: the extreme point of the AB=CD play (yellow). Although the market may witness a mild fakeout through this area to bring in daily buyers off the aforementioned ascending channel support, this is certainly an area the research team anticipates a bounce from this week should the pair reach this low.
As there’s a chance of a fakeout forming beneath the yellow area highlighted above, waiting for the H4 candles to chalk up a bullish candlestick pattern before pulling the trigger is an option. This recognises buyer intent, and at the same time provides entry and stop parameters to work with.
Today’s data points: Limited.
GBP/USD:
Weekly gain/loss: -0.93%
Weekly close: 1.3074
Weekly perspective:
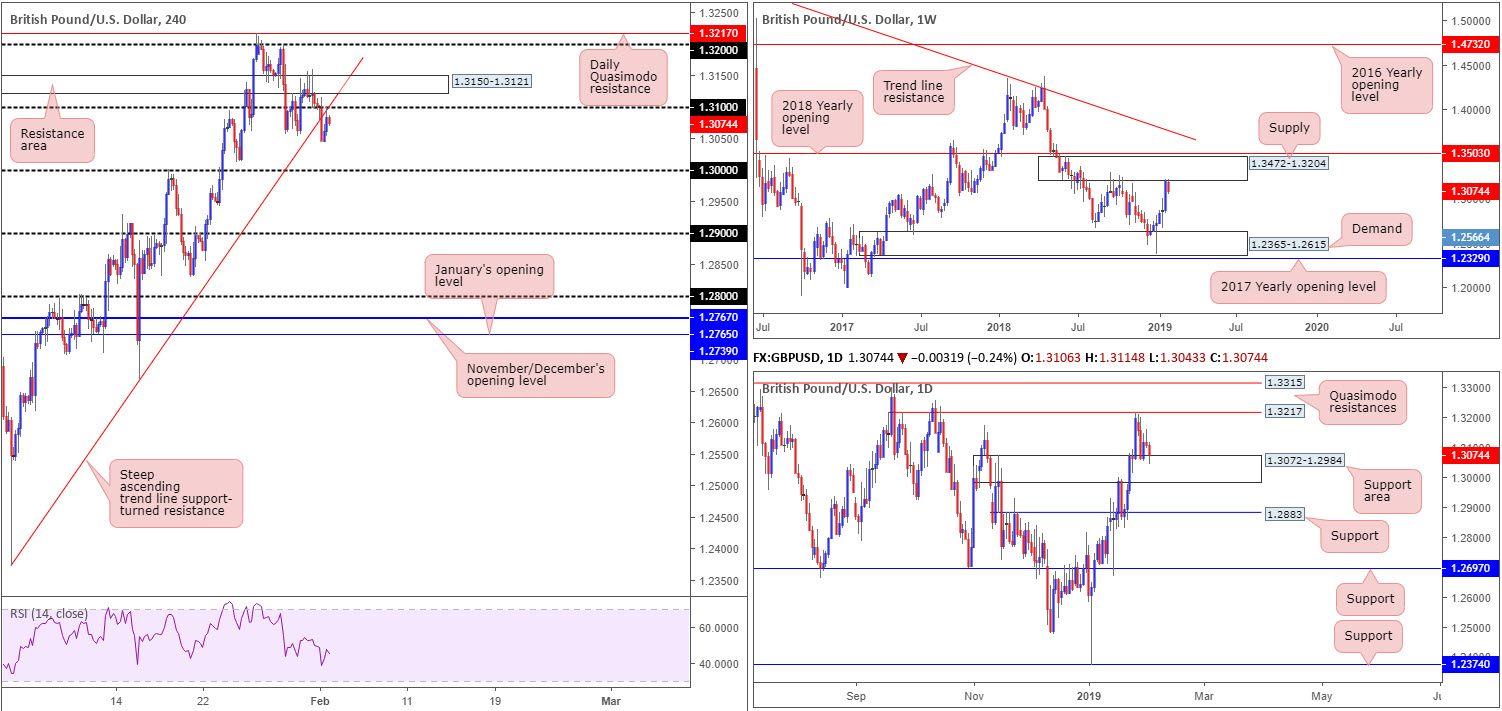
Sterling found itself engaging with the lower border of supply drawn from 1.3472-1.3204 last week. Tailed closely by a 2018 yearly opening level at 1.3503, the current supply, which already capped upside successfully once already in October 2018, has perhaps stimulated interest from the sell side of this market. The next obvious downside target from this region can be seen at demand carved from 1.2365-1.2615.
Daily perspective:
A closer reading on the daily timeframe shows the pair retreated from Friday’s peak off Quasimodo resistance at 1.3217, leading to a test of a support area coming in at 1.3072-1.2984. Judging by the daily candlesticks printed from this area last week – Thursday’s bearish pin-bar formation and continuation selloff Friday – the sellers appear to have the upper hand in this fight. A drive through the current support area, as the weekly timeframe suggests, could bring possible support at 1.2883 into the fray. Beneath here, limited support exists until around 1.2697.
H4 perspective:
Friday’s seasonally adjusted IHS Markit/CIPS purchasing managers’ Index (PMI) – which provides a single-figure tracker of the performance of the sector – fell to a three-month low of 52.8, down from 54.2 in December (Markit), consequently plunging the GBP/USD through steep trend line support (extended from the low 1.2373).
Mixed US job’s figures out of the US followed in early US, which eventually triggered a resurgence of bidding towards the underside of the recently broken trend line support, coupled with merging resistance from 1.31.
Technically speaking, the pendulum appears weighted to the downside this week. H4 structure, along with weekly price trading from supply and daily candles emphasising a fragile tone around the top edge of a support area, may entice selling towards key figure 1.30 this week. Note 1.30 is seen housed within the lower limits of the current daily support area.
Areas of consideration:
On account of our technical studies, selling H4 price sub 1.31 towards 1.30 is an option. However, rather than shorting the piece at the open, it might be an idea to wait for a bearish candlestick signal to form. This provides traders a base to define entry and stop levels and also shows whether or not sellers have interest in this area before committing.
Today’s data points: Limited.
AUD/USD:
Weekly gain/loss: +0.94%
Weekly close: 0.7246
Weekly perspective:
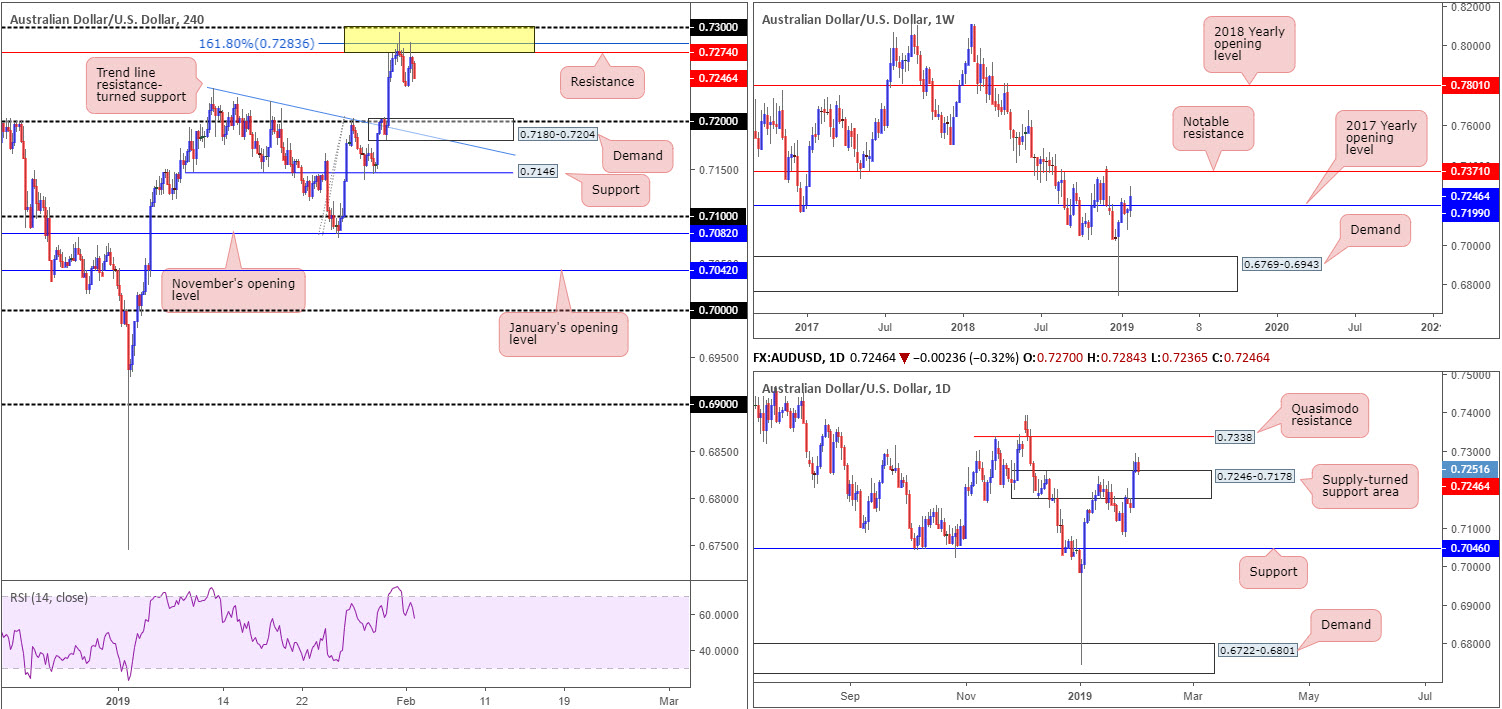
AUD/USD bulls went on the offensive throughout last week’s session, hauling the pair beyond its 2017 yearly opening level at 0.7199. With sellers likely emptied from this neighbourhood, prominent resistance at 0.7371 is in the crosshairs this week.
Daily perspective:
Recent buying, as is evident from the daily timeframe, destroyed supply at 0.7246-0.7178 Wednesday and later retested the zone as a support area Friday. Assuming buyers hold ground here, upside momentum towards Quasimodo resistance at 0.7338 might be observed.
H4 perspective:
A quick review of Friday’s movement on the H4 timeframe reveals the initial impact of the US employment numbers sparked a brief selloff (see M5 for clearer view) that was swiftly countered by an advance. Buyers, nevertheless, failed to sustain gains past highs of 0.7284, mildly drifting to lows of 0.7244 at the close.
In terms of structure on the H4 print, resistance marked in yellow at 0.73/0.7274 remains in motion. Comprised of a round number at 0.73, a 161.8% Fibonacci ext. point at 0.7283 and a resistance level at 0.7274, this zone, according to H4 areas, has the potential to draw in sellers towards demand at 0.7180-0.7204, which happens to hold within it the 0.72 handle.
Areas of consideration:
Assuming the higher-timeframe analysis is accurate, selling H4 structure between 0.73/0.7274 is difficult towards 0.72. However, having observed a strong H4 bearish pin-bar pattern print Thursday out of the zone, as well as a second retest of the area holding Friday, it may still be worth the risk as long as risk/reward parameters are correctly factored into the trade (at least a 1:2 ratio).
In terms of buying opportunities, traders are unlikely to commit until 0.73 is consumed. Above 0.73, the next area of resistance is seen at the daily Quasimodo resistance level mentioned above at 0.7338.
Today’s data points: Limited.
USD/JPY:
Weekly gain/loss: -0.01%
Weekly close: 109.52
Weekly perspective:
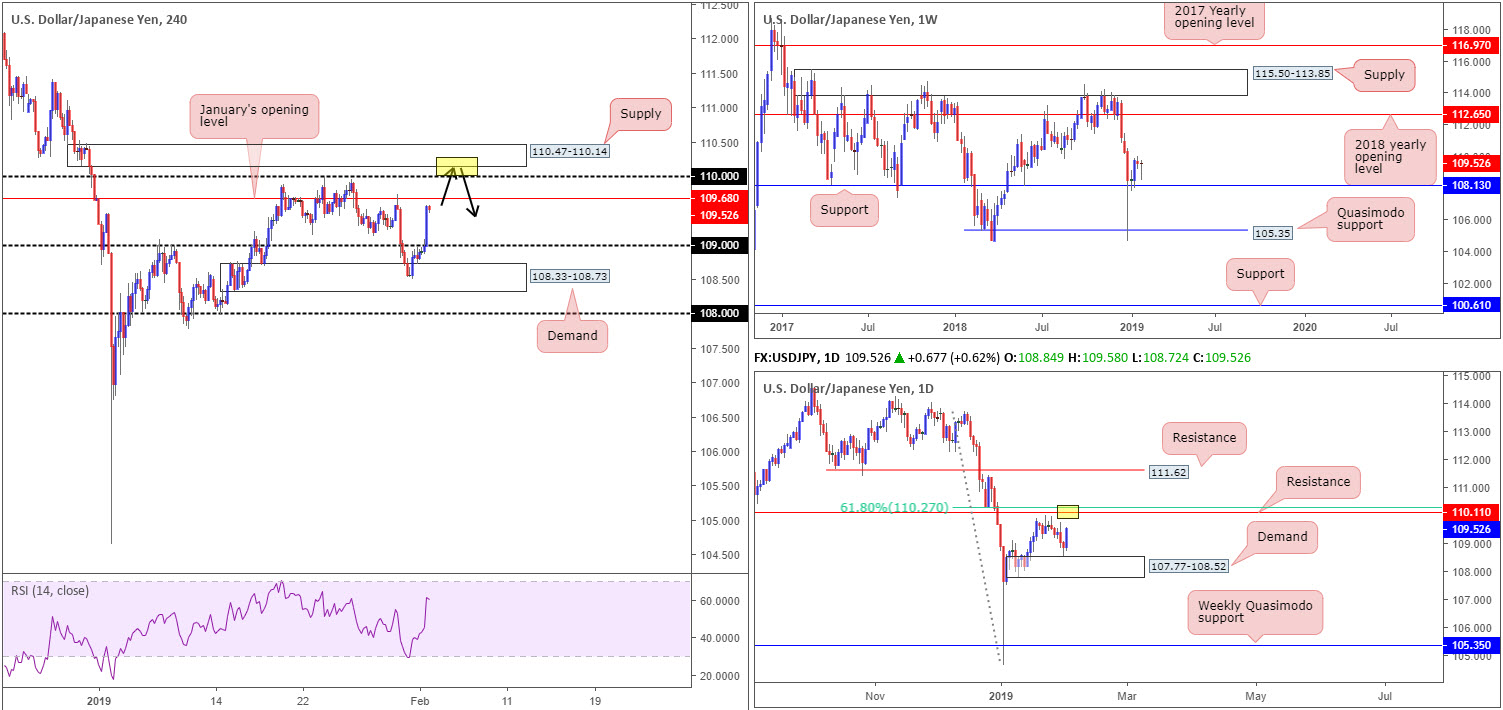
Although the USD/JPY concluded last week’s action unchanged, it’s worth observing the pair closed in the shape of a bullish pin-bar arrangement north of nearby support at 108.13. The research team notes a clear path to the upside from 108.13 until connecting with the 2018 yearly opening level at 112.65. Should the market spin south, nonetheless, Quasimodo support at 105.35 is the next level on the hit list to be aware of beyond 108.13.
Daily perspective:
Leaving resistance at 110.11 and its nearby 61.8% Fibonacci resistance value at 110.27 unchallenged over the past couple of weeks, Thursday’s activity witnessed the candles touch gloves with the top edge of demand coming in at 107.77-108.52, consequently inspiring traders to build on gains Friday by way of a near-full-bodied daily bullish candle. According to this scale, the aforementioned resistance levels are likely to be brought into the mix this week.
H4 perspective:
Reinforced by Friday’s job’s figures out of the US as well as an upbeat US ISM manufacturing PMI print, the H4 candles cleared sellers from its 109 handle and chalked up a near-full-bodied bull candle, closing the week out a few pips south of January’s opening level at 109.68. Beyond this level, traders’ crosshairs are likely fixed on the 110 handle and supply positioned at 110.47-110.14.
Areas of consideration:
Eyes remain on the H4 supply mentioned above at 110.47-110.14. A push above 110 will not only trip stop-loss orders from traders attempting to fade the psychological mark, which, when filled, become buy orders to sell in to, breakout buyers will also likely attempt to join the movement. This offer of liquidity to sell to, coupled with daily resistance seen plotted at 110.10, is likely enough to draw in attention and bring price action lower from the noted H4 supply.
Traders who feel the need to trade the H4 supply based on candle confirmation due to where we’re trading on the weekly timeframe, waiting for a bearish formation to materialise will certainly add weight to a possible rotation lower. Traders who believe the H4 supply and daily resistance is enough evidence to draw sellers’ attention, however, will likely enter short at 110.14 with stop-loss orders planted just north of 110.47. Once, or indeed if, the H4 candles reclaim 109.68 to the downside out of 110.47-110.14, traders can think about reducing risk to breakeven and taking partial profits off the table.
Today’s data points: Limited.
USD/CAD:
Weekly gain/loss: -0.88%
Weekly close: 1.3099
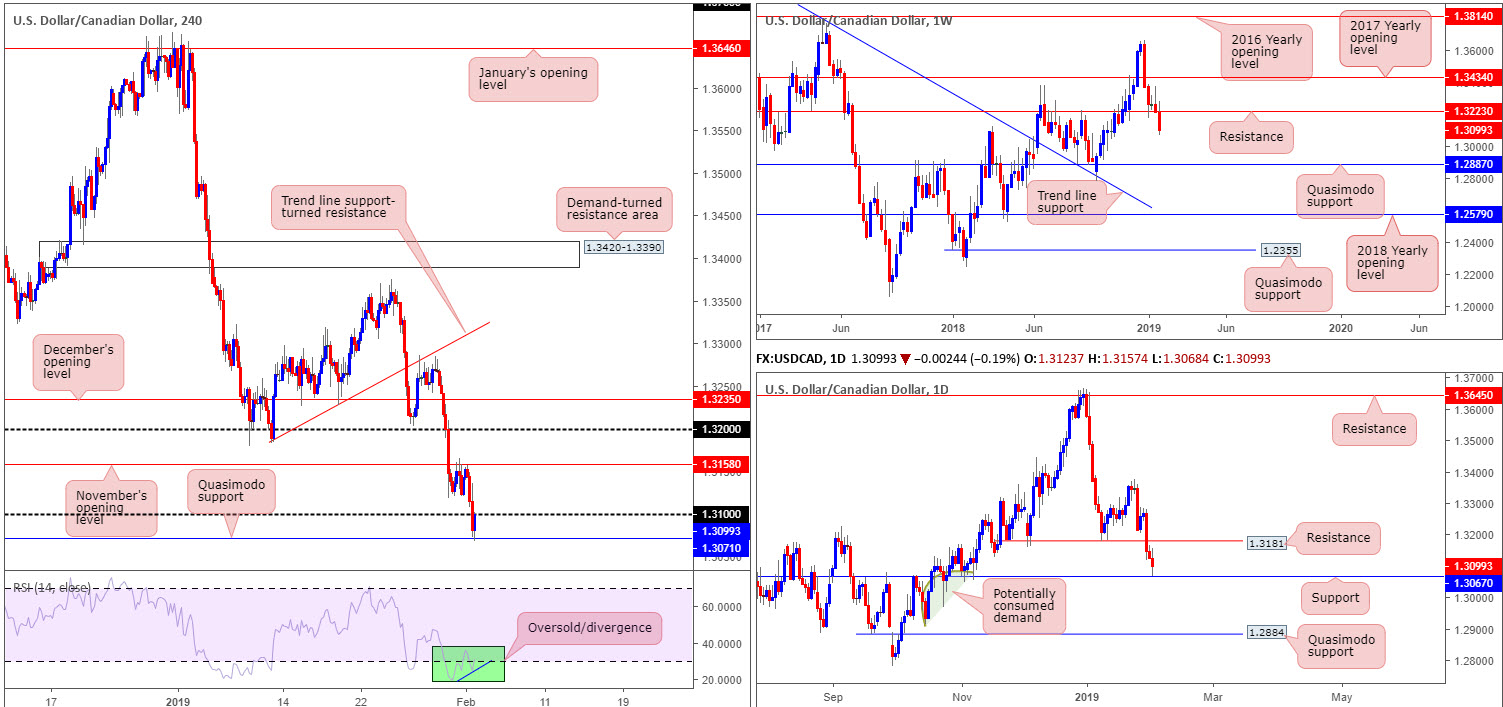
Weekly perspective:
The USD/CAD, as you can see, failed to shield support priced in at 1.3223 last week, causing a substantial near-full-bodied bearish candle to form. To the left, the research team notes limited support (or demand) until shaking hands with a Quasimodo base coming in at 1.2887.
Daily perspective:
After butchering local support at 1.3181 Wednesday, the daily candles exposed earth towards support at 1.3067 which came within a pip of being tested Friday. Sub 1.3067 is interesting. Viewing price action to the left on this scale, traders may want to acknowledge potentially consumed demand (as price advanced, the pair retreated and collected unfilled buy orders) towards a Quasimodo support at 1.2884 (essentially the daily version of the weekly Quasimodo support at 1.2887). For those who follow correlations, WTI, an inversely correlated market to the USD/CAD, is trading within the walls of a supply at 57.93-54.79.
H4 perspective:
Recent dealings on the H4 timeframe show a retest to the underside of November’s opening level at 1.3158 played out and eventually ousted nearby round number 1.31 to the downside. Quasimodo support close by at 1.3071 offered a helping hand, however, as buyers attempted to pare recent losses from here, retesting 1.31 as resistance into the close. The primary driver behind Friday’s losses, according to our studies, was WTI’s advance beyond its $55.00 mark.
It might also be worth noting the RSI indicator is displaying an oversold/divergence reading.
Areas of consideration:
The combination of the H4 Quasimodo support highlighted above at 1.3071 and daily support at 1.3067 may pull the market north today/early week. Reclaiming 1.31 to the upside exposes November’s opening level highlighted above at 1.3158, followed closely by daily resistance registered at 1.3181. A H4 close above 1.31 that’s followed up with a retest (preferably in the shape of a bullish candlestick signal as it provides entry/stop parameters to work with), therefore, is a potentially tradable long this week.
Should we head south, nevertheless, and chalk up a H4 close beneath the current daily support that’s retested as resistance, shorts towards key figure 1.30 on the H4 (not visible on the screen) is another option on the table this week. In similar fashion to the long advertised above, a H4 bearish candlestick configuration forming at the retest is beneficial owing to it offering a structured approach to entry and stop levels.
Today’s data points: Limited.
USD/CHF:
Weekly gain/loss: +0.22%
Weekly close: 0.9953
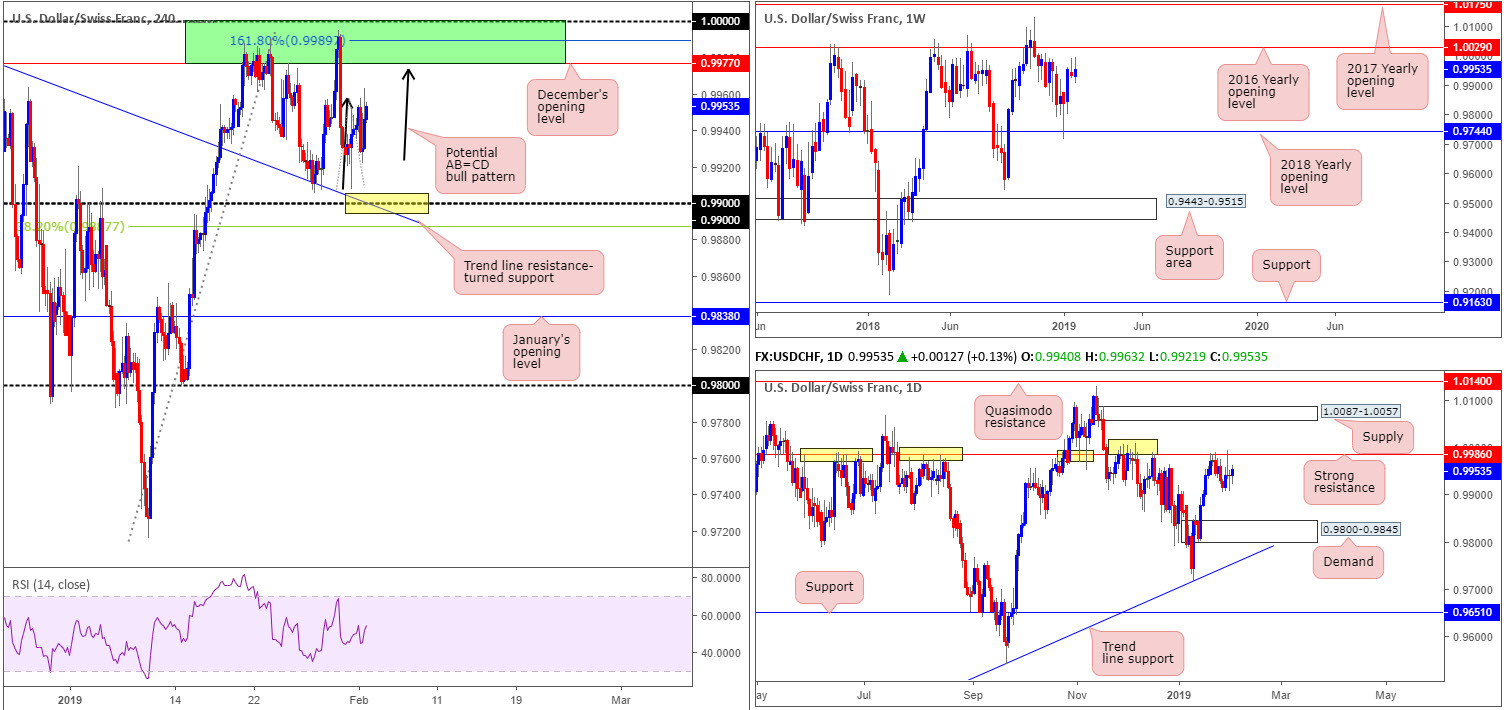
Weekly perspective:
Over the course of last week’s trade, the USD/CHF pencilled in its second consecutive weekly selling wick, positioned just south of the 2016 yearly opening level at 1.0029. Should this trigger a round of selling, the next downside objective enters the frame around the 2018 yearly opening level coming in at 0.9744.
Daily perspective:
Following a crisp bearish pin-bar formation off resistance at 0.9986 Wednesday, Thursday’s movement responded printing a bullish pin-bar pattern. In Friday’s report, the research team noted to expect limited upside movement off the bullish formation. The weekly selling wicks, coupled with the resistance level at 0.9986 boasting strong history (yellow), promotes further downside, targeting demand printed at 0.9800-0.9845.
H4 perspective:
Despite US job’s data hitting the wires Friday, H4 movement was restricted.
To the upside, we have a possible AB=CD bearish pattern (black arrows) forming, which has an extreme point positioned at 0.9989: the 161.8% Fibonacci ext. It’s also worth observing the completion of the AB=CD formation is seen within the parapets of an interesting H4 sell zone (green) between 1.0000 and December’s opening level at 0.9977. In addition to this, we have the daily resistance highlighted above at 0.9986 housed within the H4 area, too.
The point at which the 0.99 handle fuses with the H4 trend line resistance-turned support (extended from the high 1.0008) also has ‘bounce’ written all over it. We like the nearby 38.2% Fibonacci support value at 0.9887 hovering nearby the level, as this could be used to determine stop-loss placement for longs off 0.99.
Areas of consideration:
The two areas highlighted above indicate equal opportunity for longs and shorts this week, though the case for selling is stronger in light of its surrounding confluence and, therefore, could possibly be traded without the need for additional confirmation.
For conservative traders concerned regarding the market’s position on the higher timeframes, waiting for additional confirmation to form off 0.99 may be an idea. However, it must be stressed a bounce is all we feel will take shape from 0.99, therefore drilling down to the lower timeframes and searching for confirming action there might be the best path to take in order to keep risk/reward parameters healthy.
Today’s data points: Limited.
Dow Jones Industrial Average:
Weekly gain/loss: +1.11%
Weekly close: 24999
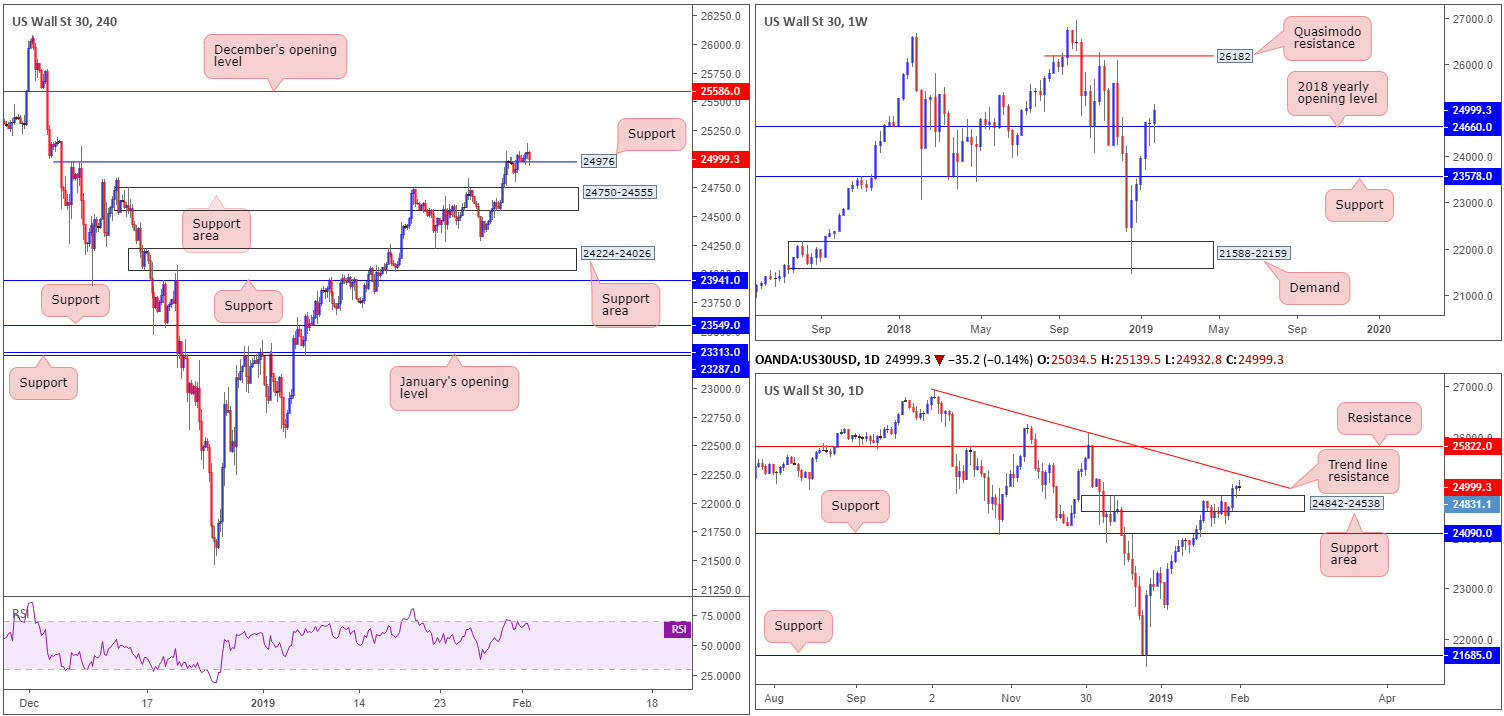
Weekly perspective:
Following on from the bullish pin-bar pattern that closed above the 2018 yearly opening level at 24660, last week’s flow produced a reasonably firm follow through, testing highs of 25139. A resurgence of buying this week could potentially place the index within trading distance of a Quasimodo resistance level at 26182.
Daily perspective:
While weekly flow demonstrates scope to press for higher ground this week, the daily candles are seen hovering within striking distance of a notable trend line resistance (taken from the high 26939) after modestly bouncing from a support area at 24842-24538. Beyond here, though, resistance at 25822 is in sight.
H4 perspective:
Friday’s session, as you can see, concluded the day retesting the top edge of a Quasimodo resistance-turned support at 24976. Key resistance on the H4 scale now rests at December’s opening level drawn from 25586.
Areas of consideration:
The retest of support on the H4 timeframe at 24976, alongside weekly price signaling further buying, a long in this market is certainly an option. With that being said, though, traders are urged to consider waiting for a bullish candlestick formation to take shape off 24976 before pulling the trigger, as it will provide entry and stop levels to trade.
Reducing risk to breakeven upon testing the aforementioned daily trend line resistance is worthy of consideration as strong sellers may reside here. A break above this angle will draw December’s opening level mentioned above on the H4 timeframe at 25586 firmly into the spotlight as the next viable target.
Today’s data points: Limited.
XAU/USD (GOLD):
Weekly gain/loss: +1.10%
Weekly close: 1317.2
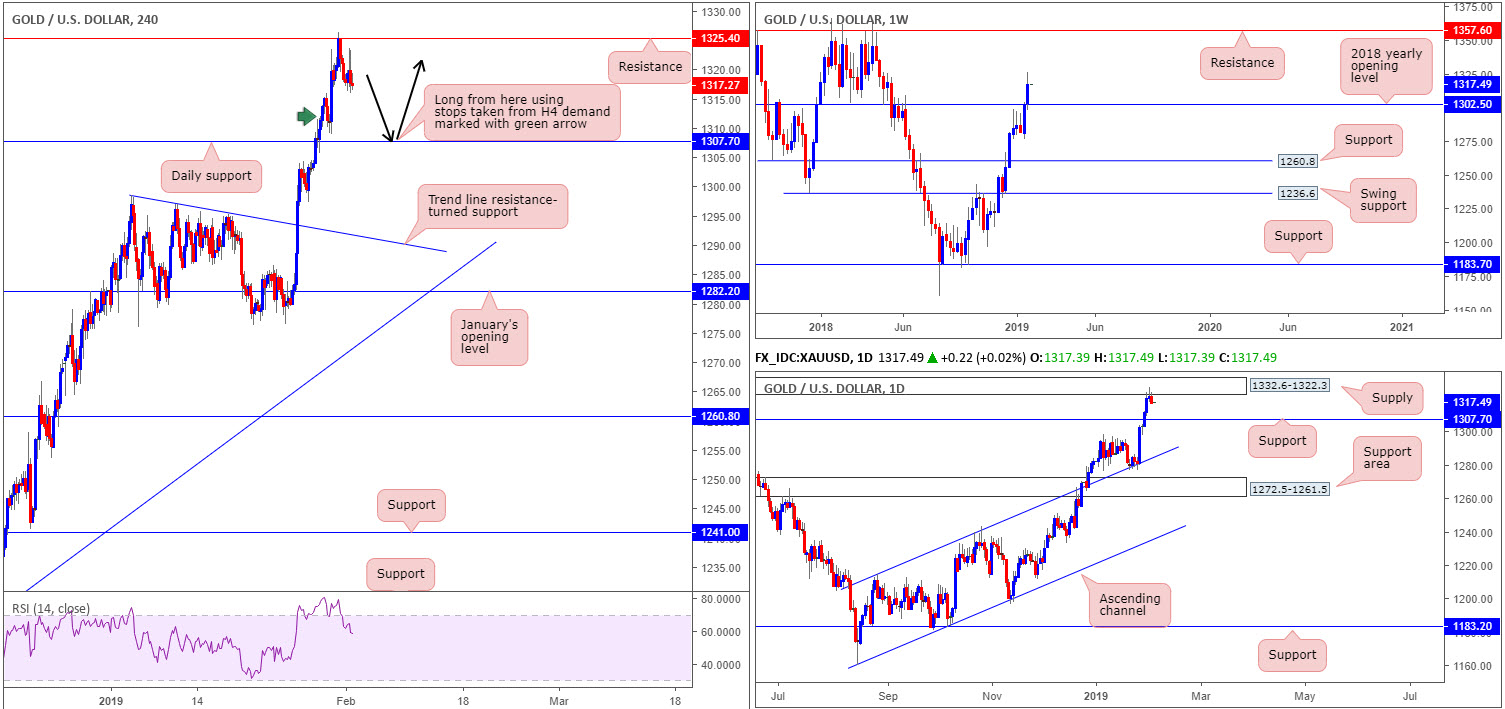
Weekly perspective:
Demand for the yellow metal increased for a second consecutive session last week, firmly toppling resistance in the shape of the 2018 yearly opening level at 1302.5.
With sellers cleared from 1302.5, bullion could pencil in another wave of buying this week, with an ultimate target positioned around resistance at 1357.6. Note this level boasts strong historical significance dating as far back as April 2013.
Daily perspective:
Proven supply drawn from April 2018 at 1332.6-1322.3 entered the fray Wednesday and produced a tasty bearish pin-bar pattern Thursday. Friday’s movement, influenced by a mild USD recovery, extended lower. At this stage, the odds of the unit testing support at 1307.7 are strong. It’s also worth noting this level represents a Quasimodo resistance-turned support taken from the left shoulder printed May 25.
In the event we push higher this week, however, traders may want to mark Quasimodo resistance at 1356.8 as the next port of call on this scale (not seen on the screen).
H4 perspective:
Mixed US job’s data was largely ignored on the H4 scale Friday, limiting price action to a tight range of $7. As is seen from this timeframe, resistance at 1325.4 remains in motion and happens to be positioned within the parapets of the current daily supply zone.
The next downside target from the current resistance falls in around the daily support at 1307.7. As you can probably see, though, a H4 demand (green arrow) is sited a few pips north of this level around the 1312.8 neighbourhood which could bounce price. Trade this demand area with caution, as a stop run beneath the zone will likely take shape in order to accumulate liquidity (sell orders) to enter long. Ultimately, though, we do not expect the fakeout to extend much past the aforementioned daily support, owing to the weekly picture’s structure.
Areas of consideration:
In the event our analysis proves to be correct, the market will eventually cross swords with daily support highlighted above at 1307.7. This level – coupled with weekly price eyeing levels in the 1350s region and a (hopefully) firm bullish candlestick signal (entry/stop parameters can be taken from this structure) out of the H4 timeframe – is enough evidence to consider a long, targeting the noted daily supply zone as the initial port of call.
The use of the site is agreement that the site is for informational and educational purposes only and does not constitute advice in any form in the furtherance of any trade or trading decisions.
The accuracy, completeness and timeliness of the information contained on this site cannot be guaranteed. IC Markets does not warranty, guarantee or make any representations, or assume any liability with regard to financial results based on the use of the information in the site.
News, views, opinions, recommendations and other information obtained from sources outside of www.icmarkets.com.au, used in this site are believed to be reliable, but we cannot guarantee their accuracy or completeness. All such information is subject to change at any time without notice. IC Markets assumes no responsibility for the content of any linked site. The fact that such links may exist does not indicate approval or endorsement of any material contained on any linked site.
IC Markets is not liable for any harm caused by the transmission, through accessing the services or information on this site, of a computer virus, or other computer code or programming device that might be used to access, delete, damage, disable, disrupt or otherwise impede in any manner, the operation of the site or of any user’s software, hardware, data or property.


