
EUR/USD:
Weekly Gain/Loss: -0.53%
Weekly Closing price: 1.1653
Weekly perspective:
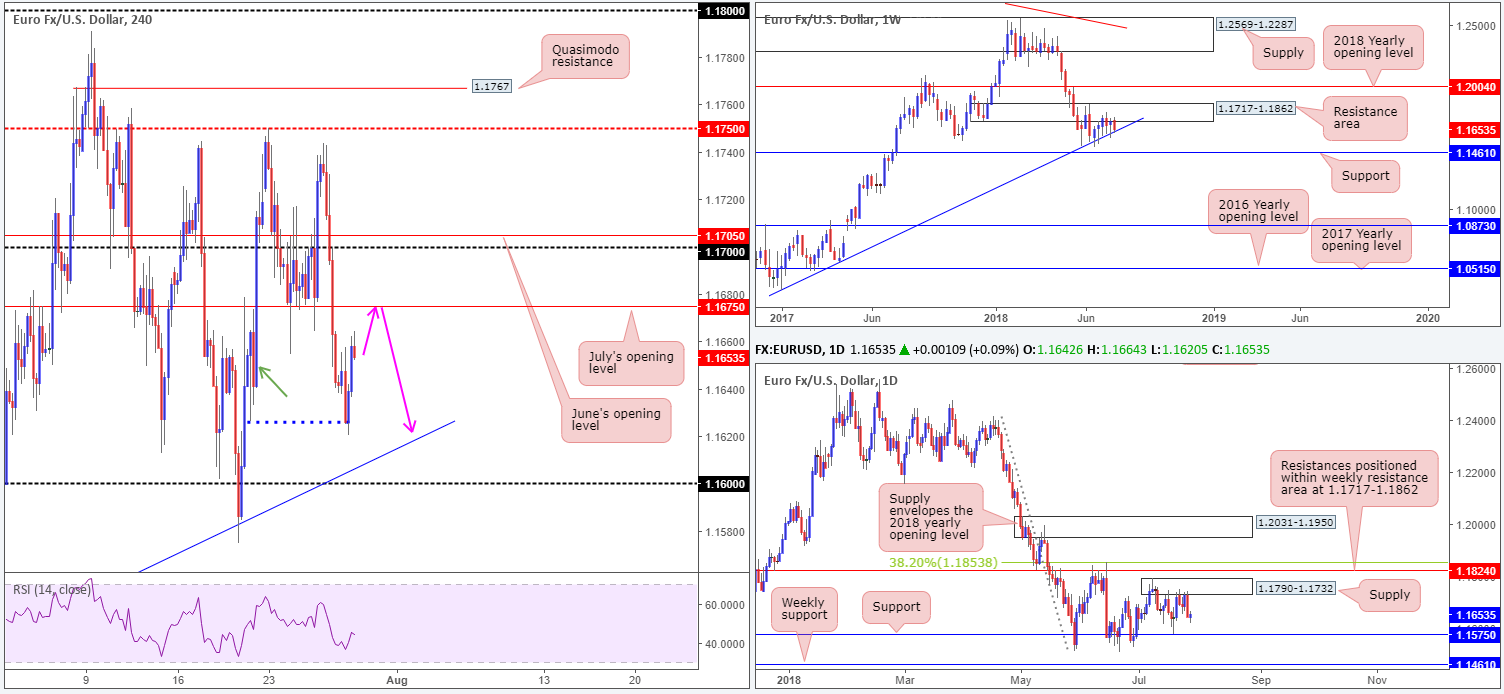
As of late May, the single currency has been confined to a tight range comprised of a resistance area plotted at 1.1717-1.1862 and a trend line support (etched from the low 1.0340). Areas outside of this border to keep eyeballs on fall in at the 2018 yearly opening level drawn from 1.2004 (resistance), and support pencilled in at 1.1461.
Daily perspective:
Supply at 1.1790-1.1732, an area clearly of interest in this market at the moment, steered the unit lower on Thursday in reasonably strong fashion. As a result of this, traders likely have their crosshairs fixed on nearby support coming in at 1.1575 this week, a level which boasts strong history dating as far back as May 2016. Beyond here, as you can see on the daily timeframe, the next area of interest comes in around weekly support mentioned above at 1.1461.
H4 perspective:
Early trade on Friday witnessed a continuation of selling enter the market, though swiftly came to end after the H4 candles bottomed on lower-than-expected US GDP (q/q) data. EUR/USD bulls went on the offensive from lows of 1.1620, concluding the day topping just south of July’s opening level at 1.1675 (1.1664).
Areas of consideration:
As a result of Friday’s movement, H4 price appears free to cross swords with trend line support (taken from the low 1.1508) and the nearby 1.16 handle. Our rationale behind this approach comes from seeing H4 demand around the 1.1626-1.1673 area marked with a green arrow being consumed (blue line denotes the lower edge of the said demand).
With action on the H4 scale potentially free to move lower, the idea going forward is to seek shorting opportunities off July’s opening line at 1.1675, targeting the aforementioned trend line support/1.16 handle (see pink arrows).
The only drawback to a sell in this market, of course, is the current weekly trend line support. To help overcome this, traders are urged to wait and see if H4 price can chalk up a full or near-full-bodied bearish candle off 1.1675 prior to pulling the trigger. This will not guarantee a winning trade but it will show active sellers have interest in the region.
Today’s data points: German prelim CPI m/m; Spanish flash CPI y/y.
GBP/USD:
Weekly Gain/Loss: -0.21%
Weekly Closing price: 1.3107
Weekly perspective:
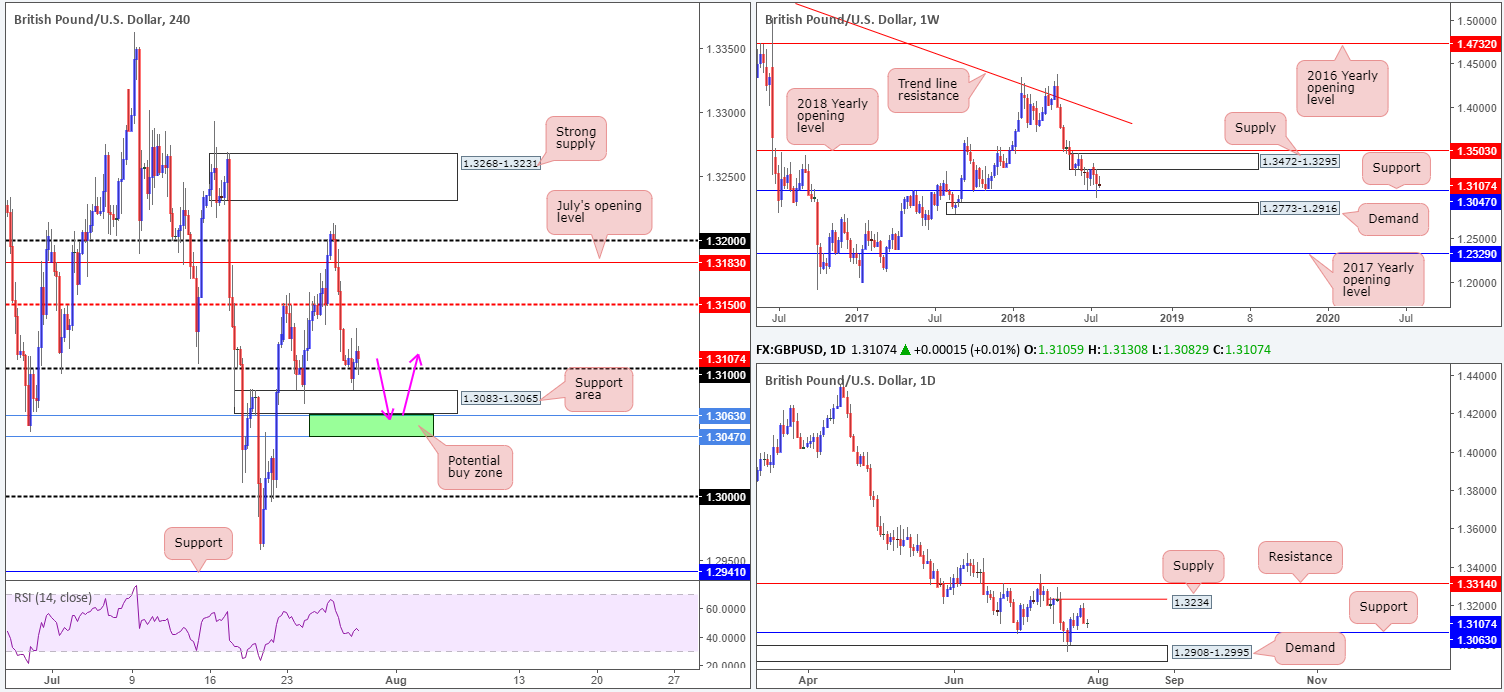
While weekly price remains buoyant above support at 1.3047, a barrier displaying history as far back as mid-2015, buyers failed to generate much upside presence last week. In fact, the week ended in the shape of a bearish pin-bar candle formation.
In the event 1.3047 gives way this week, a base worthy of attention can be seen at 1.2773-1.2916: a strong demand area. Should buyers regain consciousness, on the other hand, supply at 1.3472-1.3295 will be the next area in the firing range.
Daily perspective:
Last week’s trade managed to evade shaking hands with any form of structure on the daily timeframe, as price drifted between a supply seen at 1.3234 and support priced in at 1.3063. Areas outside of this neighborhood can be seen at resistance taken from 1.3314 (positioned within the limits of weekly supply mentioned above at 1.3472-1.3295) and demand at 1.2908-1.2995 (glued to the top edge of the noted weekly demand at 1.2773-1.2916).
H4 perspective:
Friday’s intraday tone was somewhat subdued, despite US GDP data coming in lower than expected and triggering a round of USD selling. What is notable from a technical perspective, though, is price whipsawed below 1.31 and tested the nearby support area at 1.3083-1.3065, practically mirroring Monday’s movement (July 23 – yellow circle).
Areas of consideration:
With 1.31 still in play, along with its closely associated H4 support area mentioned above at 1.3083-1.3065, shorting this market remains a challenge.
In its place, the team has highlighted a potential buy zone that, in our opinion, ‘makes sense’ on the H4 timeframe, comprised of both the weekly and daily supports seen marked in green at 1.3047/1.3063. Stop-loss orders beneath 1.31 and the noted H4 support area will likely provide liquidity to those with big pockets looking to buy from 1.3047/1.3063. The first ‘trouble’ area from here can be seen at 1.31. A H4 close above this number would be an ideal cue to begin thinking about taking some profit off the table and reducing risk to breakeven.
Today’s data points: UK Net lending to individuals m/m.
AUD/USD:
Weekly Gain/Loss: -0.31%
Weekly Closing price: 0.7401
Weekly perspective:
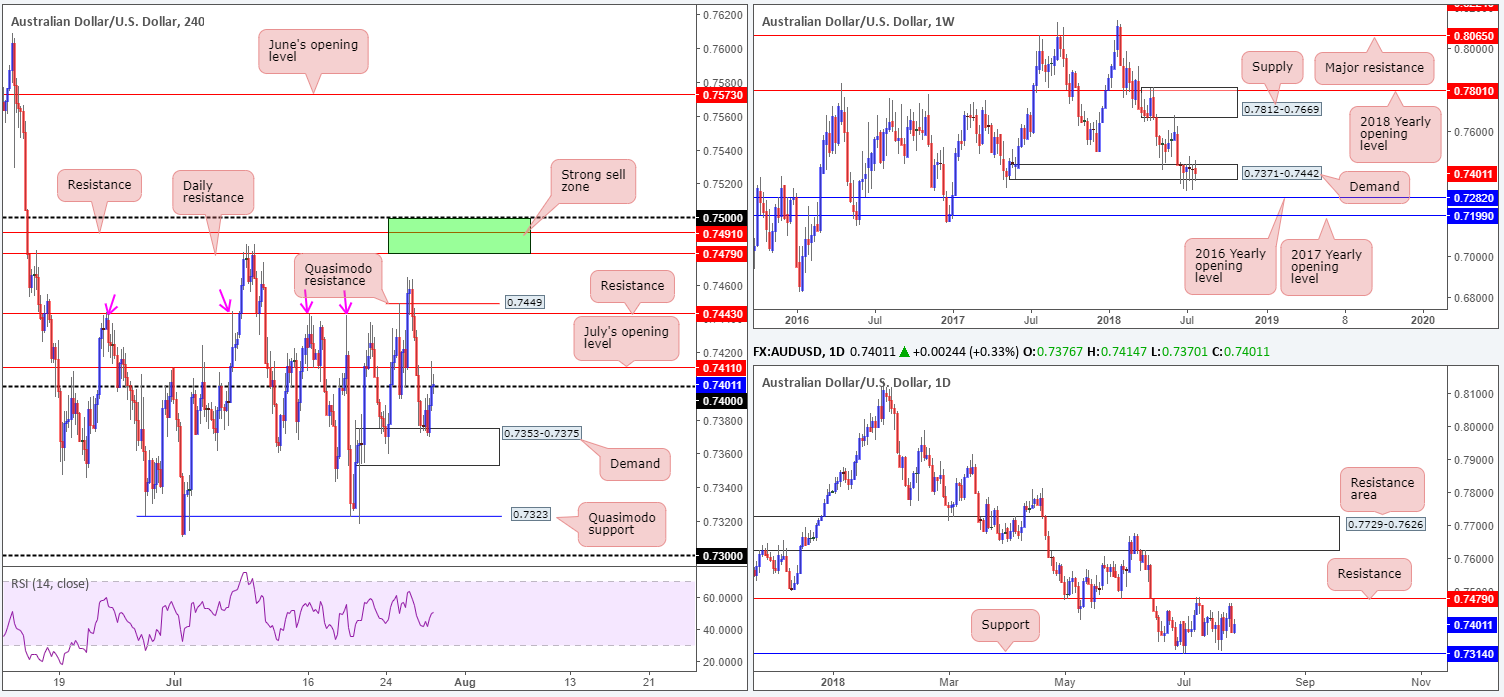
In terms of weekly price action, little has changed over the past month. Demand at 0.7371-0.7442, as you can see, remains in a fragile state at the moment, opening the window to a possible test of the 2016 yearly opening level at 0.7282 sometime down the road. In the event the bulls regain consciousness, however, a retest of supply at 0.7812-0.7669 may eventually be on the cards.
Daily perspective:
The reason behind the lack of movement on the weekly timeframe, technically that is, likely has something to do with the fact daily flow continues to respect its current range. Since early July, the commodity currency has fluctuated between support drawn from 0.7314 and resistance chalked up at 0.7479.
H4 perspective:
Less-than-stellar US GDP data on Friday drove the Aussie dollar higher from demand painted at 0.7353-0.7375. The move, however, found mild resistance from the underside of the 0.74 handle and nearby resistance in the form of July’s opening level at 0.7411, as we headed into the closing bell. A break above these levels this week would likely place resistance at 0.7443 and a Quasimodo resistance at 0.7449 in the spotlight.
Areas of consideration:
It’d be difficult for just about any technician to say H4 structure is not restricted right now. Between 0.7411 and 0.7443 one has less than 30 pips to play with, whereas a rejection off 0.74, sellers have the top edge of demand to target at 0.7375 – even less room! Adding to this, weekly price continues to echo an indecisive tone, and daily movement is, at current price, trading mid-range between 0.7479/0.7314.
On account of the above, neither a long nor short seems attractive at the moment. Remaining on the sidelines may, therefore, be the safer bet for the time being.
Today’s data points: Limited.
USD/JPY:
Weekly Gain/Loss: -0.34%
Weekly Closing price: 110.97
Weekly perspective:
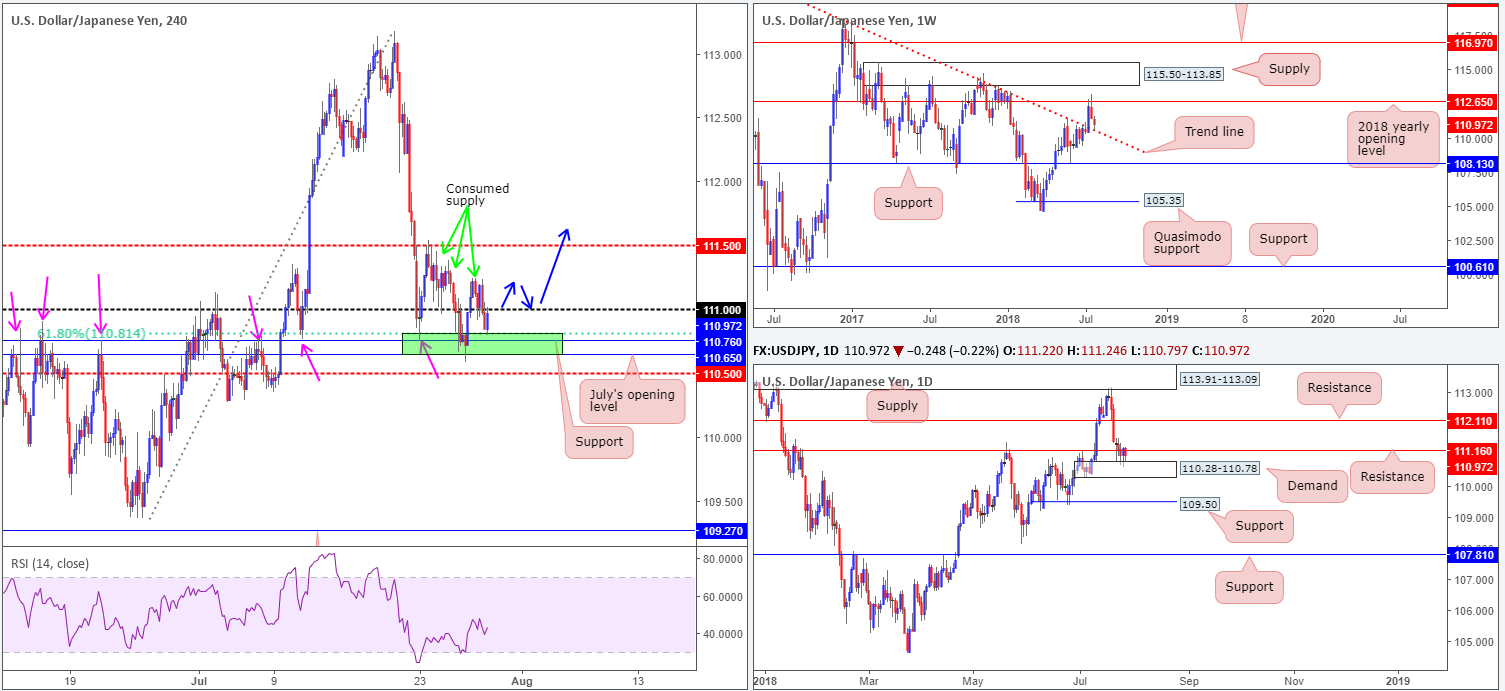
Following a retest to the underside of the 2018 yearly opening level at 112.65 two weeks back, price recently crossed swords with a trend line resistance-turned support (taken from the high 123.57). Having seen this line hold firm as resistance on a number of occasions in the past, it’s likely we’ll witness a round of buying take place from here as support this week.
Daily perspective:
What’s also notable about the current weekly trend line support is it converges with the top edge of daily demand posted at 110.28-110.78. Regrettably, though, nearby daily resistance at 111.16 is proving a troublesome barrier to overcome. Beyond this line, resistance is not expected to enter the fold until 112.11.
H4 perspective:
Intraday movement on Friday saw the USD/JPY plunge below the 111 handle in a matter of minutes, following headline US GDP print a lower-than-expected read. Sellers continued to reign following the break of 111, bringing the candles to an interesting area of support marked in green at 110.65/110.81 (comprised of July’s opening level, a support level and a 61.8% Fib support).
Areas of consideration:
With the 111 handle lurking directly above current price, as well as nearby daily resistance at 111.16, entering long from the green zone mentioned above on the H4 timeframe at 110.65/110.81 is a challenge.
Similar to Friday’s suggestion, waiting for H4 price to close above 111 and retest the top edge of the base as support could be a way forward for longs (blue arrows). To the left (above 111) we see limited supply (see H4 chart – green arrows). This – coupled with the possibility of weekly buyers lifting price action higher off its trend line support and eventually breaking through daily resistance adds weight to longs here we believe.
Should the retest of 111 form in the shape of a H4 full or near-full-bodied candle this would, in our view, be enough to consider longs in this market. As for take-profit targets, the ultimate area of interest falls in at the 2018 yearly opening level seen on the weekly timeframe drawn from 112.65.
Today’s data points: Limited.
USD/CAD:
Weekly Gain/Loss: -0.68%
Weekly Closing price: 1.3058
Weekly perspective:
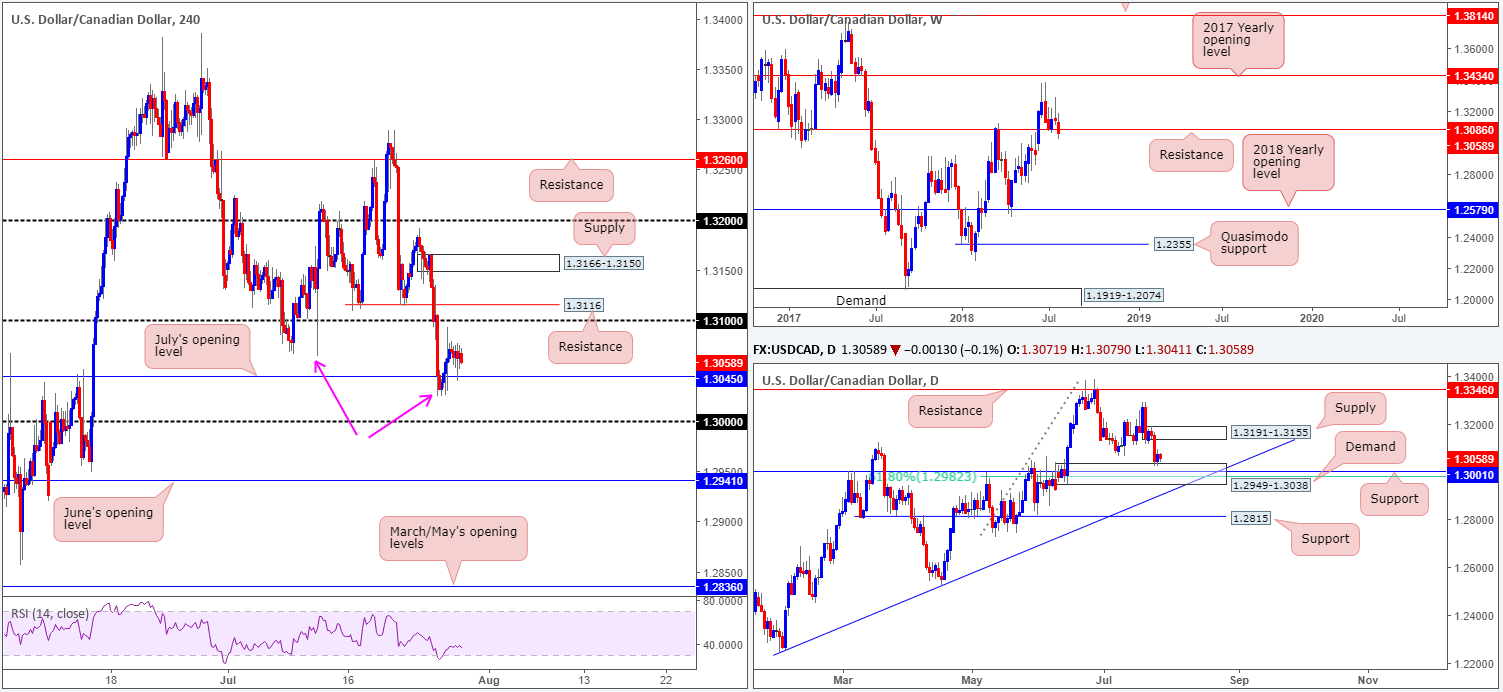
Over the course of last week’s session, the USD/CAD eked out a second consecutive weekly loss, ending the week closing beneath support coming in at 1.3086 (now acting resistance). In terms of obvious support beneath 1.3086, we do not see a whole lot stopping this market from reaching as far south as 1.2579: the 2018 yearly opening level.
Daily perspective:
In spite of last week’s close beneath weekly support, daily price remains toying with the top edge of a rather attractive demand area visible at 1.2949-1.3038. Within this area we also see strong support standing at 1.3001 (history dating back to Sept 2016), followed closely by a 61.8% Fib support value at 1.2982. The next upside target from this area can be seen around supply fixed at 1.3191-1.3155.
H4 perspective:
A quick recap of Friday’s trade on the H4 timeframe shows limited movement. Despite this, the market witnessed a retest to the top edge of July’s opening level at 1.3045 that held firm. Further buying from this point has the 1.31 handle in view, shadowed closely by resistance printed at 1.3116 (a prior double bottom).
Areas of consideration:
1.31 is likely on the radar for the majority of traders for shorts, having seen we recently made a lower low (pink arrows) on the H4 timeframe. Be that as it may, sell trades from here are chancy, in our humble view, due to daily price showing room to approach supply mentioned above at 1.3191-1.3155. The more preferred area for shorts, therefore, falls in around H4 supply at 1.3166-1.3150 as it is glued to the underside of the said daily supply.
Today’s data points: Limited.
USD/CHF:
Weekly Gain/Loss: +0.19%
Weekly Closing price: 0.9936
Weekly perspective:
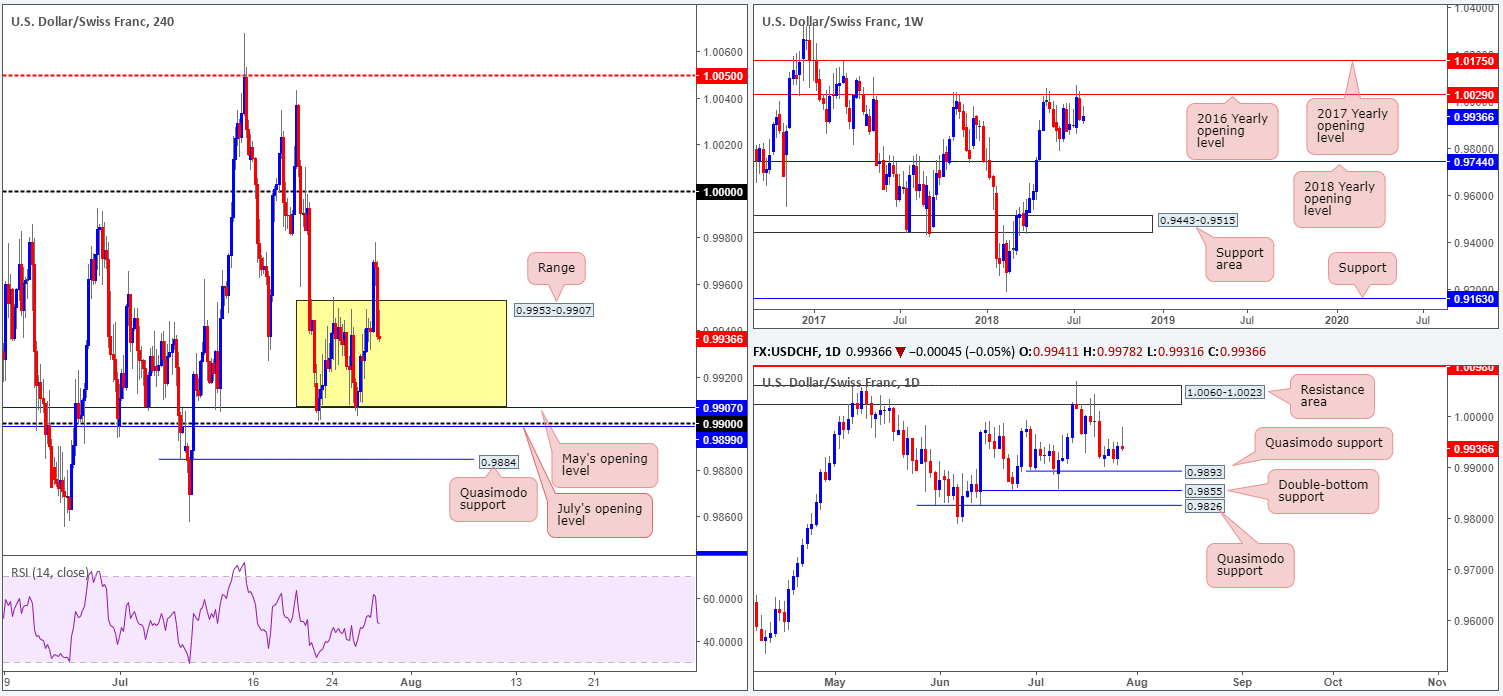
Weekly price remains capped by the 2016 yearly opening level at 1.0029. Holding price lower on two occasions in 2017, and twice already in 2018, this level commands attention! Further selling from current price has the June lows at 0.9788 to target, as well as the 2018 yearly opening level at 0.9744.
Daily perspective:
Besides Friday’s bearish pin-bar candle formation, the market traded relatively sedated last week on this scale. Focus continues to hone in on the Quasimodo support seen nearby at 0.9893, followed closely by additional layers of supports at 0.9855 (a double-bottom formation) and another Quasimodo support at 0.9826. Traders may have also noticed the resistance area seen overhead plotted at 1.0060-1.0023, which happens to encapsulate the aforementioned 2016 yearly opening level on the weekly timeframe.
H4 perspective:
Amid European trade on Friday, the H4 candles spun off into a phase of buying, reaching a weekly high of 0.9978. Though an earnest attempt from the bulls here, disappointing US GDP data triggered an immediate selloff, paring recent gains and bringing the market back into its weekly range at 0.9953-0.9907 (yellow zone).
Areas of consideration:
Having seen a daily bearish pin-bar candle formation print on Friday in the direction of the daily Quasimodo support level mentioned above at 0.9893, USD selling may be seen in early trade this week.
A fakeout below the lower edge of the current H4 range at 0.9907, as well as nearby H4 levels at 0.99/0.9899 (round number and July’s opening level), down to the H4 Quasimodo support at 0.9884 is a possible move to watch out for. Stops taken from below the H4 consolidation should provide institutional traders liquidity to buy. Remember, entering long from 0.9884 also has daily Quasimodo support (0.9893) backing the move, so a break back above 0.99 could be on the cards (a good time to be thinking of reducing risk to breakeven). For those looking to trade long from 0.9884, aggressive stop placement can be positioned at 0.9877, while conservative traders may opt for the apex of the H4 Quasimodo formation at 0.9857.
Should the market witness a H4 close above the range (0.9953), nevertheless, a retest to this area as support in the shape of a full or near-full-bodied H4 bull candle would, in our technical view, be enough to warrant further upside to parity (1.0000). Stop-loss orders are best placed beyond the rejection candle’s tail.
One final point to bear in mind is any longs in this market will be AGAINST weekly flow, so do take this into account before pulling the trigger!
Today’s data points: KOF economic barometer.
Dow Jones Industrial Average:
Weekly Gain/Loss: +1.48%
Weekly Closing price: 25417
Weekly perspective:
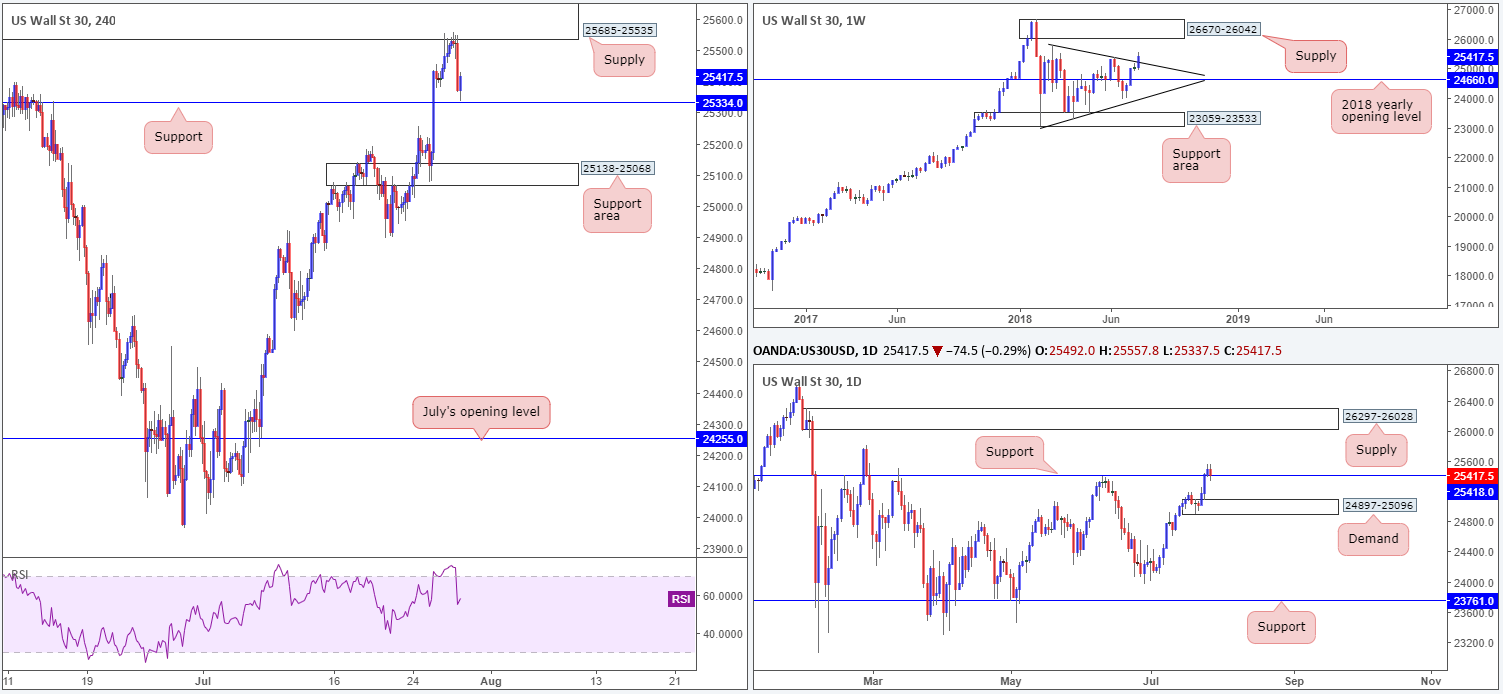
Registering its fourth consecutive weekly gain last week, the index elbowed its way through trend line resistance (etched from the high 25807), potentially setting the stage for further upside to supply positioned at 26670-26042 this week. While price may continue to gravitate higher at the open, traders also need to remain prepared for the possibility of a retest of the recently broken trend line resistance playing out beforehand.
Daily perspective:
In conjunction with weekly flow, daily resistance at 25418 was also taken out and retested as support in the later stages of last week. Assuming the level holds as support, the odds of price reaching daily supply at 26297-26028 (glued to the underside of the weekly supply zone at 26670-26042) are high, in our humble view.
H4 perspective:
Breaking a three-day bullish phase, Friday’s movement found active sellers from the underside of supply at 25685-25535 (an area with sound history dating back to February of this year), pulling the candles down to just ahead of a support level drawn from 25334 into the close. Note this H4 support level is positioned just south of the current daily support mentioned above at 25418. A break of the current H4 level uncovers the H4 support area seen at 25138-25068.
Areas of consideration:
Having seen both weekly and daily price standing in a strong position at the moment, sellers from the underside of the current H4 supply zone may struggle to print anything noteworthy beyond the current H4 support level this week. With that being the case, we strongly recommend treading carefully should an attempt be made to sell the breakout of 25334.
To be convinced of buyer intent, the team has noted to wait and see if daily price pencils in a full or near-full-bodied candle off support at 25418. This – coupled with room seen on the weekly timeframe to push higher – would possibly be enough to push through H4 selling (the H4 supply at 25685-25535), and therefore is a valid medium-term buy signal (stop-loss order best placed beyond the candle’s rejection tail), targeting the underside of the current daily supply zone.
Today’s data points: Limited.
XAU/USD (Gold)
Weekly Gain/Loss: -0.63%
Weekly Closing price: 1223.7
Weekly perspective:
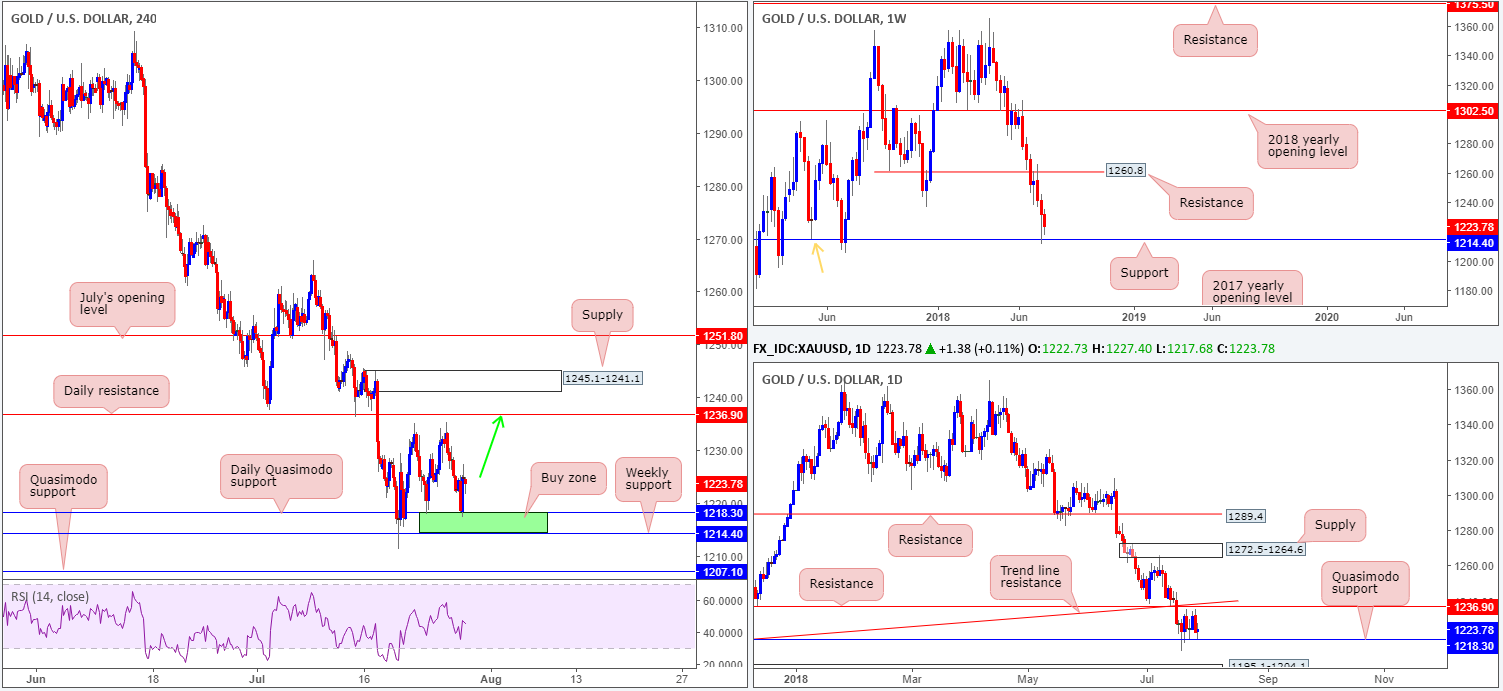
A clear victim of USD strength, the price of gold continued to weaken last week, despite recently rebounding from notable support at 1214.4. Note this level also happens to represent a Quasimodo support taken from the left shoulder marked with an orange arrow.
Daily perspective:
In terms of daily movement, the candles continue to respect a Quasimodo support located at 1218.3. The disappointing aspect from here, however, is over the past week price has attempted to probe higher, though failed ahead of nearby resistance at 1236.9, which, as you can see, converges with a trend line support-turned resistance (carved from the low 1195.1). The next base to be aware of, should we see the yellow metal push south this week that is, comes in at 1195.1-1204.1: a demand area.
H4 perspective:
In spite of a bearish overtone in this market, given the current trend (see higher timeframes), readers may recall the team highlighted a possible buy zone on the H4 timeframe marked in green at 1214.4/1218 (weekly and daily supports – see above). Well done to any of our followers who managed to take advantage of this area as price respected the zone beautifully on Friday.
Areas of consideration:
Though little development is being seen off higher-timeframe supports at the moment, we believe buyers will continue bidding the price of gold higher from 1214.4-1218.3 on the H4 scale until reaching daily resistance at 1236.9. It is here we feel strong sellers reside.
On account of this, should you have missed the initial push from 1214.4-1218.3 on Friday, entering long at current price is an option owing to Friday’s strong near-full-bodied H4 bull candle (stops should be positioned either below the H4 rejection tail at 1217.3, or below 1214.4 – the latter being the more conservative route).
The use of the site is agreement that the site is for informational and educational purposes only and does not constitute advice in any form in the furtherance of any trade or trading decisions.
The accuracy, completeness and timeliness of the information contained on this site cannot be guaranteed. IC Markets does not warranty, guarantee or make any representations, or assume any liability with regard to financial results based on the use of the information in the site.
News, views, opinions, recommendations and other information obtained from sources outside of www.icmarkets.com.au, used in this site are believed to be reliable, but we cannot guarantee their accuracy or completeness. All such information is subject to change at any time without notice. IC Markets assumes no responsibility for the content of any linked site. The fact that such links may exist does not indicate approval or endorsement of any material contained on any linked site.
IC Markets is not liable for any harm caused by the transmission, through accessing the services or information on this site, of a computer virus, or other computer code or programming device that might be used to access, delete, damage, disable, disrupt or otherwise impede in any manner, the operation of the site or of any user’s software, hardware, data or property.


