
Waiting for lower timeframe confirmation is our main tool to confirm strength within higher timeframe zones, and has really been the key to our trading success. It takes a little time to understand the subtle nuances, however, as each trade is never the same, but once you master the rhythm so to speak, you will be saved from countless unnecessary losing trades. The following is a list of what we look for:
- A break/retest of supply or demand dependent on which way you’re trading.
- A trendline break/retest.
- Buying/selling tails/wicks – essentially we look for a cluster of very obvious spikes off of lower timeframe support and resistance levels within the higher timeframe zone.
We typically search for lower-timeframe confirmation between the M15 and H1 timeframes, since most of our higher-timeframe areas begin with the H4. Stops are usually placed 1-3 pips beyond confirming structures.
EUR/USD:
Weekly gain/loss: – 136 pips
Weekly closing price: 1.1811
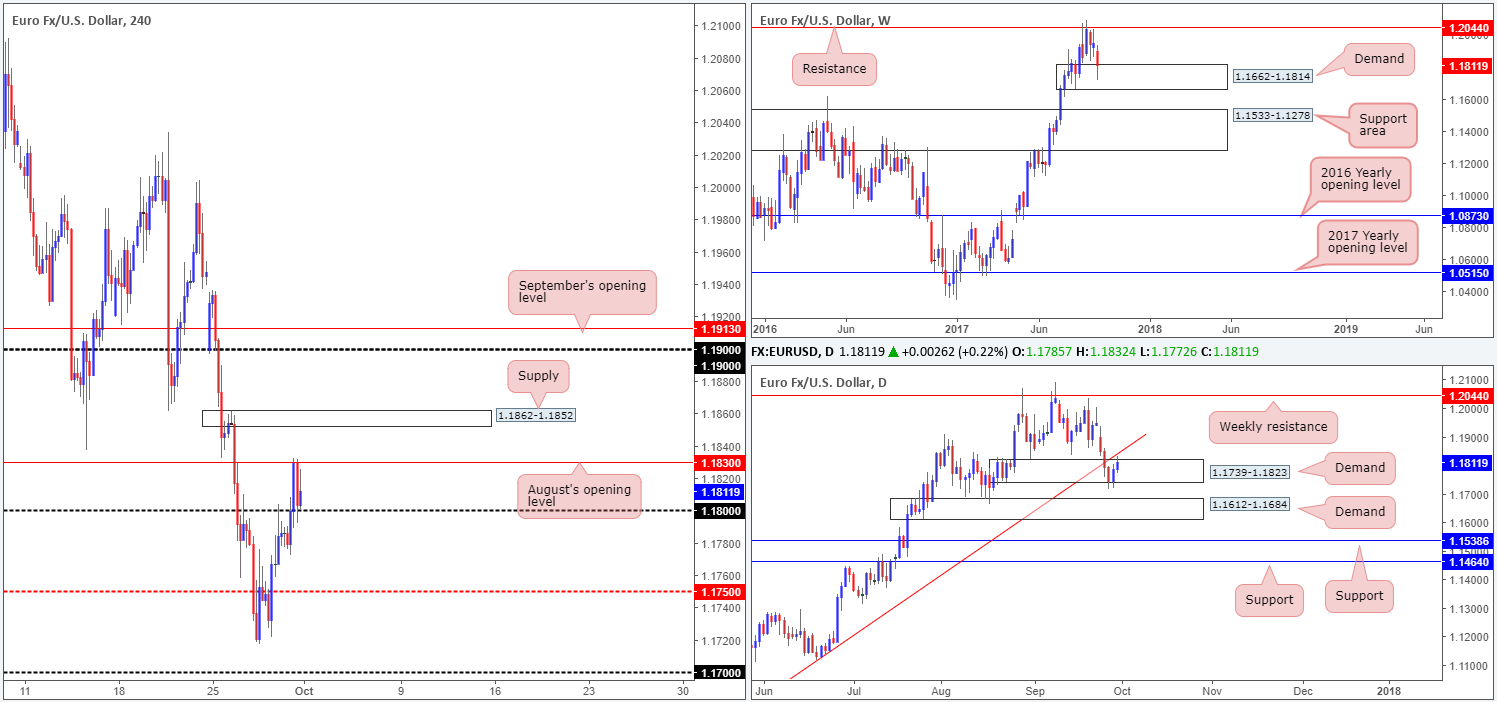
After crossing swords with weekly resistance at 1.2044 five weeks ago, the major finally confronted the nearby weekly demand at 1.1662-1.1814 last week. Also of particular interest is the fact that the weekly USDX candles are currently testing supply noted at 12012-11907. Should bids fail to support EUR demand this week, watch for a revisit of the large weekly support area seen below it at 1.1533-1.1278.
Turning our attention to the daily timeframe, last week’s action shows demand at 1.1739-1.1823 remained in play despite suffering a minor break to the downside. This – coupled with the USDX daily candles presently shaking hands with supply at 11969-11938, could lead to price action overwhelming the nearby trendline resistance extended from the low 1.0839.
A quick recap of Friday’s segment on the H4 timeframe shows price managed to conquer the 1.18 handle amid London’s morning trade. This immediately saw the single currency gravitate towards August’s opening level at 1.1830, which, as you can see, held ground into the close.
Suggestions: Let’s just run through what we have here:
- Weekly demand (EUR/USD) – weekly supply (USDX).
- Daily demand/daily trendline resistance (EUR/USD) – daily supply (USDX).
- H4 currently capped by the 1.18 handle and August’s opening level.
On account of the above, our team believes the EUR may probe higher this week. Unfortunately though, we do not see any immediate buying opportunities on the H4 timeframe. It would take a break through both the noted monthly open level and nearby H4 supply at 1.1862-1.1852, before we see any space for the bulls to stretch their legs up to the 1.19 neighborhood.
Data points to consider: US ISM Manufacturing PMI at 2.45pm, followed by FOMC member Kaplan speaking at 7pm GMT+1.
Levels to watch/live orders:
- Buys: Watch for H4 price to close above 1.1862-1.1852 and then look to trade any retest seen thereafter ([waiting for lower-timeframe confirmation to form following the retest is advised [see the top of this report] stop loss: dependent on where one confirms the area).
- Sells: Flat (stop loss: N/A).
GBP/USD:
Weekly gain/loss: – 96 pips
Weekly closing price: 1.3395
Pound sterling sustained further losses for a second straight week in recent dealings, erasing close to 100 pips of value and bringing the unit down to a broken weekly Quasimodo line pegged at 1.3371. While a small end-of-week correction was seen from this level, there’s a possibility that price may push lower to test the weekly channel resistance-turned support extended from the high1.2706, shadowed closely by a daily support area coming in at 1.3268-1.3203.
Over the last week, as you can see, H4 structure has largely been dominated by psychological support and resistance levels. The mid-level support 1.3350, bolstered by a minor demand at 1.3344-1.3371, has so far withstood two bearish attacks and is therefore likely a focal point for many traders right now. As the top edge of the current H4 demand zone also represents the noted weekly support, there is a good chance that higher prices may materialize from here.
Suggestions: Given the GBP’s underlying trend pointing northbound at the moment, along with current weekly support, the team remains biased to the upside. However, to long this market, two things need to happen, in our opinion:
- H4 price needs to close above 1.34.
- A retest of 1.34 as support is required.
Given that the first take-profit target will likely be the H4 mid-level resistance 1.3450, entering on the lower timeframes following the retest may be the better path to take here (see the top of this report for ideas on how to use lower-timeframe action to enter the market). This would help reduce the stop-loss distance and therefore increase risk/reward.
Data points to consider: UK Manufacturing PMI at 9.30am. US ISM Manufacturing PMI at 2.45pm, followed by FOMC member Kaplan speaking at 7pm GMT+1.

Levels to watch/live orders:
- Buys: Watch for H4 price to close above 1.34 and then look to trade any retest seen thereafter ([waiting for lower-timeframe confirmation to form following the retest is advised] stop loss: dependent on where one confirms the area).
- Sells: Flat (stop loss: N/A).
AUD/USD:
Weekly gain/loss: – 127 pips
Weekly closing price: 0.7828
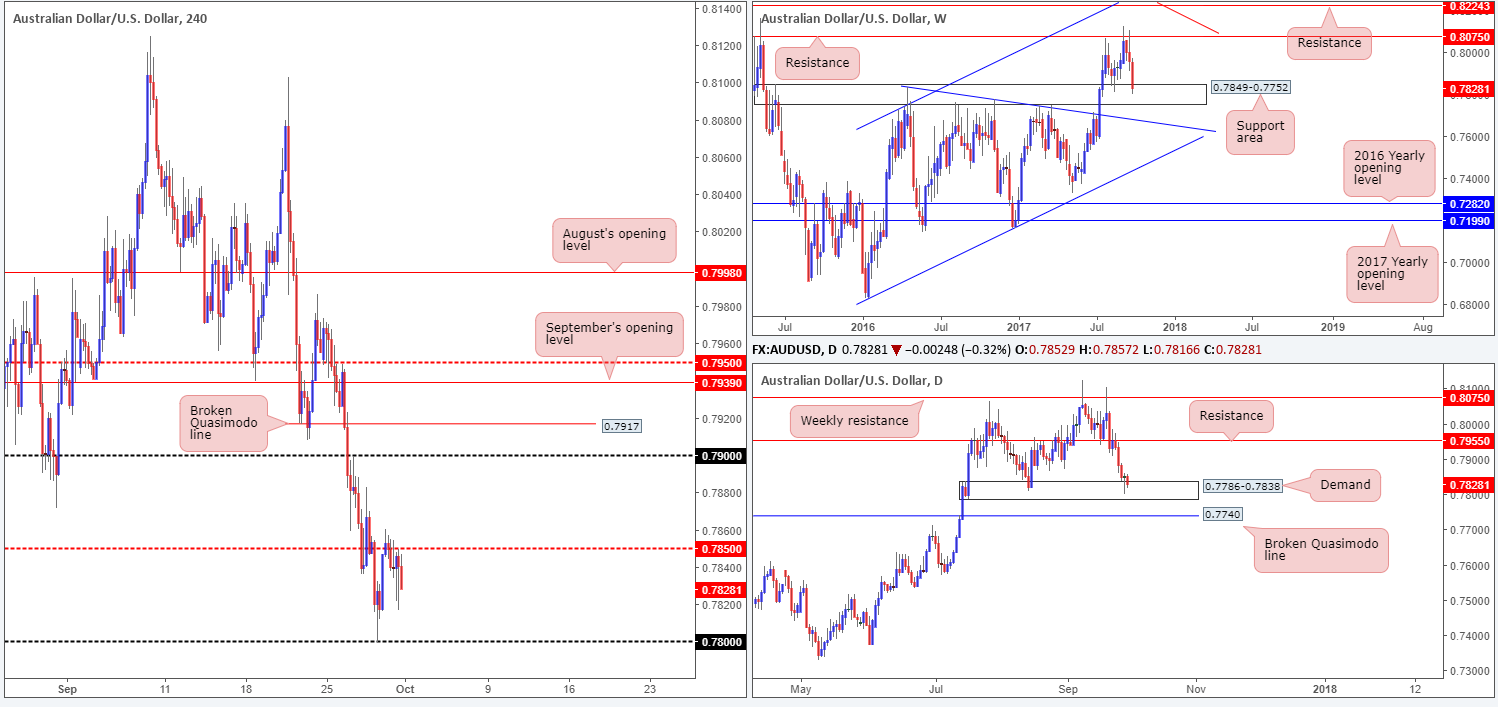
The Australian dollar, as you can see, continued to spiral south last week, resulting in weekly price aggressively piling into a support area penciled in at 0.7849-0.7752. This zone has a strong history and held well as support during the month of August, thus there’s a good chance that we may see history repeat itself here.
In support of the current weekly zone, a strong daily demand base logged at 0.7786-0.7838 is seen planted within its boundaries. While as of current price the market is bid from this daily barrier, traders might want to note that should this area give way, the next port of call will likely be a nearby broken daily Quasimodo line seen at 0.7740.
A brief look at recent dealings on the H4 timeframe shows the unit defended the mid-level resistance at 0.7850 on Friday, and concluded trade forming a near-full-bodied bearish candle. Given the two H4 buying tails printed before the closing candle (0.7821/0.7816), which appear to have consumed any demand residing around the 0.7827 mark, downside looks relatively free to the 0.78 handle.
Suggestions: In spite of the fact that both weekly and daily structures show potential buying may be on the cards, H4 action looks poised to retest 0.78. While H4 price may indeed drive lower in opening trade, there’s little evidence to suggest that price will exceed 0.78.
As stop-loss orders are still likely active beneath 0.78, a whipsaw through this number in the shape of a H4 buying tail (pin bar) would be attractive. Once/if this is seen, our team would look to become buyers on the candle close, targeting 0.7850 and 0.79, followed closely by the H4 broken Quasimodo line at 0.7917.
Data points to consider: US ISM Manufacturing PMI at 2.45pm, followed by FOMC member Kaplan speaking at 7pm GMT+1.
Levels to watch/live orders:
- Buys: 0.78 region ([watch for a H4 pin-bar candle to whipsaw through this number before pulling the trigger] stop loss: ideally beyond the pin bar’s tail).
- Sells: Flat (stop loss: N/A).
USD/JPY:
Weekly gain/loss: + 47 pips
Weekly closing price: 112.46
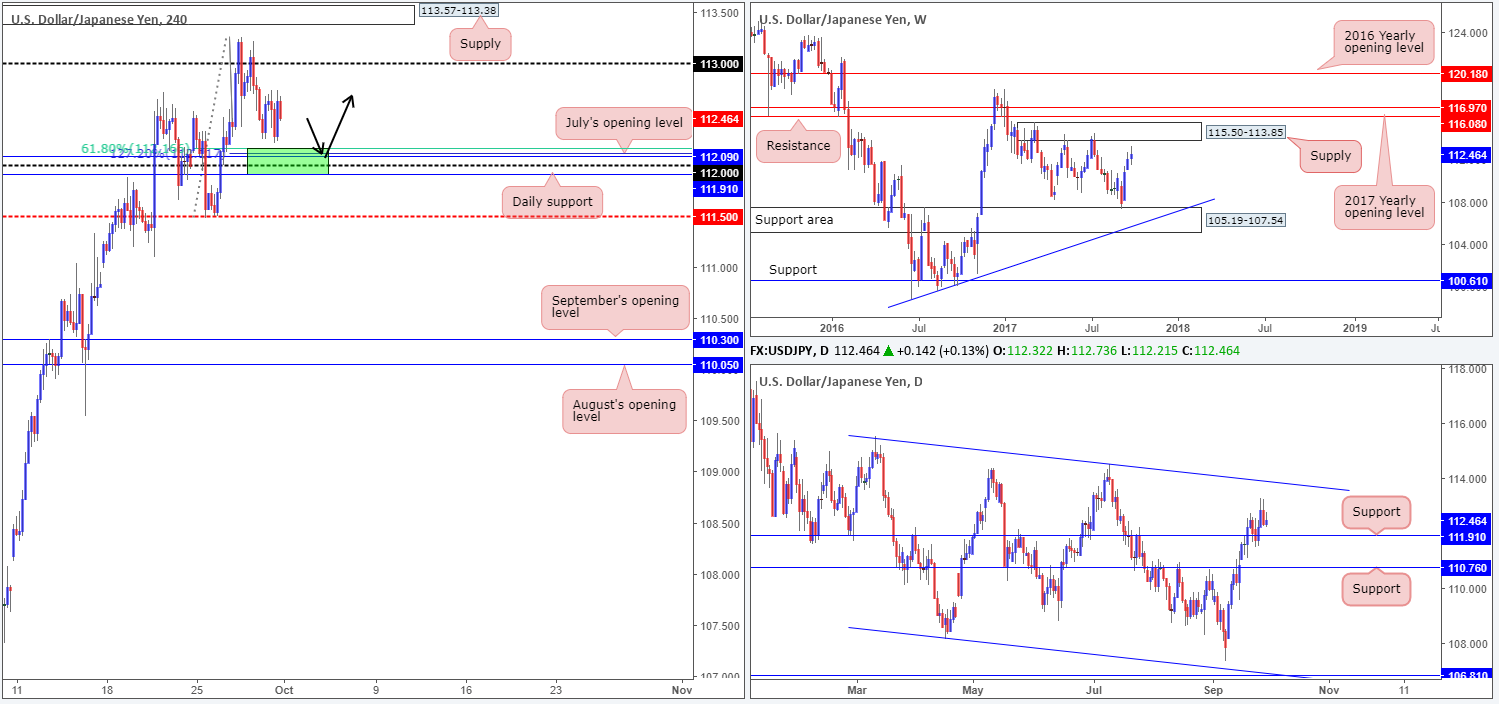
Over the course of last week’s segment, dollar bulls pushed to fresh highs of 113.25 and registered its third consecutive bullish close. As a result, the odds of price shaking hands with nearby supply at 115.50-113.85 are still high, in our humble opinion.
In conjunction with weekly flow, we can also see daily price respecting support at 111.91 and showing space for the unit to move north up to at least the trendline resistance extended from the high 115.50 (intersects with the aforementioned weekly supply zone).
Consequent to a rather lackluster performance on Friday, H4 price spent the day trading from local support found at 112.64. Despite this, the road to 112 remains in view and is still, as highlighted in Friday’s report, an incredibly appealing level at the moment. Here’s why:
- Positioned directly above daily support at 111.91.
- Located just below July’s opening level at 112.09.
- Nearby a 61.8% H4 Fib support at 112.16 taken from the low 111.47.
- Boasts a 127.2% H4 Fib ext. point at 112.12 extended from the high 113.25.
Suggestions: With space seen for both weekly and daily action to push higher, coupled with the 112 handle’s surrounding confluence mentioned above, a long from the green H4 buy zone is worthy of attention. As psychological levels are prone to fakeouts, however, the team has decided to wait for H4 price to confirm buyer intent before pulling the trigger. For us, this would simply be a full or near-full-bodied bullish candle formed within the green zone, which would, in our view, provide enough evidence to hold the position up to at least 113/H4 supply at 113.57-113.38.
Data points to consider: US ISM Manufacturing PMI at 2.45pm, followed by FOMC member Kaplan speaking at 7pm GMT+1.
Levels to watch/live orders:
- Buys: 111.91/112.16 ([waiting for a reasonably sized H4 bullish candle to form – preferably a full, or near-full-bodied candle – is advised] stop loss: ideally beyond the candle’s tail).
- Sells: Flat (stop loss: N/A).
USD/CAD:
Weekly gain/loss: + 135 pips
Weekly closing price: 1.2463
Trade update: sell stopped out at breakeven (1.2479).
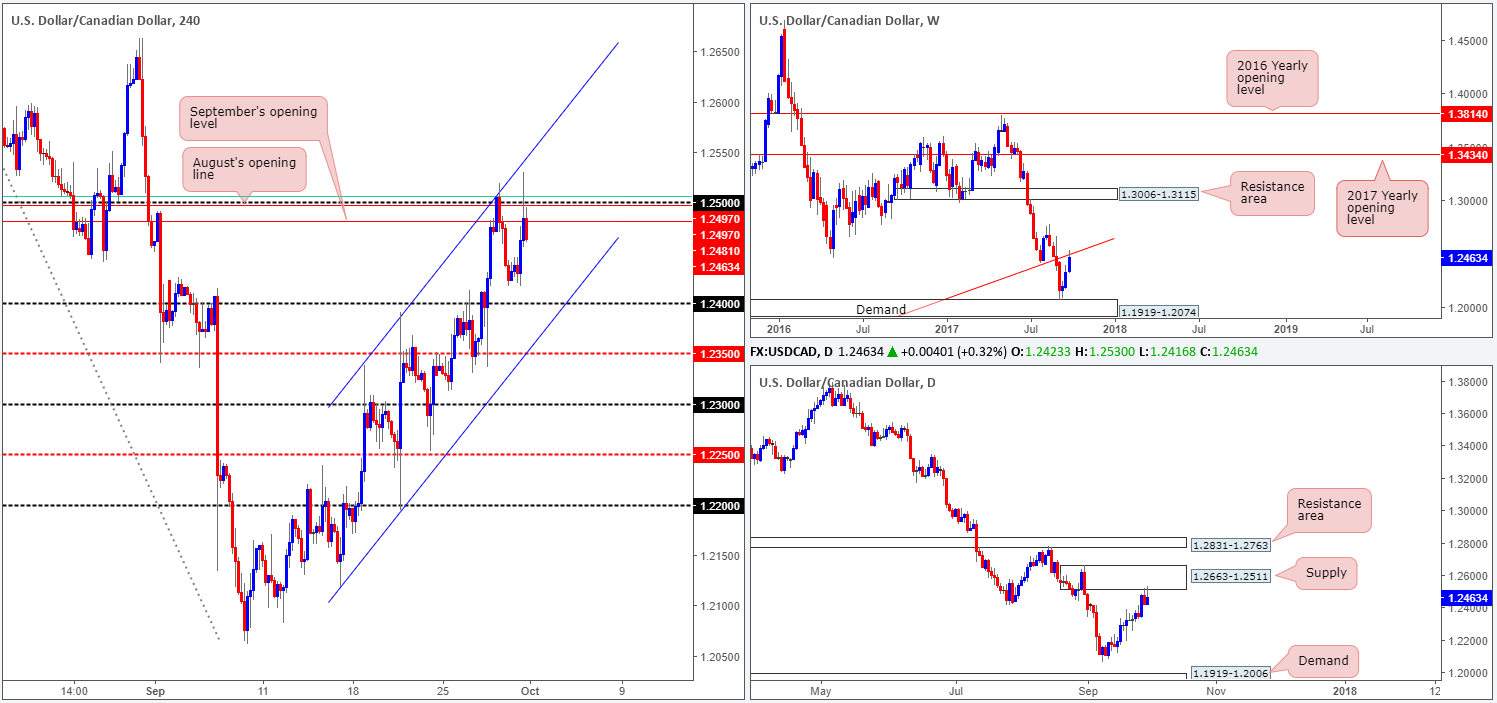
The USD/CAD enjoyed another relatively successful session last week, increasing its stock by a further 135 pips into the closing bell. Perhaps the most compelling factor here, however, is weekly price also crossed paths with a trendline resistance taken from the low 0.9633, and printed a minor end-of-week correction. Along similar lines, daily activity also collided into a strong-looking supply base at 1.2663-1.2511 on Thursday and chalked up two back-to-back selling wicks.
On Friday, we saw H4 bulls press forward following a lower-than-expected Canadian GDP print. This, as you can see, forced price to whipsaw through multiple H4 resistances, tap a fresh high of 1.2530, and eventually end the day closing lower in the shape of a near-full-bodied H4 bearish candle.
Suggestions: In view of the unit’s position on both the weekly and daily charts, along with the pair trading within a clear downtrend at the moment, we feel price is extremely overbought. In addition to this, we also have a confluent psychological resistance at 1.25 based on the H4 timeframe, which boasts September/August’s opening levels at 1.2497/1.2481 and a 61.8% H4 resistance (green line) taken from high 1.2778.
Given the collective confluence, this, from where we’re standing, is clearly a sellers’ market right now. Shorting at the open is certainly an option here, targeting the 1.24 neighborhood as an initial take-profit zone.
Data points to consider: US ISM Manufacturing PMI at 2.45pm, followed by FOMC member Kaplan speaking at 7pm GMT+1.
Levels to watch/live orders:
- Buys: Flat (stop loss: N/A).
- Sells: Sells at current price appear attractive (stop loss: aggressive – 1.2502/conservative: 1.2532).
USD/CHF:
Weekly gain/loss: – 16 pips
Weekly closing price: 0.9676
Despite the pair printing fresh highs of 0.9770 last week, price concluded the day trading marginally lower into the close. From a technical standpoint, this was likely due to weekly price bumping heads with a trendline resistance extended from the low 0.9257. What’s also interesting from this scale is the weekly USDX candles are currently testing supply noted at 12012-11907.
Alongside weekly flow, we can also see daily price trading from a resistance area pegged at 0.9770/0.9726, as well as USDX daily candles presently shaking hands with supply at 11969-11938. Should the dollar continue to depreciate in value, the next downside target can be seen at demand coming in at 0.9565-0.9611, followed closely by support at 0.9546.
Across on the H4 chart, Friday’s movement shows that price finally conquered the 0.97 handle and went on to confront August’s opening level at 0.9672. Though both the weekly and daily timeframes signal further selling could be on the cards, a sell on the H4 timeframe is somewhat tricky. Not only do we have to contend with potential buying from the current monthly opening level, there’s also the nearby support area seen pegged below at 0.9647-0.9633 (converges with trendline support taken from the low 0.9565).
Suggestions: Owing to the current supports on the H4 timeframe, we’ve decided to pass on selling this market today. It’s just far too restricted for our liking!
Data points to consider: US ISM Manufacturing PMI at 2.45pm, followed by FOMC member Kaplan speaking at 7pm GMT+1.

Levels to watch/live orders:
- Buys: Flat (stop loss: N/A).
- Sells: Flat (stop loss: N/A).
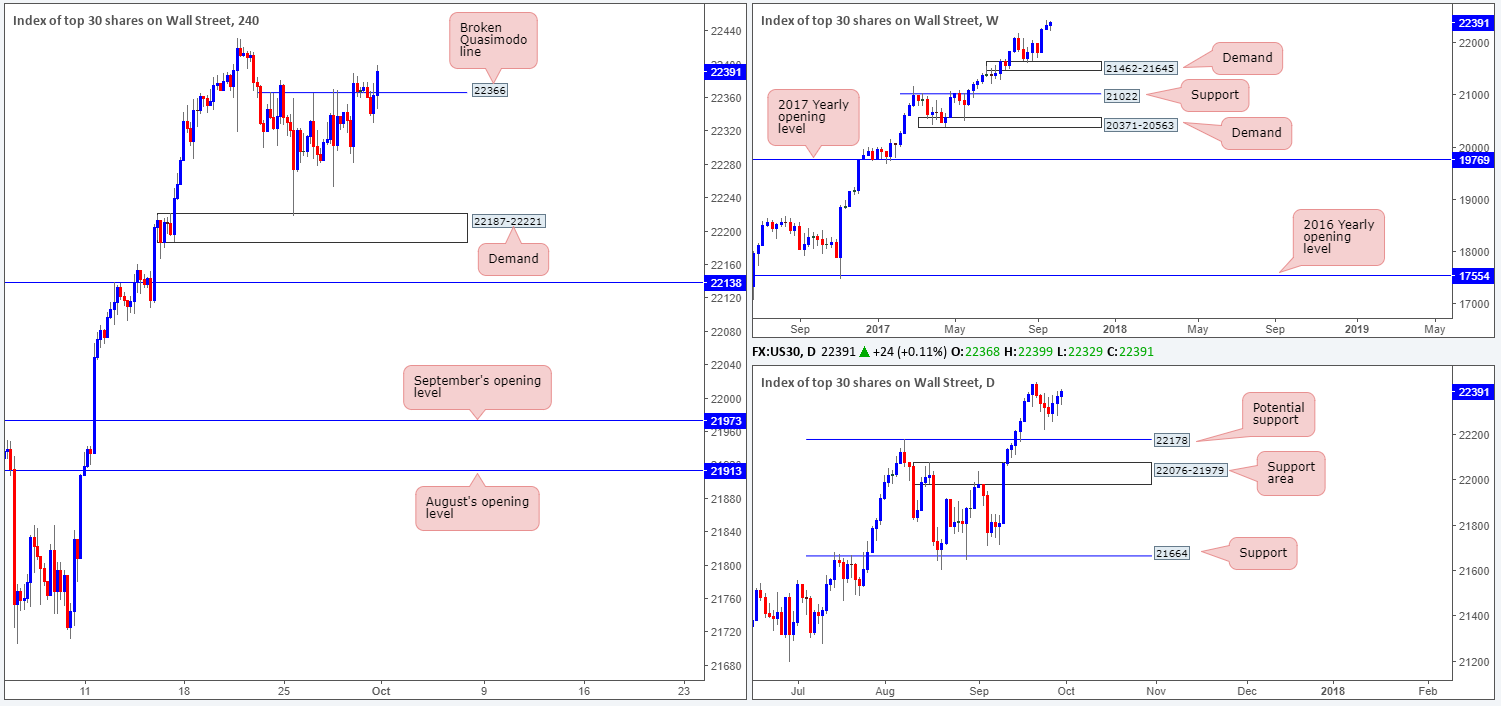
DOW 30:
Weekly gain/loss: + 53 points
Weekly closing price: 22391
US equities closed higher for a third consecutive week in recent trade, forming a nice-looking weekly buying tail in the process. With the index now trading at fresh record highs of 22450, the team is looking to join the current uptrend.
Given price is firmly trading above the H4 Quasimodo resistance level at 22366, this line could be a fantastic barrier to consider buying from should the market dip lower.
Suggestions: To trade long from the current H4 level though, we’ve agreed that waiting for a reasonably strong H4 bull candle to take shape in the form of a full or near-full-bodied candle would be the better path to take. This is to simply avoid any fakeout that may take place. Should a trade come to fruition from this angle, a break to fresh record highs would be our cue to reduce risk to breakeven and look for fresh support to form.
Data points to consider: US ISM Manufacturing PMI at 2.45pm, followed by FOMC member Kaplan speaking at 7pm GMT+1.
Levels to watch/live orders:
- Buys: 22366 ([waiting for a H4 bullish rotation candle to form is advised] stop loss: ideally beyond the candle’s tail).
- Sells: Flat (stop loss: N/A).
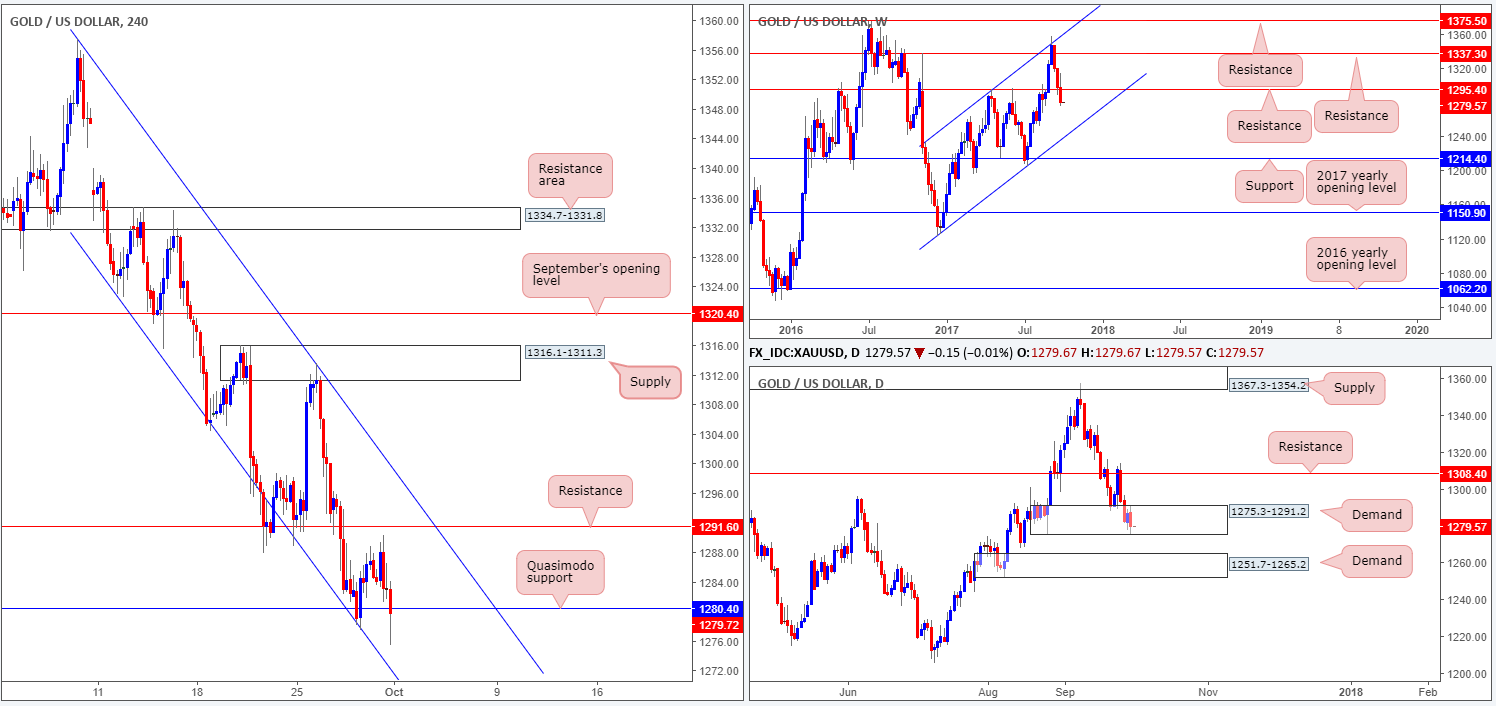
GOLD:
Weekly gain/loss: – $17.4
Weekly closing price: 1279.7
As can be seen from the weekly timeframe, the yellow metal has suffered a string of consecutive losses after connecting with resistance coming in at 1337.3. A continued move to the downside from here would likely bring gold into contact with a channel support extended from the low 1122.8.
Sliding down to the daily timeframe, we can see price ended the week forming a bearish engulfing candle within the walls of a demand base at 1275.3-1291.2. In the event that this encourages further selling, the piece will likely trickle south down to demand registered at 1251.7-1265.2.
Leaving the H4 resistance at 1291.6 unchallenged on Friday, H4 price ended the day marginally closing beneath a Quasimodo support level at 1280.4. This could, in our opinion, spark further selling in early trading, bringing price down to as far as August’s opening level at 1269.3 (not seen on the screen), which happens to converge with a channel support taken from the low 1323.0.
Suggestions: Taking all of the above into consideration, we feel price is heading lower today. Watch for H4 price to print an additional close lower and then look to trade any retest seen at the underside of the aforesaid H4 Quasimodo support. Should a H4 bearish candle take shape following the retest in the form of a full or near-full-bodied candle, a short down to August’s opening level at 1269.3, followed closely by the top edge of daily demand mentioned above at 1251.7-1265.2, is an option.
Levels to watch/live orders:
- Buys: Flat (stop loss: N/A).
- Sells: Watch for H4 price to engulf the Quasimodo support at 1280.4 and then look to trade any retest seen thereafter ([waiting for a H4 bearish candle to form following the retest is advised] stop loss: ideally beyond the candle’s wick).


