
EUR/USD:
Weekly Gain/Loss: -0.68%
Weekly Close: 1.1335
Weekly perspective:
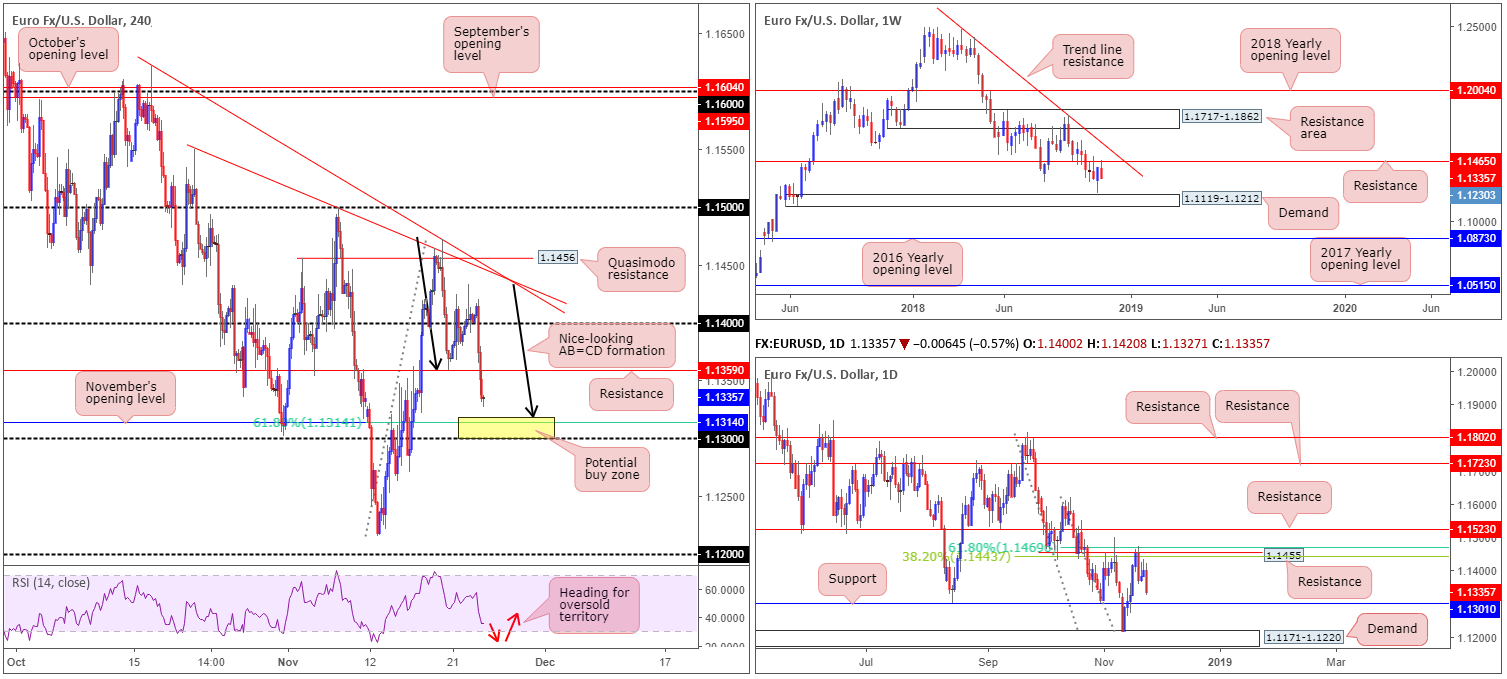
Bearish headwinds continued to loom large over the single currency last week, despite an impressive rebound just north of demand plotted at 1.1119-1.1212 the week prior. A resurgence in USD bidding – along with price action subsiding from long-term resistance at 1.1465 (history dating as far back as early 2015) – could give rise to further selling this week, targeting the aforementioned demand.
Daily perspective:
Closer analysis on the daily timeframe adds strong resistance drawn from 1.1455, which happens to merge closely with two daily Fibonacci resistances: 38.2%/61.8% at 1.1443 and 1.1469, respectively. The selloff from this barrier last week indicates a test of nearby support at 1.1301 may be in store this week, followed by a potential run towards demand seen from 1.1171-1.1220. Note this demand base is glued to the top edge of the weekly demand area highlighted above at 1.1119-1.1212.
H4 perspective:
Friday’s action witnessed the EUR/USD print a wave of dominant bearish candles, down 0.57% on the day. Influenced by November’s IHS Markit PMI surveys presenting a softening bloc, the H4 candles reclaimed 1.14 to the downside and now appear poised to challenge November’s opening level at 1.1314. This level – coupled with a 61.8% Fibonacci support, an AB=CD (black arrows) symmetrical completion point just north at 1.1318, the 1.13 psychological barrier found below, the RSI indicating its heading for oversold territory and daily support mentioned above at 1.1301 – offers a high-probability reversal zone this week, according to our technical studies. The only grumble, of course, is we know weekly price is fading resistance.
Areas of consideration:
The yellow H4 zone marked between 1.13/1.1318 is, as highlighted above, an area of interest for potential longs today/early week.
Aggressive traders might look to enter around the 1.1314ish neighbourhood with stop-loss orders tucked a couple of pips beyond 1.13. Conservative traders, on the other hand, may opt to wait and see how price action behaves before pulling the trigger. A bullish candlestick formation on either the H4/H1 would not only help confirm buyer intent (and help avoid the possibility of being whipsawed out of a trade on a fakeout through 1.13), it’d also provide entry/stop parameters.
As for take-profit targets out of 1.13/1.1318, H4 resistance at 1.1359 appears a logical starting point, followed by the 1.14 level.
Today’s data points: German IFO Business Climate; ECB President Draghi Speaks.
GBP/USD:
Weekly Gain/Loss: -0.28%
Weekly Close: 1.2807
Weekly perspective:
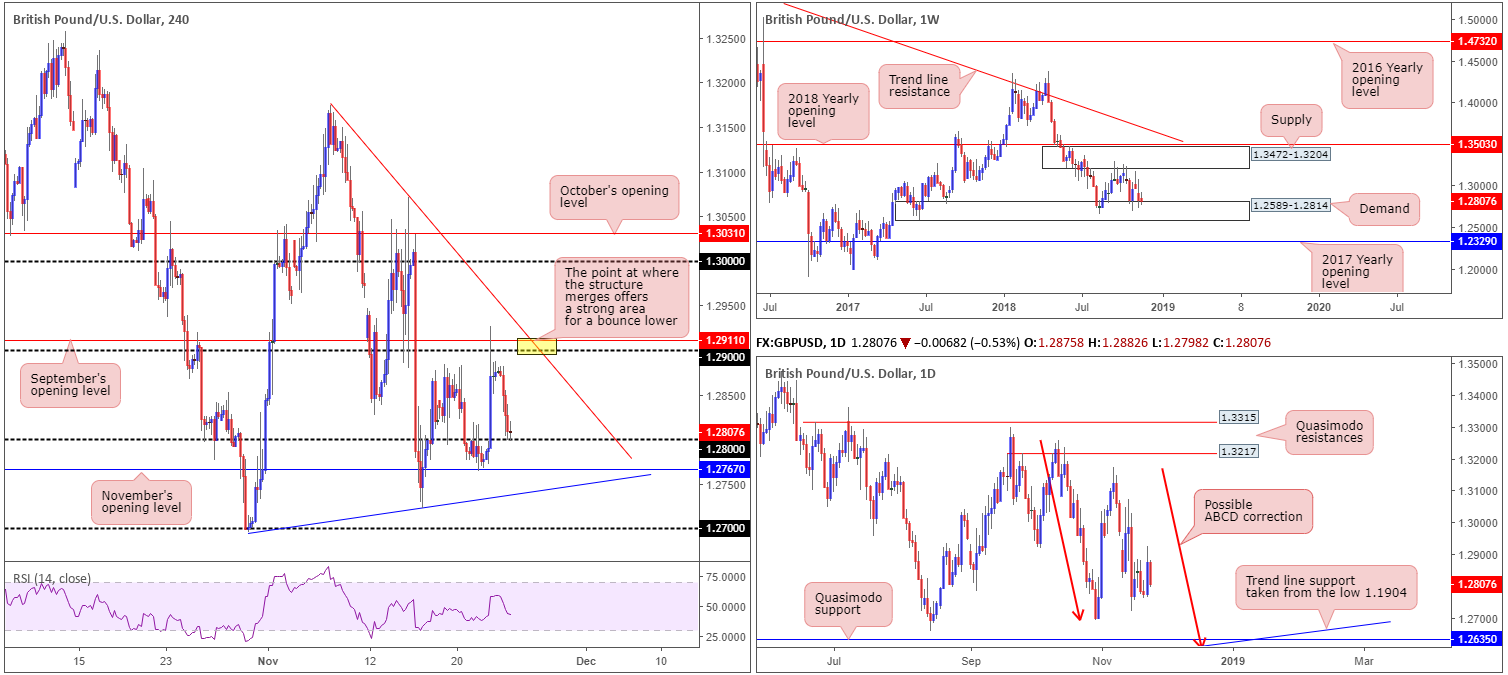
Despite UK politics pilfering headlines on a daily basis, the longer-term picture shows the GBP/USD remains restricted between demand at 1.2589-1.2814 and a supply drawn from 1.3472-1.3204 – price is currently testing the lower edge of this range. Outside of this border, notable areas fall in at the 2018/2017 yearly opening levels drawn from 1.3503 and 1.2329, respectively.
Daily perspective:
Price action on the daily timeframe, however, suggests the pair might want to explore lower ground within the walls of the said weekly demand area. The candles, as you can see, spent the week hovering north of the 1.2695 Oct 30 low. While a response from this neighbourhood is possible, the Quasimodo support seen at 1.2635 is a far more appealing level.
Aside from 1.2635 fusing with trend line support (taken from the low 1.1904), the approach, should we push for lower levels, will form by way of an ABCD bullish pattern (red arrows) terminating just south at 1.2614.
H4 perspective:
Following Thursday’s sharp run to highs of 1.2926 amid the UK and the EU agreeing a draft text setting, Friday witnessed a sharp change in mood going into London hours, reclaiming a large portion of recent gains. The British pound surrendered ground to its US counterpart after the former Brexit secretary Dominic Raab conceded Theresa May’s Brexit deal would be even worse than staying in the EU. Gibraltar also remained a key sticking point of the day.
1.28, as is evident from the chart, entered the fray in early US trade and held ground in the shape of a tight trading range into the close. Continued rejection off 1.28 today/early week could lead to a move being seen back up to 1.29, which brings with it a trend line resistance (etched from the high 1.3174) and September’s opening level at 1.2911. A violation of 1.28, however, has November’s opening level at 1.2767 to target, trailed closely by trend line support (taken from the low 1.2695).
Areas of consideration:
With UK political tension at all-time highs, as well as conflicting technical signals observed from the weekly and daily timeframes, this is a tricky market to trade.
Putting the bigger picture to one side, nevertheless, an intraday sell zone worthy of a possible bounce is 1.29 this week, particularly at the point where the round number merges with the noted trend line resistance (yellow). Apart from this, the research team feels that neither a long nor short is attractive at this time.
Today’s data points: BoE Gov. Carney Speaks.
AUD/USD:
Weekly Gain/Loss: -1.07%
Weekly Close: 0.7230
Weekly perspective:
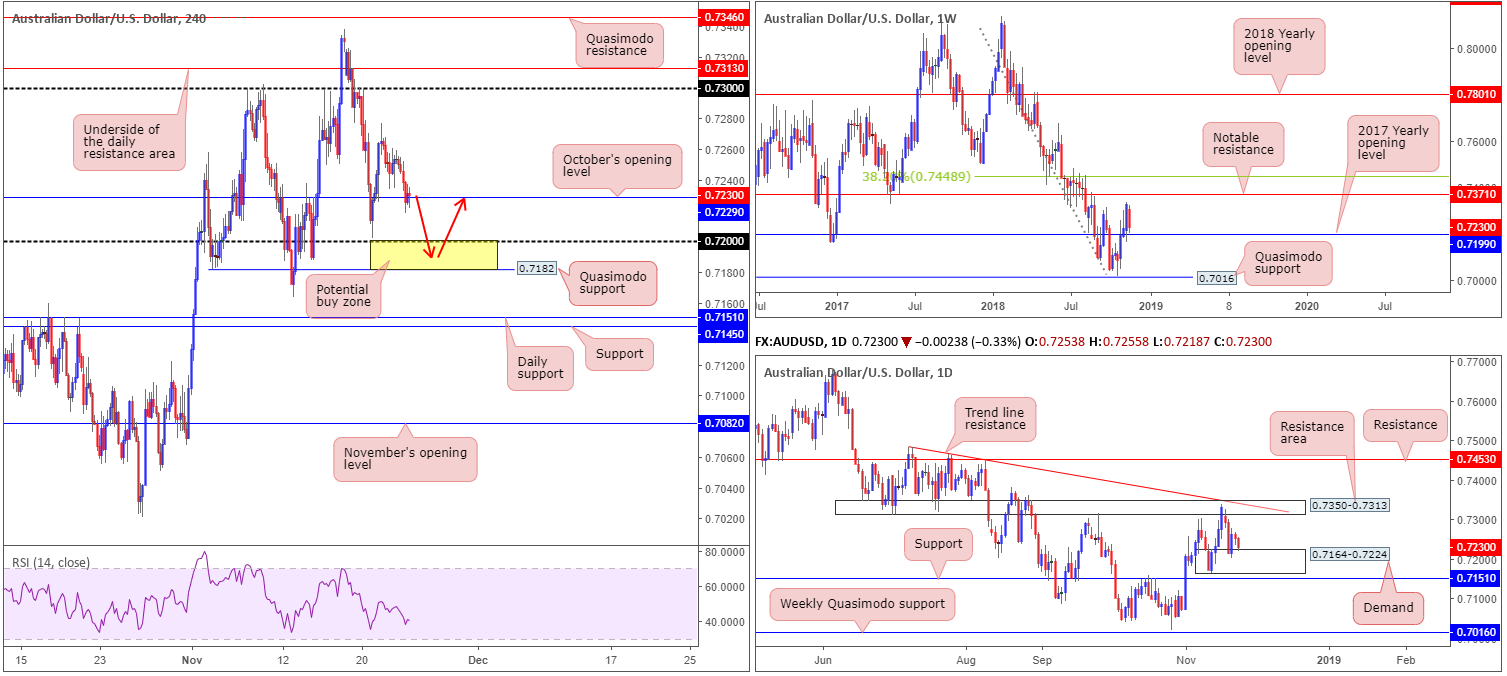
Healthy USD buying, along with a selloff observed in US stocks, weighed on the Australian dollar last week. Retreating from peaks of 0.7338 and breaking a three-week bullish phase, the AUD/USD concluded the week closing just north of its 2017 yearly opening level at 0.7199. Should buyers defend this base, notable resistance rests overhead at 0.7371. This resistance has served as a critical level in this market for a number of years, and, therefore, commands attention.
Daily perspective:
Following a somewhat dominant selloff from a resistance zone drawn from 0.7350-0.7313 (merges closely with a trend line resistance [taken from the high 0.7483]) in the early stages of last week, mid-week trade witnessed demand surface around 0.7164-0.7224. Although the 2017 yearly opening level mentioned above on the weekly timeframe is seen housed within this base, traders may also want to acknowledge the possibility of a fakeout materializing to nearby support at 0.7151 this week. One can only imagine how many stop-loss orders will be triggered as a result of this move!
H4 perspective:
A combination of lower commodity prices, waning US equity markets and a robust US dollar positioned the H4 candles under pressure Friday. October’s opening level at 0.7230 is currently displaying signs of weakness, possibly unlocking the gates for a test of 0.72 this week.
The area shaded in yellow between 0.72 and a Quasimodo support level at 0.7182 is of interest for prospective longs this week. Besides forming within the confines of daily demand at 0.7164-0.7224, 0.72 also represents the 2017 yearly opening level on the weekly timeframe.
Areas of consideration:
A long from 0.7182/0.72 will likely have traders enter around 0.72, with stop-loss orders sited a couple of pips beyond the current daily demand. However, entering as low as possible within the buy zone is recommended, as this will increase risk/reward parameters towards the first area of concern: October’s opening level at 0.7230. Ideally, you’ll want to achieve at least a 1:1 risk/reward ratio.
Today’s data points: RBA Assist Gov. Kent Speaks.
USD/JPY:
Weekly Gain/Loss: +0.15%
Weekly Close: 112.95
Weekly perspective:
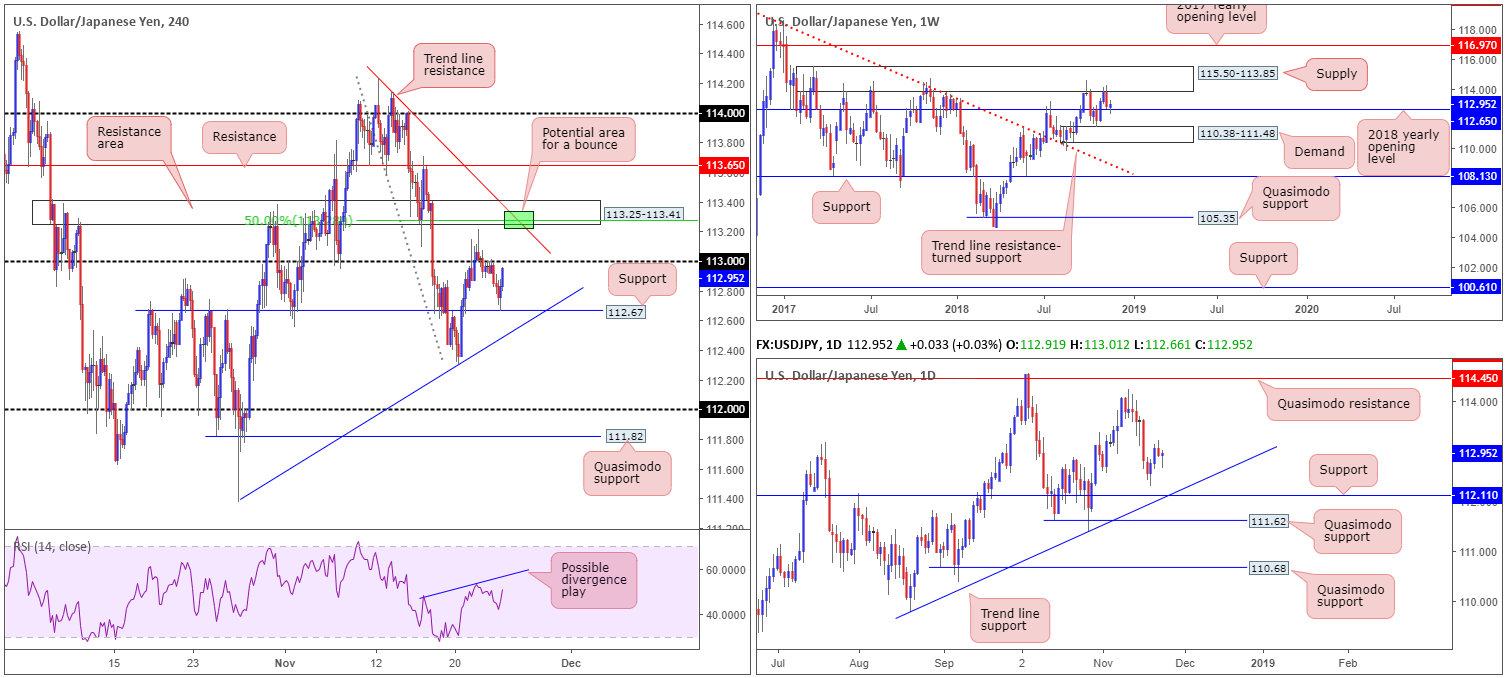
In spite of a prominent bearish engulfing candle recently forming from the underside of a major supply zone at 115.50-113.85, candle action failed to overthrow its 2018 yearly opening level at 112.65 last week. Beyond this level, traders likely have their crosshairs fixed on demand coming in at 110.38-111.48, whereas a break above the current supply has the 2017 yearly opening level to target at 116.97.
Daily perspective:
In terms of daily structure, areas worth keeping an eyeball on this week fall in at a trend line support (extended from the low 109.77), which merges closely with support drawn from 112.11. To the upside, the 114.23 Nov 12 high is likely next in line, shadowed closely by Quasimodo resistance priced in at 114.45.
H4 perspective:
A quick recap of Friday’s movement on the H4 timeframe reveals support at 112.67 (essentially the same level as the 2018 yearly opening level at 112.65 on the weekly timeframe) entered the fight amid early US hours. Bolstered by a well-bid USD across the board, the H4 candles ended the day closing within striking distance of 113.
The majority of intraday players will likely have 113 in mind for possible shorting opportunities today, though with an attractive area of resistance plotted just overhead at 113.25-113.41, the research team believe a break of 113 may be in store. Converging nicely with a trend line resistance (etched from the high 114.23) and a 50.0% resistance value at 113.28 (green), as well as the RSI indicator offering a possible divergence play, the 113.25-113.41 area broadcasts strength.
Areas of consideration:
A short from 113.25 today/early week, with stop-loss orders positioned two pips above 113.41 equates to an 18-pip stop. Assuming traders target 113 as the initial area of concern, this provides a 1:1:4 risk/reward ratio. Traders are advised to reduce risk to breakeven once 113 enters view, and maybe even liquidate a portion of the position. Beyond 113, the team has the 112.67 H4 support as the next downside target.
Today’s data points: Limited.
USD/CAD:
Weekly Gain/Loss: +0.61%
Weekly Close: 1.3233
Weekly perspective:
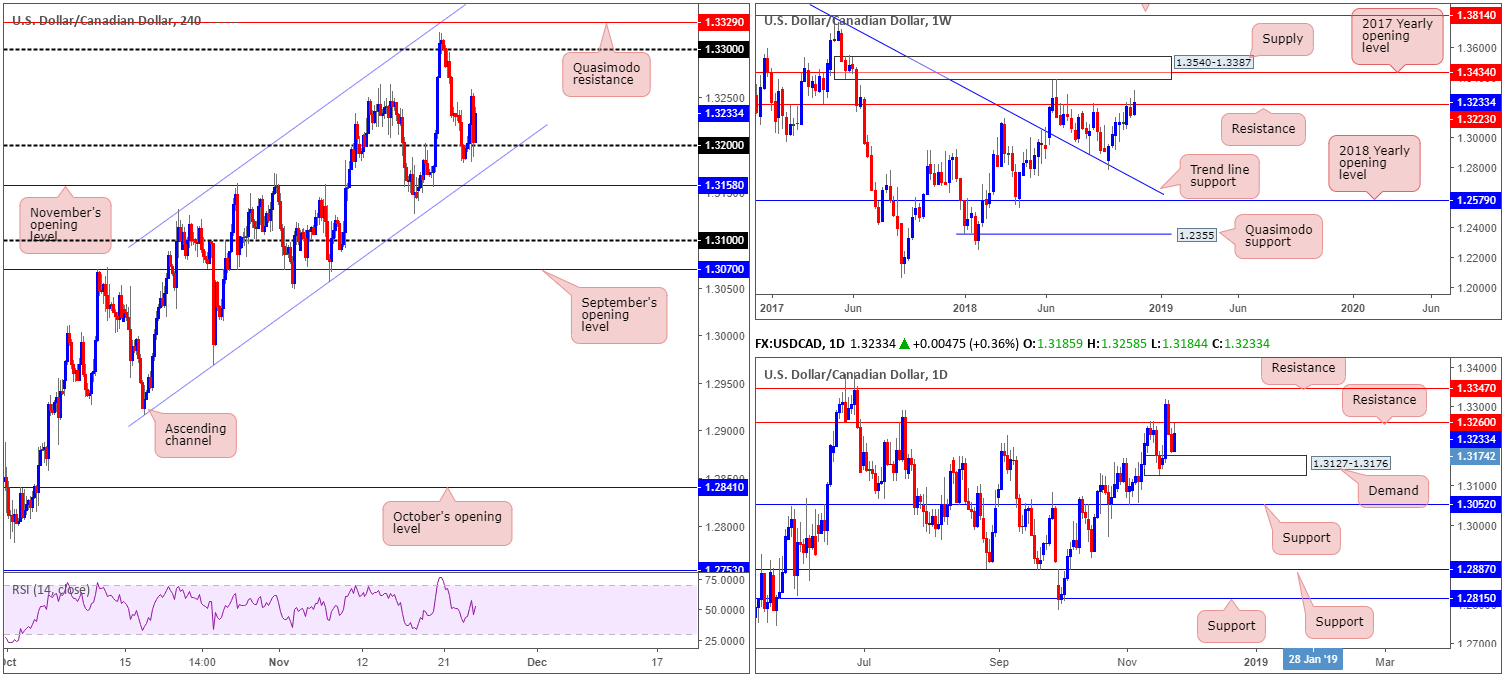
Swelling to highs of 1.3318 last week, the USD/CAD managed to settle marginally above resistance priced in at 1.3223. Continued buying from here could lead to a test of nearby supply at 1.3540-1.3387 (houses the 2017 yearly opening level within at 1.3434). With respect to levels plotted below the current resistance, however, limited support is visible until the 1.2782 Oct 1 low, followed closely by trend line resistance-turned support (etched from the high 1.4689).
Daily perspective:
Adding daily structure to the mix, resistance at 1.3260 moved into view Friday after price action bottomed just ahead of demand coming in at 1.3127-1.3176 during Thursday’s segment. As is evident from the chart, structure is somewhat restricted at the moment. A violation of the current resistance level brings in nearby resistance at 1.3347, whereas a break through the said demand has neighbouring support at 1.3052 in view.
H4 perspective:
Friday’s hotter-than-expected Canadian inflation and retail sales figures witnessed the USD/CAD immediately spike to lows of 1.3182. Though with crude oil prices plummeting (down 6.43% on the day) this weighed heavily on the Canadian dollar, helping the pair find support off 1.32.
Ultimately, the H4 candles remain compressing within an ascending channel formation (1.2916/1.3132). Although daily resistance is in play at 1.3260, as well as weekly resistance at 1.3223, H4 structure reveals limited resistance in view until reaching 1.33. Beyond 1.32, nonetheless, traders may also want to pencil in November’s opening level at 1.3158 and the closely converging channel support.
Areas of consideration:
With weekly and daily resistance levels in view, buying from 1.32 on the H4 scale is challenging. Having said that, though, selling would also entail confronting possible support off 1.32, and also the nearby H4 support structures plotted just beneath it (see above), along with possible daily buying from demand at 1.3127-1.3176. For that reason, as of current price, neither a long nor short seems attractive.
Today’s data points: Limited.
USD/CHF:
Weekly Gain/Loss: -0.31%
Weekly Close: 0.9968
Weekly perspective:
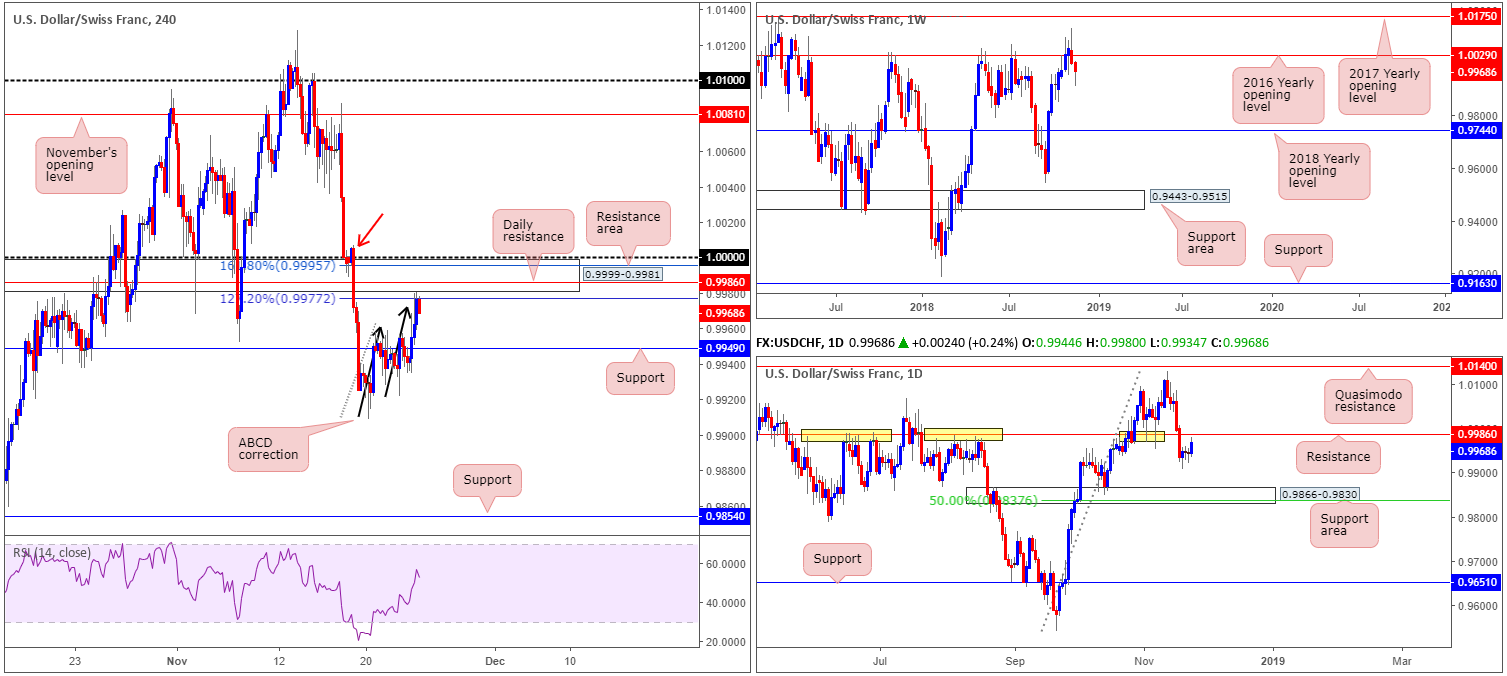
The USD/CHF extended losses over the course of last week’s trading, firmly positioning price action beneath its 2016 yearly opening level at 1.0029. Providing sellers remain in the driving seat, the next support target does not come into view until the 2018 yearly opening level at 0.9744.
Daily perspective:
In conjunction with our weekly assessment, daily structure reveals price action ended the week closing within close proximity of resistance at 0.9986. The level, as you can see (yellow), boasts incredibly strong historical significance, and, therefore, will likely hold firm if tested this week. Downside from this angle seems reasonably free until a support area seen at 0.9866-0.9830 enters the fold.
H4 perspective:
Resurgent USD buying hit markets across the board Friday, pulling the H4 candles beyond resistance at 0.9949 (now acting support) towards an interesting area of resistance at 0.9999-0.9981. It may also interest some traders to note Friday’s move formed in the shape of an ABCD bearish pattern (black arrows), terminating just south of the noted resistance area at 0.9977 (127.2% Fibonacci ext. point).
While there are likely some traders already short the market from the resistance zone, there is an additional area of consideration seen overhead. The daily resistance seen plotted within the aforementioned H4 resistance area at 0.9986, along with a 161.8% Fibonacci ext. point at 0.9995 and 1.0000 (parity) marks an attractive area for sellers today/early week.
Areas of consideration:
Should the unit continue to press for lower ground from current price, traders are urged to consider reducing risk to breakeven/liquidating partial profits at H4 support drawn from 0.9949.
For those who missed the initial short, as highlighted above, the pair still may explore higher ground and offer a lucrative region to sell from: 1.0000/0.9986. A short from here with stop-loss orders positioned above H4 supply marked with a red arrow at 1.0007-0.9988 is, according to the overall market picture, a high-probability selling opportunity.
Today’s data points: Limited.
Dow Jones Industrial Average:
Weekly Gain/Loss: -4.67%
Weekly Close: 24246
Weekly perspective:
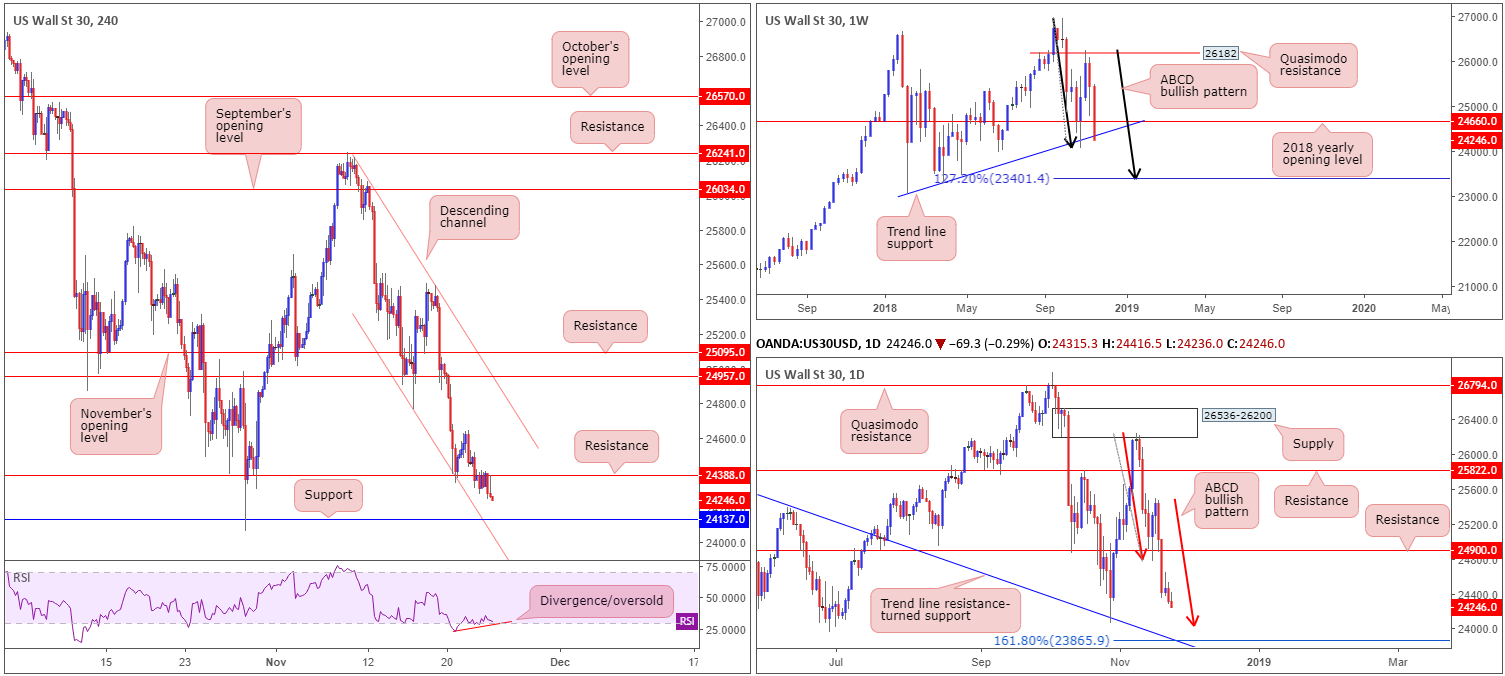
By way of a near full-bodied bearish candle, US equities fell sharply last week, erasing in excess of 1000 points. The move engulfed its 2018 yearly opening level at 24660, and also marginally closed beyond a nearby trend line support (extended from the low 23055). Further selling in this market could give rise to an ABCD (black arrows) 127.2% bullish pattern completing at 23401.
Daily perspective:
Just north of the weekly ABCD bullish termination point, however, is another potential ABCD (red arrows) 161.8% bullish completion zone at 23865. Note this daily configuration merges beautifully with a trend line resistance-turned support (extended from the high 26670). Therefore, this daily level, along with the weekly equivalent, are certainly levels worthy of watching this week.
H4 perspective:
In terms of where we’re positioned on the H4 scale, price remains compressing within a descending channel formation (26217/24769). Thanks to Friday’s push lower, support at 24137 is now likely on the radar for many today, as it fuses closely with channel support. It might also be worth noting the RSI indicator is currently displaying a divergence/oversold reading.
Areas of consideration:
A long off H4 support at 24137 could be something to consider today/early week. However, the research team strongly recommends waiting for additional candlestick confirmation before pulling the trigger (entry/stop parameters can be defined according to this configuration). This is simply because both weekly and daily timeframes suggest further selling could be in store. As for an upside target from 24137, H4 resistance at 24388 appears a logical first step.
In the event we overthrow 24137, the daily ABCD completion point at 23865 is the next level on the hit list, according to our higher-timeframe reading.
Today’s data points: Limited.
XAU/USD (Gold):
Weekly Gain/Loss: +0.17%
Weekly Close: 1222.8
Weekly perspective:
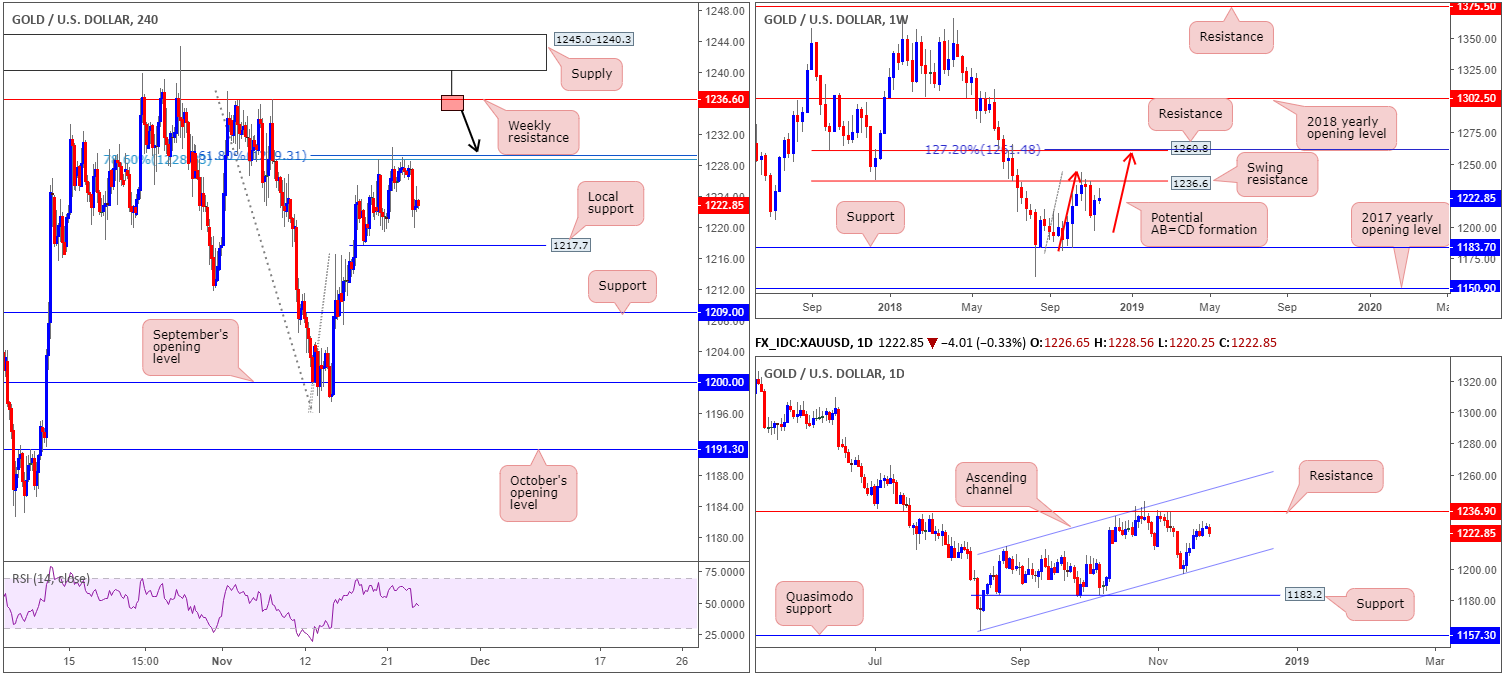
Although the price of gold ranged in excess of $12 last week, the unit settled relatively unchanged. Swing resistance priced in at 1236.6 remains a point of interest on this scale, having seen the barrier hold price action lower in October. Another key point worth noting is the potential for an AB=CD (red arrows) 127.2% bearish formation to complete just north of another layer of resistance (1260.8) at 1261.4.
Daily perspective:
Looking at this market in more detail, we can see the yellow metal is currently compressing within an ascending channel formation (1160.3/1214.3), with the candles possibly working their way towards a test of resistance at 1236.9 (essentially representing the weekly swing resistance mentioned above at 1236.6).
H4 perspective:
A brief look at recent dealings on the H4 timeframe shows price spiraled south Friday from the underside of a 78.6% Fib resistance at 1228.7/161.8% Fib ext. point at 1229.3. Should 1217.7 (the last remaining point of local support visible on this timeframe) be taken out, we see little in the way of support until price shakes hands with 1209.0.
Areas of consideration:
Whether additional selling will take place today/this week remains difficult to judge. We say this simply because both weekly and daily timeframes exhibit room to track higher ground. 1217.7 is key, in our view.
- A H4 close beneath 1217.7 that’s followed up with a retest in the shape of a bearish candlestick configuration (entry/stop parameters can be defined according to this configuration) would, likely be enough to prompt a selloff towards H4 support mentioned above at 1209.0.
- Weekly swing resistance mentioned above at 1236.6 is of interest this week. With H4 supply at 1245.0-1240.3 positioned just north of this weekly line, traders should prepare for the possibility of a fakeout play. Therefore, in the event a H4 bearish pin-bar formation take shape that pierces through the weekly resistance and tests the H4 supply (see H4 chart for a visual), this would be considered a high-probability shorting opportunity (stop-loss orders can be positioned either beyond the noted H4 supply or a few pips above the pin-bar’s wick).
The use of the site is agreement that the site is for informational and educational purposes only and does not constitute advice in any form in the furtherance of any trade or trading decisions.
The accuracy, completeness and timeliness of the information contained on this site cannot be guaranteed. IC Markets does not warranty, guarantee or make any representations, or assume any liability with regard to financial results based on the use of the information in the site.
News, views, opinions, recommendations and other information obtained from sources outside of www.icmarkets.com.au, used in this site are believed to be reliable, but we cannot guarantee their accuracy or completeness. All such information is subject to change at any time without notice. IC Markets assumes no responsibility for the content of any linked site. The fact that such links may exist does not indicate approval or endorsement of any material contained on any linked site.
IC Markets is not liable for any harm caused by the transmission, through accessing the services or information on this site, of a computer virus, or other computer code or programming device that might be used to access, delete, damage, disable, disrupt or otherwise impede in any manner, the operation of the site or of any user’s software, hardware, data or property.


