
EUR/USD:
Weekly gain/loss: +0.30%
Weekly closing price: 1.2214
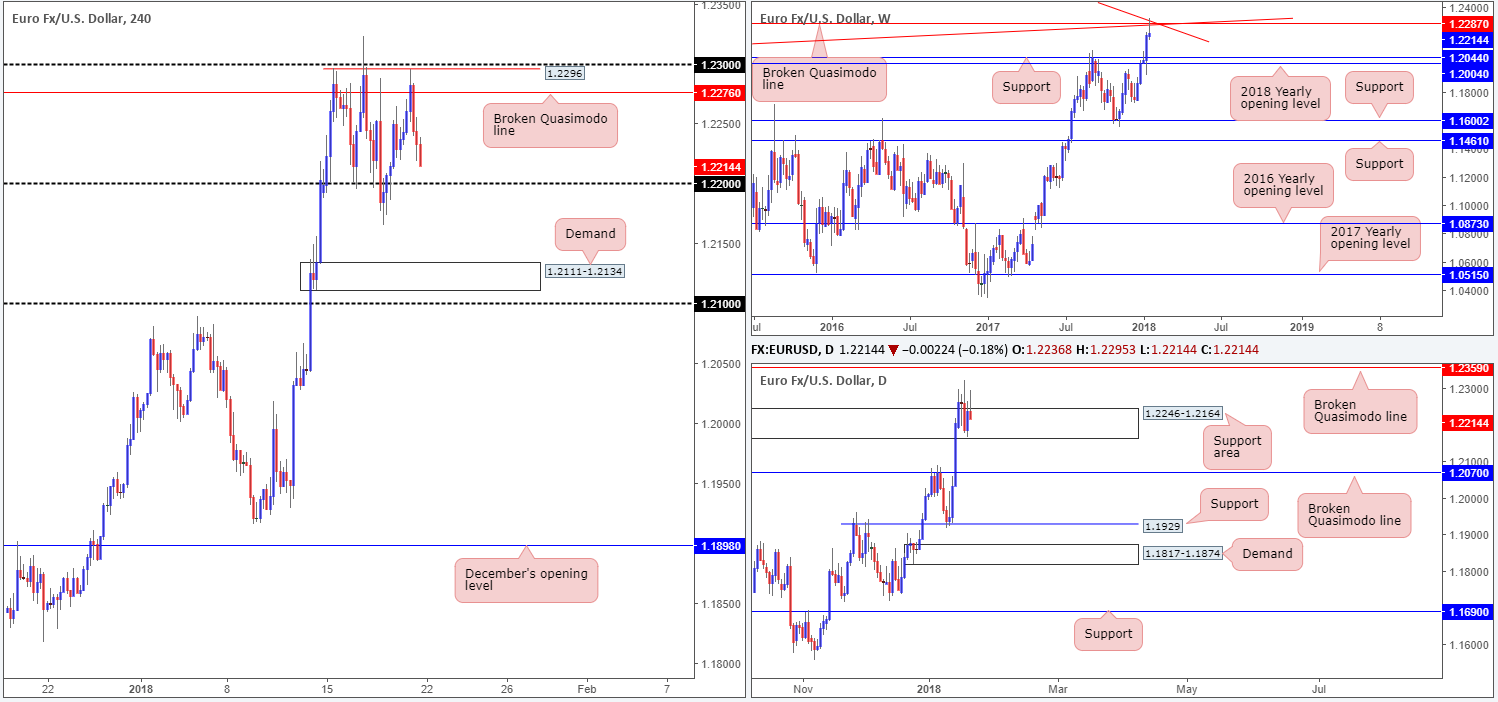
Although the shared currency printed a fifth consecutive weekly gain last week, weekly price failed to muster enough strength to overcome a weekly broken Quasimodo line at 1.2287 that merges with two weekly trendline resistances (1.1641/1.6038). This formed a strong-looking weekly selling wick, potentially motivating candlestick traders. Should this encourage further selling this week, keep an eyeball on weekly support seen at 1.2044 and the 2018 yearly opening level drawn from 1.2004.
Daily action, on other hand, spent the week consolidating within the walls of a daily support area at 1.2246-1.2164. This is quite a notable area from a technical perspective. A violation of this zone this week may unlock downside to as far south as a daily broken Quasimodo line at 1.2070 – positioned a few pips above the noted weekly support targets. A move higher, nevertheless, has the daily broken Quasimodo line penciled in from 1.2359 to target.
A brief look at Friday’s movement on the H4 timeframe shows that the candles whipsawed through a H4 broken Quasimodo line at 1.2276 amid the London open and challenged a H4 Quasimodo resistance at 1.2296. Strong selling from this line was instant! Lower-than-expected UoM consumer sentiment was largely ignored, consequently positioning the euro a few pips ahead of the 1.22 handle going into the closing bell.
Market direction:
Weekly price indicates a potential selloff given last week’s reaction, while daily price would need to overcome the current daily support area to achieve this. Friday’s daily selling wick, coupled with the position of weekly price, is likely going to weigh on the euro today/early this week, we believe.
A decisive H4 close beyond the 1.22 neighborhood could serve as a prospective sell signal. A retest to the underside of 1.22, followed up with a full or near-full-bodied H4 bearish candle would, in our opinion, offer a strong selling environment, targeting H4 demand at 1.2111-1.2134/1.21 handle as initial take-profit targets. The reason for requiring additional candle confirmation is simply due to the noted daily support area.
Data points to consider: Euro group meetings (all day); German Buba monthly report at 11.00am GMT.
Areas worthy of attention:
Supports: 1.2111-1.2134; 1.21 handle; 1.22 handle; 1.2044; 1.2004; 1.2070.
Resistances: 1.2287; weekly trendline resistances; 1.2276; 1.2296; 1.23 handle; 1.2359.
GBP/USD:
Weekly gain/loss: +0.94%
Weekly closing price: 1.3848
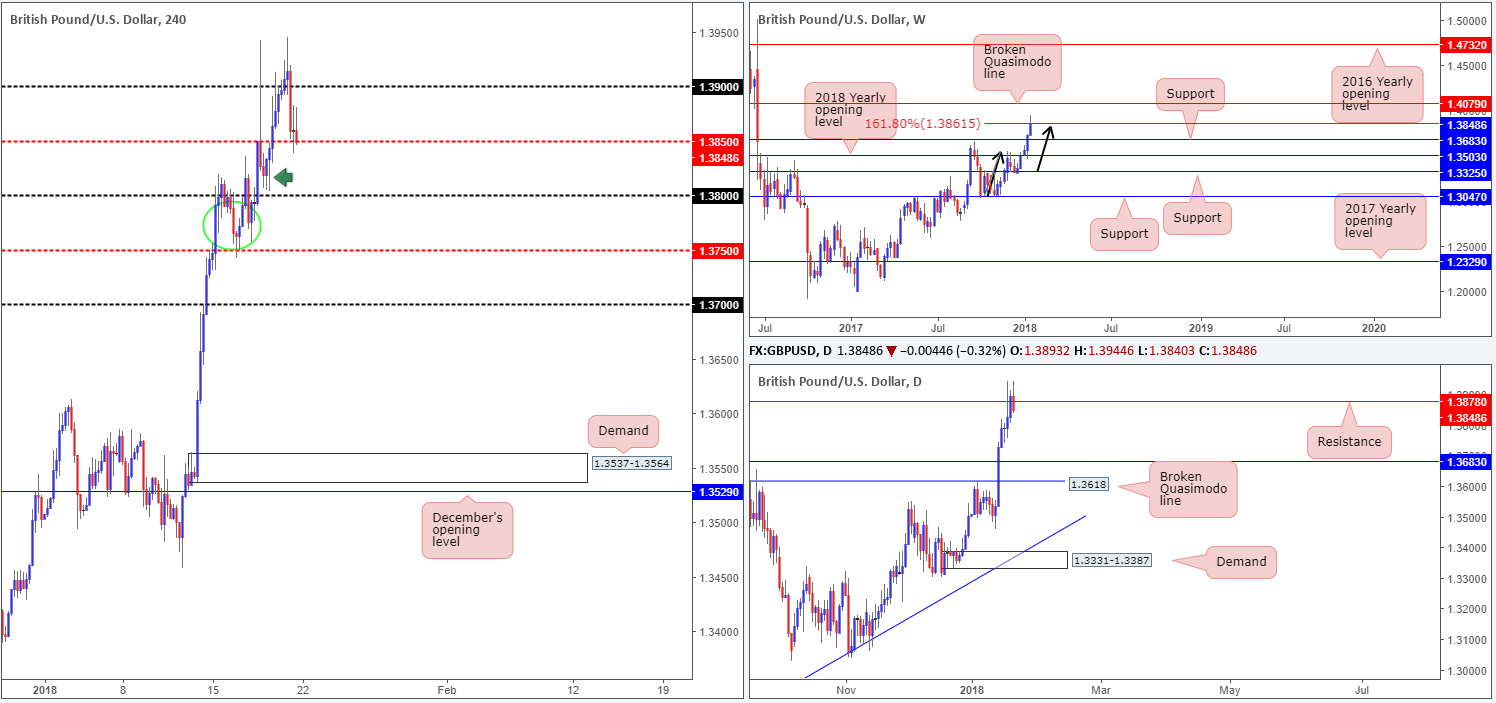
The British pound was, once again, seen flexing its financial muscle last week, cruising to a fresh high of 1.3944. While the unit chalked up its fifth consecutive weekly gain, price has shook hands with a weekly AB=CD (see black arrows) 161.8% Fib ext. point at 1.3861. A push above this line would, technically speaking, expose a weekly broken Quasimodo line at 1.4079 and likely motivate further upside. A rejection from the current line, however, has the weekly support band at 1.3683 to target.
Turning our focus to the daily timeframe, resistance at 1.3878 came into play on Wednesday, but we only really saw the sellers make a play from here going into Friday’s close, despite the threat of a US governmental shutdown. This level, as far as we’re concerned, adds weight to the aforementioned weekly AB=CD formation.
Moving across to the H4 scale, we can see that price failed to sustain beyond the 1.39 handle on Friday. After putting in a top at 1.3945, slightly above Wednesday’s high at 1.3942, sentiment turned sour. Aggressively reclaiming 1.39, the GBP/USD concluded the week closing marginally beyond the H4 mid-level support at 1.3850.
Market direction:
Structurally, the GBP could be headed for further losses this week.
As for potential setups, we do not see much to hang our hat on right now. A decisive H4 close beneath 1.3850, while considered a bearish signal, is a restricted sell, in our view, due to the nearby H4 demand (green arrow) printed just ahead of the 1.38 handle at 1.3804-1.3833.
Data points to consider: No high-impacting events on the docket today.
Areas worthy of attention:
Supports: 1.3850 (potential); 1.38 handle; 1.3683.
Resistances: 1.39 handle; 1.3861; 1.3878; 1.4079.
AUD/USD:
Weekly gain/loss: +1.07%
Weekly closing price: 0.7983
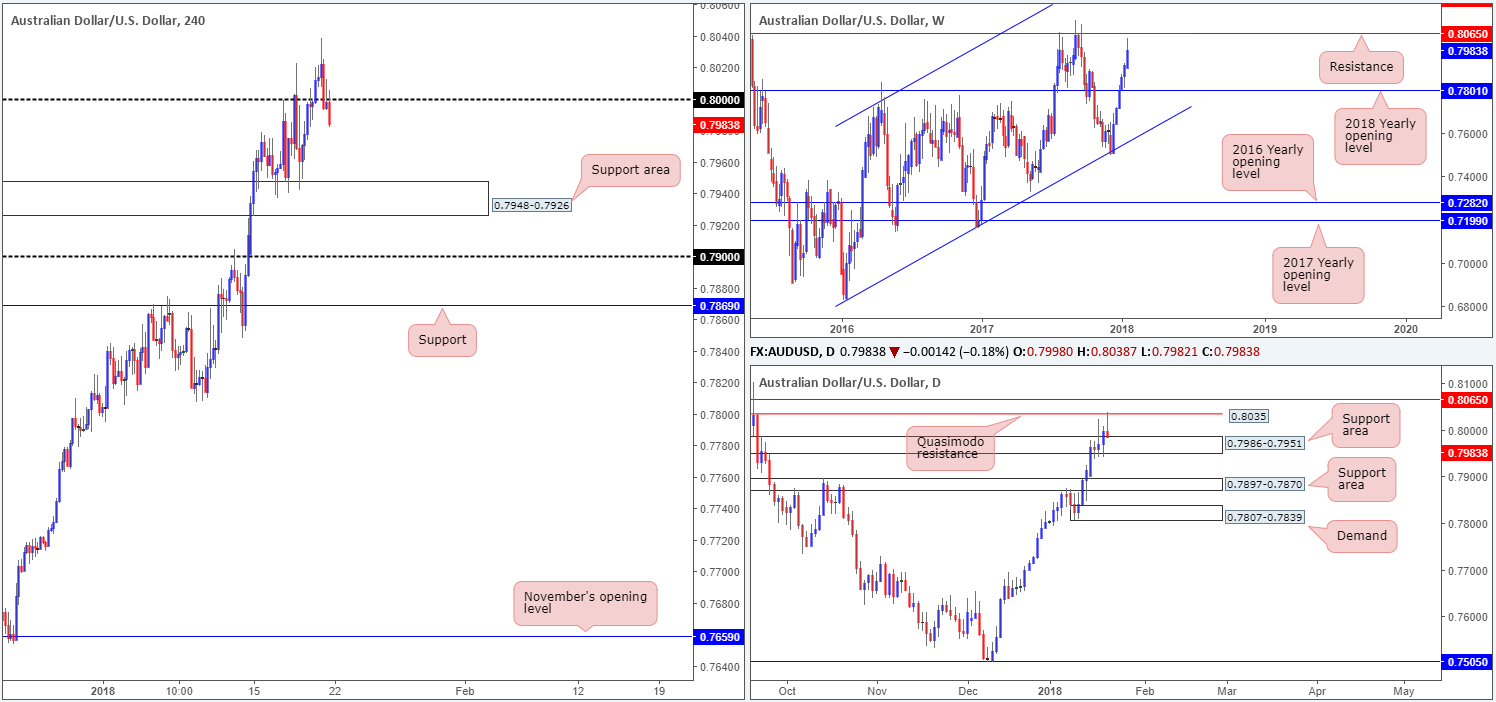
Since weekly price struck the weekly channel support extended from the low 0.6827 six weeks ago, AUD/USD bulls have been on the offensive. Last week’s action dragged the commodity currency to highs of 0.8038, just missing the weekly resistance level at 0.8065 by a few pips.
We believe that the reason behind the pair failing to reach the noted weekly level last week was likely due to a daily Quasimodo resistance level planted at 0.8035. Printing a nice-looking daily selling wick from here on Friday, daily flow ended the week checking in with a daily support area coming in at 0.7986-0.7951.
Going into the later hours of US trading on Friday, the large psychological line 0.80 seen on the H4 timeframe was taken out and retested as resistance in the shape of a near-full-bodied H4 bearish candle. Further losses from this point could see the H4 price eventually engage with a H4 support area drawn from 0.7948-0.7926, which has been a pivotal area of support for the market since Monday last week.
Market direction:
With the near-touch of weekly resistance coming about last week, along with a tasty bearish selling wick forming on the daily timeframe from noted resistance and H4 structure reflecting a bearish stance sub 0.80, the sellers appear to have the upper hand right now. The only grumble is the daily support area mentioned above at 0.7986-0.7951.
The odds of H4 price continuing to punch lower today/early this week are high, in our technical opinion. Should traders look to short the open, and position stops above the H4 rejection candle high 0.8005 (approximately 24 pips), we see 35 pips of room down to the first H4 take-profit target: 0.7948-0.7926.
Data points to consider: No high-impacting events on the docket today.
Areas worthy of attention:
Supports: 0.7948-0.7926; 0.7986-0.7951.
Resistances: 0.80 handle; 0.8065; 0.8035.
USD/JPY:
Weekly gain/loss: -0.31%
Weekly closing price: 110.81
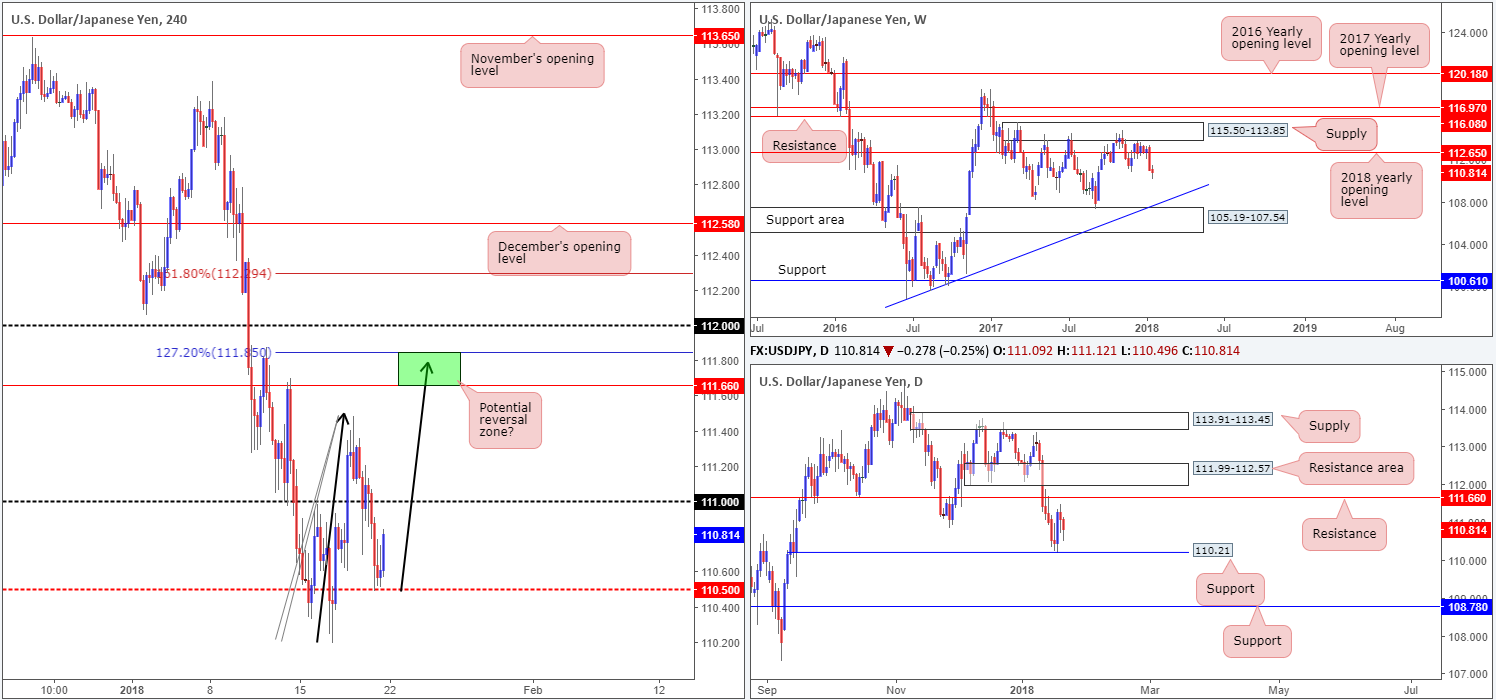
The strong near-full-bodied weekly bearish candle formed two weeks back failed to generate much of a follow-through move last week. Continued selling from current price, nevertheless, may eventually see the weekly candles cross swords with a weekly trendline taken from the low 98.78, followed closely by a weekly support area at 105.19-107.54. A rotation to the upside, on the other hand, places the 2018 yearly opening level at 112.65 back in the spotlight. A closer look at price action on the daily timeframe shows that price remains housed between a daily support at 110.21 and a daily resistance coming in at 111.66.
Branching over to the H4 timeframe, the pair attracted fresh buyers from the H4 mid-level support at 110.50 in early London hours on Friday, eventually pulling the unit to a high of 110.84. A significant close above the nearby 111 handle would, as far as we can see, open up the trapdoor for price to challenge the aforementioned daily resistance. Alongside this, the approach would also likely meet the characteristics required for an AB=CD (black arrows) H4 bearish formation, topping at 111.85 (127.2% Fib ext. point).
Market direction:
With little higher-timeframe structure in motion right now, it is difficult to judge medium-term direction. Short term, nevertheless, we feel the 111 handle will be brought into the fray today. And, as already mentioned, a decisive push through this number could lead to a move being seen up to the noted daily resistance level. For that reason, longs above 111 (preferably following a successful retest – try to avoid buying the breakout) could be an option, targeting the 111.85/111.66 green region on the H4 timeframe.
Data points to consider: No high-impacting events on the docket today.
Areas worthy of attention:
Supports: 110.50; 110.21; 105.19-107.54; Weekly trendline support.
Resistances: 111 handle; 111.66; 112.65; 111.85.
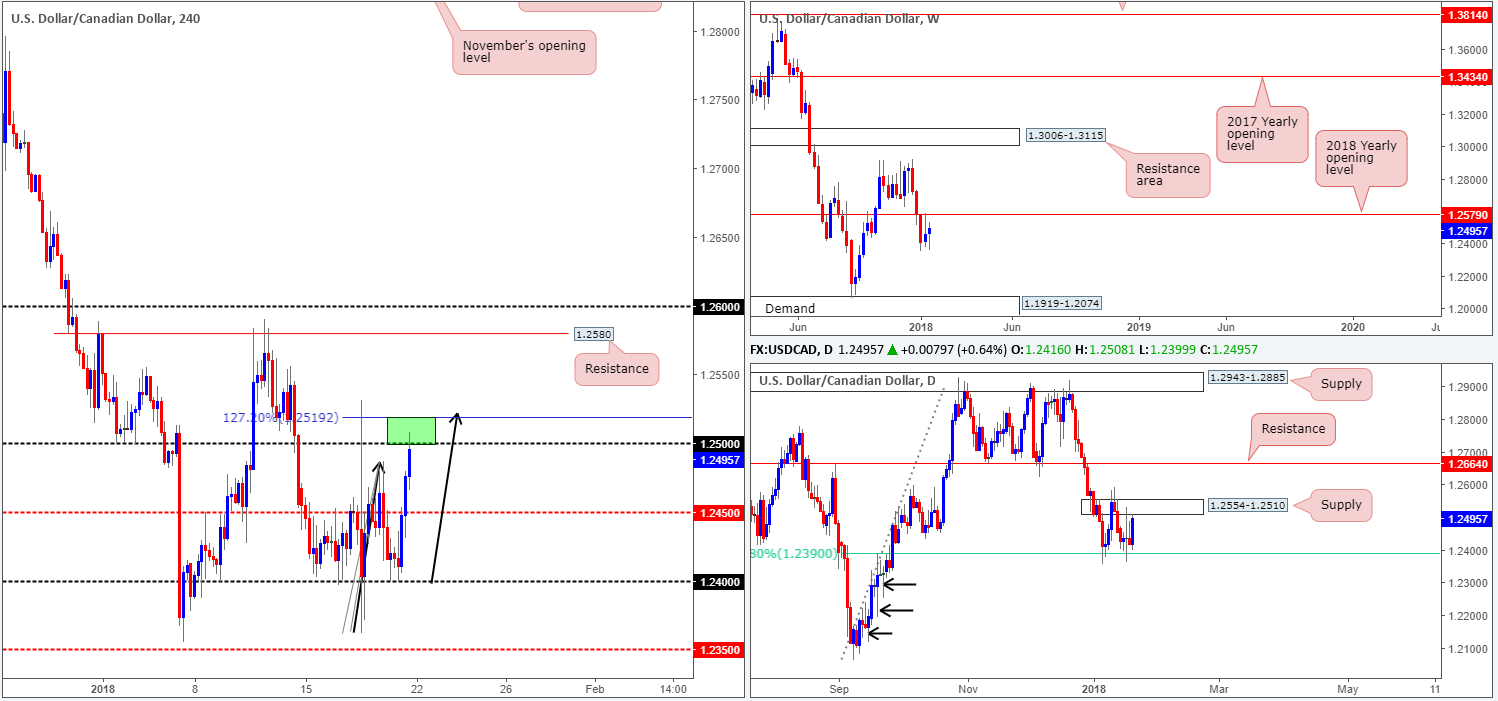
USD/CAD:
Weekly gain/loss: +0.30%
Weekly closing price: 1.2495
Since the beginning of the year, weekly price has consolidated beneath the 2018 yearly opening level at 1.2579. Assuming that the bears notch it up a gear from this point, we do not see a whole lot stopping the unit from reaching as far south as the weekly demand base printed at 1.1919-1.2074.
Meanwhile, the daily candles have been consolidating between a daily supply zone at 1.2554-1.2510 and a 61.8% daily Fib support logged in at 1.2390. A topside breach could prompt an approach to daily resistance plotted at 1.2664, whereas below 1.2390, there’s little support in view. Note the clear daily buying tails marked with black arrows at 1.2253, 1.2194 and 1.2118. These, to us, resemble consumption of unfilled buy orders.
With WTI extending losses on Friday as well as the US dollar gaining traction, the H4 candles pressed forward on Friday and peaked around the 1.25 base line. This number – coupled with a H4 AB=CD (black arrows) 127.2% Fib ext. at 1.2519 (green zone) – could pose a threat to the bulls. Even more so when we consider that within the green area is the lower edge of the noted daily supply!
Market direction:
In light of the resistance seen on the daily and H4 timeframes, we would be hesitant buyers as the odds of a rotation from 1.25ish are higher, in our book. A solid move above 1.25, nevertheless, may portend further upside to the H4 resistance level at 1.2580, shadowed closely by the 2018 yearly opening level mentioned above on the weekly timeframe at 1.2579. This is not a move we would label high probability, though, as it involves buying into daily supply.
Sellers from 1.25 have 1.2450 as an initial take-profit target. From that point, the next level eyed would likely be 1.24/daily 61.8% Fib support.
Data points to consider: CAD Wholesale prices m/m at 1.30pm GMT.
Areas worthy of attention:
Supports: 1.24 handle; 1.2450; 1.2390; 1.1919-1.2074.
Resistances: 1.25 handle; 1.2519; 1.2580; 1.2554-1.2510; 1.2664; 1.2579.
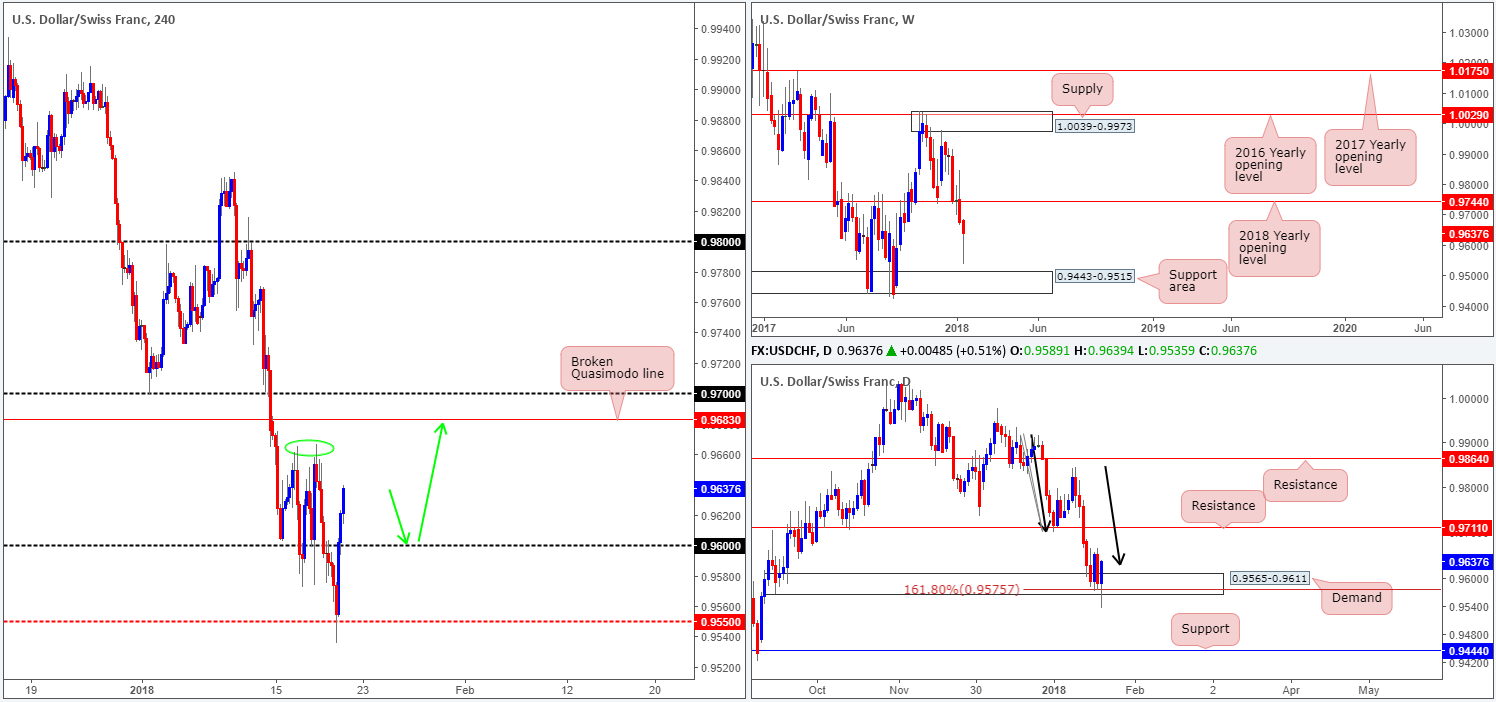
USD/CHF:
Weekly gain/loss: -0.58%
Weekly closing price: 0.9637
Trading beneath the 2018 yearly opening level at 0.9744, weekly price made an earnest attempt to reach the weekly support area at 0.9443-0.9515 last week. According to the weekly timeframe, both the aforementioned weekly support area and the 2018 yearly opening level have an equal chance of being brought into the fight this week.
Stop-loss orders plotted beneath the daily demand area at 0.9565-0.9611 were likely filled on Friday, after whipsawing to weekly lows of 0.9535. Bolstering this daily zone is a daily AB=CD (see black arrows) 161.8% Fib ext. point at 0.9575. Friday’s strong bullish close has likely been noticed by the market and may encourage further upside today/this week to daily resistance at 0.9711.
A quick recap of Friday’s action on the H4 timeframe shows the candles posted a solid corrective move from the H4 mid-level base at 0.9550, swallowing the 0.96 handle and reaching a session high of 0.9639. Additional upside from here would land the unit at 0.9665ish, a classic H4 double-top resistance formation (green circle). This, as you can see, though, is likely going to be overshadowed by a H4 broken Quasimodo line at 0.9683 and the 0.97 handle.
Market direction:
As long as the H4 candles remain above the 0.96 handle, the 0.97/0.9683 H4 resistance area is likely going to be challenged. To take advantage of this potential move, one may want to wait and see if price dips lower and revisits 0.96. A solid response from here would be enough evidence to suggest the buyers want higher prices, in our opinion (green arrows). Buying at current price places one in a difficult position from a risk/reward standpoint, and sites the buy just ahead of the H4 double top. As a result, we feel it’s a no brainer to wait and see if the retest can occur before buying.
Data points to consider: No high-impacting events on the docket today.
Areas worthy of attention:
Supports: 0.96 handle; 0.9550; 0.9443-0.9515; 0.9565-0.9611; 0.9575.
Resistances: 0.97 handle; 0.9683; 0.9665; 0.9711; 0.9744.
DOW 30:
Weekly gain/loss: +1.04%
Weekly closing price: 26071
US equities continued to make headway last week, reaching record highs of 26153. A pullback on the weekly timeframe could see the index dip as low as the 2018 yearly opening level at 24809.
Moving down to the daily timeframe, the next port of support can be seen in the form of a daily channel resistance-turned support extended from the high 21169. A violation of this line would open the floor to a potential test of daily demand marked at 25256-25404.
Looking over to the H4 timeframe, local support at 25947 can clearly be seen bolstering price on Thursday and Friday. As you can probably see, Friday’s action ended in the shape of a full-bodied H4 bull candle. This, considering we’re bounding off of minor H4 support, could incite further upside today. Also worthy of note, is a few points below this angle is a H4 channel resistance-turned support taken from the high 24534.
Market direction:
With absolutely no resistance on the horizon, upside is favored.
Near term, the following levels are of interest for potential buying opportunities are as follows:
- The current H4 support at 25947. The noted H4 full-bodied candle could serve as a buy signal with stops positioned at 25849.
- The broken H4 channel resistance-turned support.
Data points to consider: No high-impacting events on the docket today.
Areas worthy of attention:
Supports: 25947; H4 channel support; 24809; Daily channel support; 25256-25404.
Resistances: …
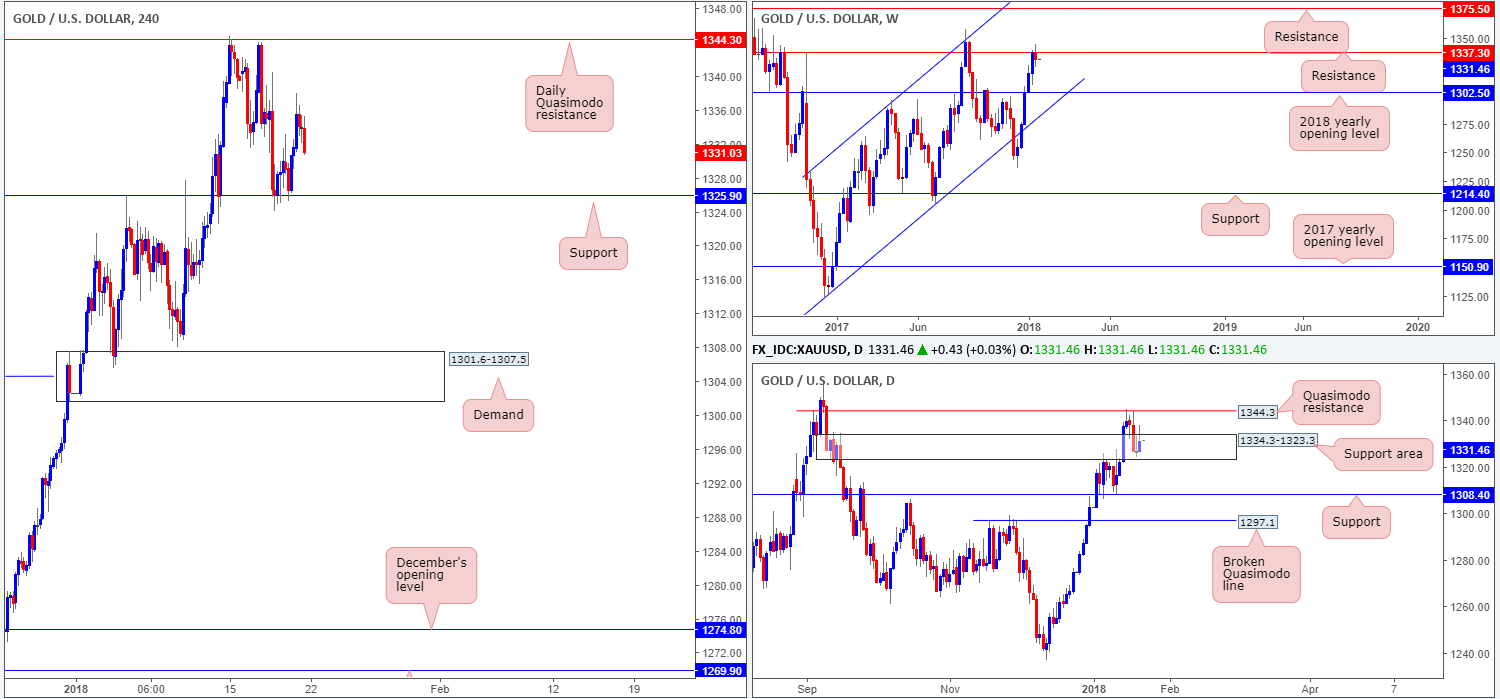
GOLD:
Weekly gain/loss: -0.44%
Weekly closing price: 1331.4
Breaking a five-week bullish phase, weekly sellers made a stand from weekly resistance at 1337.3 last week. While it is not what we’d label a firm rejection, it is still considered a sign that the sellers are involved. A continuation to the downside has the 2018 yearly opening level at 1302.5 to target, whereas a topside breach of 1337.3 may attract further buying up to a weekly resistance level plotted at 1375.5.
From Thursday last week, we saw daily buyers make an appearance from within a daily support area coming in at 1334.3-1323.3. Although some attempt has been made to push higher, Friday’s end-of-day correction wick should be concerning for those long here.
H4 support at 1325.9, seen planted within the lower limits of the noted daily support area, held beautifully on Wednesday last week. H4 bulls bid prices higher from here on Friday, but topped around 1338.0 and reclaimed some of the day’s gains.
Market direction:
With a sense of weak buying seen from the current daily support area, and responding sellers from weekly resistance, our bias for the time being is tilted to the downside. Therefore, looking for longs on a revisit of the aforementioned H4 support is not something we’d label high probability. Instead, wait for a H4 close to print beneath this number, followed up with a retest and a H4 full or near-full-bodied bearish candle. This, in our view, is enough to justify further selling. Much the same as the EUR/USD pair above (a correlated market to gold), additional candle confirmation is required simply because of the daily support area.
Areas worthy of attention:
Supports: 1325.9; 1334.3-1323.3; 1302.5.
Resistances: 1344.3; 1337.3; 1375.5.
This site has been designed for informational and educational purposes only and does not constitute an offer to sell nor a solicitation of an offer to buy any products which may be referenced upon the site. The services and information provided through this site are for personal, non-commercial, educational use and display. IC Markets does not provide personal trading advice through this site and does not represent that the products or services discussed are suitable for any trader. Traders are advised not to rely on any information contained in the site in the process of making a fully informed decision.
This site may include market analysis. All ideas, opinions, and/or forecasts, expressed or implied herein, information, charts or examples contained in the lessons, are for informational and educational purposes only and should not be construed as a recommendation to invest, trade, and/or speculate in the markets. Any trades, and/or speculations made in light of the ideas, opinions, and/or forecasts, expressed or implied herein, are committed at your own risk, financial or otherwise.
The use of the site is agreement that the site is for informational and educational purposes only and does not constitute advice in any form in the furtherance of any trade or trading decisions.
The accuracy, completeness and timeliness of the information contained on this site cannot be guaranteed. IC Markets does not warranty, guarantee or make any representations, or assume any liability with regard to financial results based on the use of the information in the site.
News, views, opinions, recommendations and other information obtained from sources outside of www.icmarkets.com.au, used in this site are believed to be reliable, but we cannot guarantee their accuracy or completeness. All such information is subject to change at any time without notice. IC Markets assumes no responsibility for the content of any linked site. The fact that such links may exist does not indicate approval or endorsement of any material contained on any linked site.
IC Markets is not liable for any harm caused by the transmission, through accessing the services or information on this site, of a computer virus, or other computer code or programming device that might be used to access, delete, damage, disable, disrupt or otherwise impede in any manner, the operation of the site or of any user’s software, hardware, data or property.


