
A note on lower timeframe confirming price action…
Waiting for lower timeframe confirmation is our main tool to confirm strength within higher timeframe zones, and has really been the key to our trading success. It takes a little time to understand the subtle nuances, however, as each trade is never the same, but once you master the rhythm so to speak, you will be saved from countless unnecessary losing trades. The following is a list of what we look for:
- A break/retest of supply or demand dependent on which way you’re trading.
- A trendline break/retest. Buying/selling tails – essentially we look for a cluster of very obvious spikes off of lower timeframe support and resistance levels within the higher timeframe zone.
- Candlestick patterns. We tend to only stick with pin bars and engulfing bars as these have proven to be the most effective.
For us, lower timeframe confirmation starts on the M15 and finishes up on the H1, since most of our higher timeframe areas begin with the H4. Stops usually placed 5-10 pips beyond your confirming structures.
EUR/USD:
The past week saw the single currency tumble lower from the underside of weekly supply drawn from 1.1533-1.1278, which, as you can see, has capped upside since early February 2015. Consequent to this, the EUR lost around 120 pips by the close 1.1126. To our way of seeing things, the next objective to reach falls in at 1.0983 – a weekly resistance-turned support.
From the other side of the field, daily action shows price was bid from the top-side of demand at 1.1072-1.1013 in the later part of last week, causing the pair to close out just above resistance (now acting support) at 1.1122. In the event that buyers remain strong above this barrier this week, there is a chance a rally could be seen back up to supply at 1.1385-1.1332 (located within the aforementioned weekly supply).
A quick recap of Friday’s sessions on the H4 chart reveals that price fell to lows of 1.1066 following a positive U.S. Core CPI reading. The sell-off, however, was short-lived, as the EUR/USD continued to advance, consequently forming a relatively neat double-bottom formation. Psychological resistance at 1.1100 was all but ignored and, as we have already seen on the daily chart, price closed the day above daily resistance at 1.1122, thus potentially creating a support to watch for this week.
Despite the weekly chart showing room to move lower from supply at 1.1533-1.1278, selling this pair both on the daily and H4 chart is challenging, due to the current daily demand and the 1.1100 figure, followed closely by H4 support at 1.1059. Therefore, what we’re hoping to see is the 1.1122 level provide support today and take out the minor H4 supply marked with a black arrow at 1.1149-1.1131, since beyond here the path north appears relatively clear up to psychological resistance 1.1200.
The best setup, at least in our opinion, would be a quick spike above the H4 supply and a pullback to the daily support for a confirmed long entry. 1.1200 would of course be our first take-profit target, followed by the underside of weekly supply at 1.1278 as a second and final target zone.
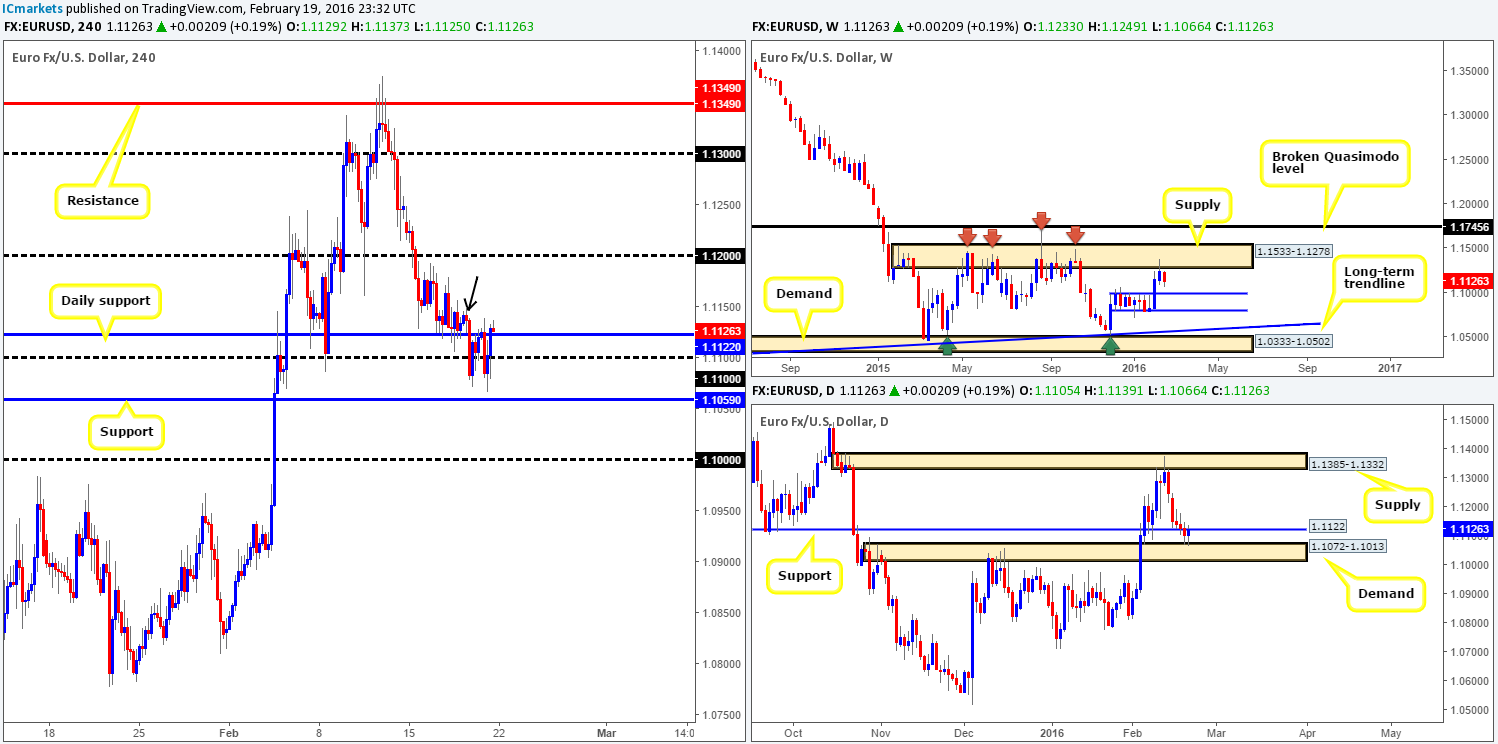
Levels to watch/live orders:
- Buys: 1.1122 [Tentative – confirmation required] (Stop loss: dependent on where one confirms this level).
- Sells: Flat (Stop loss: N/A).
GBP/USD:
Despite last week’s session losing around 100 pips by the close 1.4399, the weekly structure for this pair remains unchanged. The buyers and sellers continue to trade mid-range between a weekly Quasimodo support at 1.4051 and a broken weekly Quasimodo level at 1.4633. As such, both hurdles remain on our watch list going into this week.
Climbing down into the daily chart, support at 1.4231 did an awesome job of providing a base for the buyers last week. From here, active bids pushed price into the extremes of a daily supply area penciled in at 1.4407-1.4350. From where we’re standing, offers appear weak here, which could cause further buying up to resistance drawn from 1.4565, so do a keep a tab on this level this week.
Moving down to the H4 chart, it’s clear to see that the base of our buy zone formed from a Harmonic Gartley pattern around the 1.4258 mark was clearly favored by the market last week, as it was retested for a second time on Friday. The 150-pip rally from here was reportedly sparked by a comment from an E.U official regarding a Brexit deal, which, as shown on the chart, ended the day closing at the underside of psychological resistance 1.4400.
In light of the points made above in bold, there is a chance that Cable may pullback to mid-level support 1.4350, and quite possibly psychological support 1.4300. Therefore, keep a close eye on how the lower timeframe action behaves around 1.4400 today as a sell from this region could be on the horizon. In the event that 1.4400 fails to hold, however, mid-level resistance at 1.4450 will be the next barrier in the spotlight for (lower timeframe) confirmed shorts. Not only does it fuse beautifully with a 61.8% Fibonacci level at 1.4445, it also blends with a H4 trendline taken from the high 1.4668. Despite this confluence, we’re only expecting a bounce here due to there being little higher-timeframe convergence.
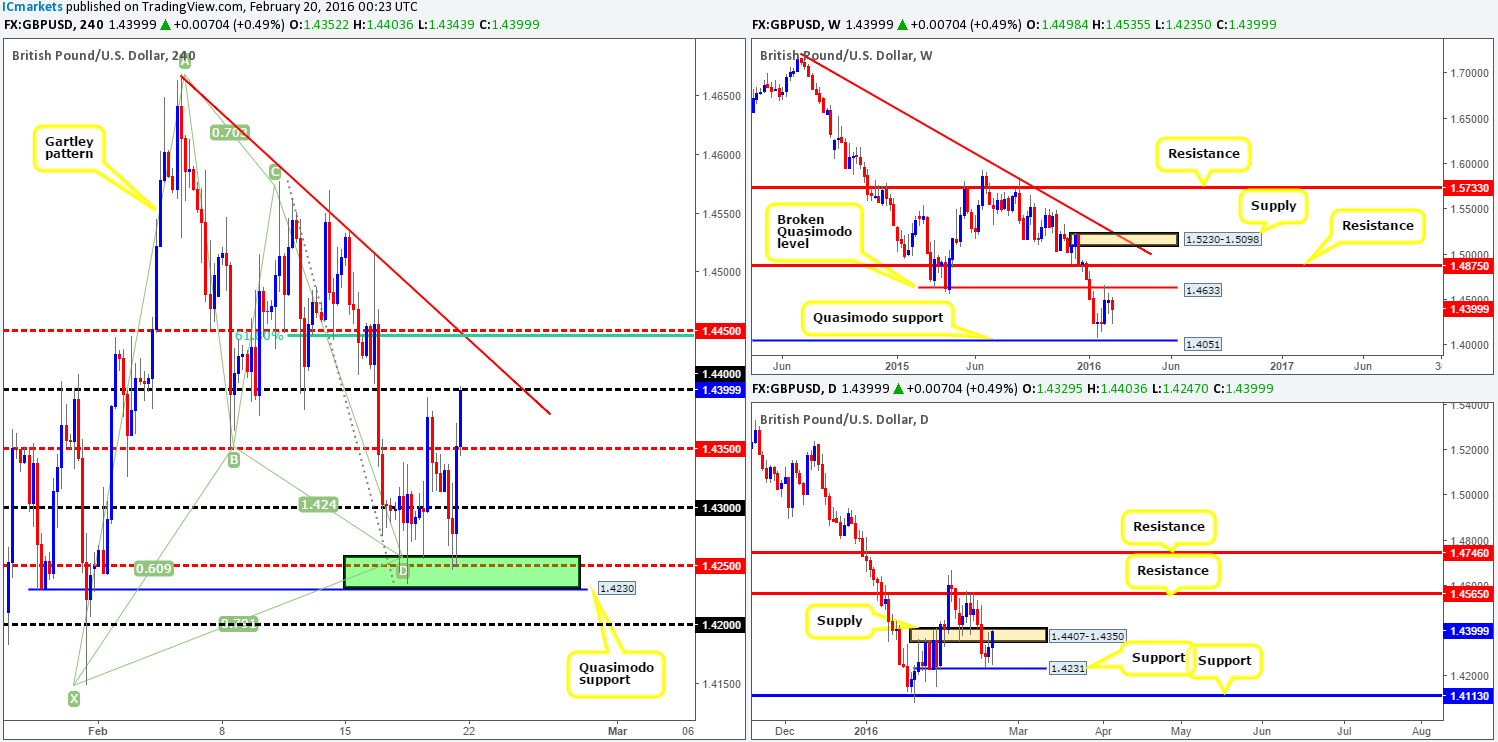
Levels to watch/live orders:
- Buys: Flat (Stop loss: N/A).
- Sells: 1.4400 [Tentative – confirmation required] (Stop loss: dependent on where one confirms this level). 1.4450 [Tentative – confirmation required] (Stop loss: dependent on where one confirms this level).
AUD/USD:
Following the retest of weekly support at 0.7035, the commodity currency recorded a narrow 45-pip gain last week by the close 0.7144. In spite of this, there’s still potential for further upside from here towards weekly supply chalked in at 0.7438-0.7315. From a technical standpoint, the reason for mediocre gains was likely caused by sellers defending daily resistance at 0.7178.
A quick recap of Friday’s sessions on the H4 reveals that active buyers came into the market from H4 support at 0.7081, shortly after the U.S. opened its doors for business. The aggressive buying from this region resulted in price attacking the mid-level resistance barrier at 0.7150, which is where the market concluded trade for the week.
Going forward, shorting from 0.7150 is not really something that sparks our interest simply because a more attractive supply is seen just above at 0.7217-0.7191. This area offers a deep 88.6% Fibonacci resistance at 0.7212, a psychological resistance at 0.7200 and it also sits just above the daily resistance level at 0.7178. Despite the collection of structures seen here, caution is still advised. Weekly action shows room to continue northbound which could potentially wipe out both the H4 supply and daily resistance. Therefore, we would only consider this a legit trading zone once a lower timeframe sell setup forms. Targets from this area will be dependent on how the H4 approaches the supply.
Should prices trade higher this week, however, we’d need to see a daily candle close above the daily resistance in order for us to being looking to enter long on this pair. The ultimate target from here would of course be the weekly supply, but one would also need to factor in the daily supply at 0.7327-0.7283 which is glued to underside of the weekly zone.
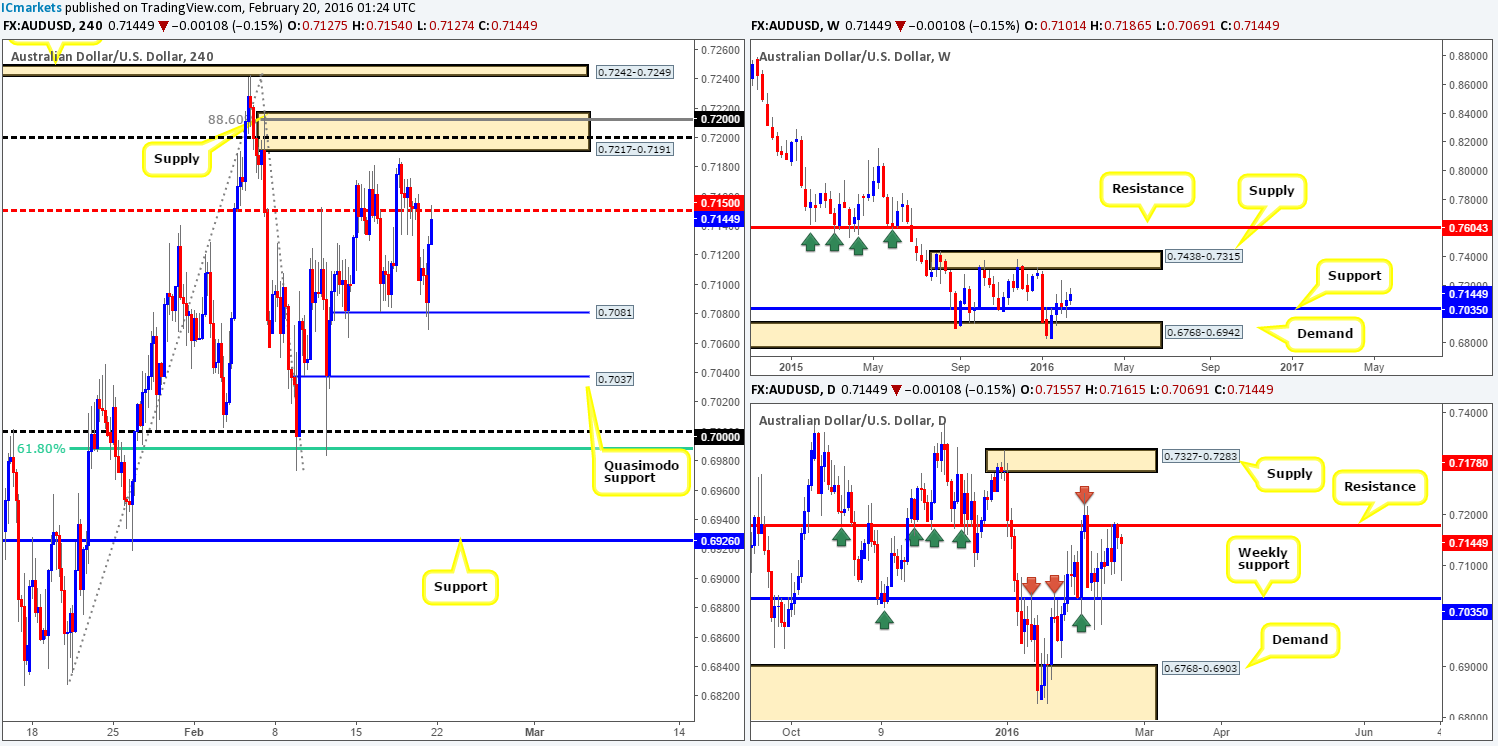
Levels to watch/live orders:
- Buys: Flat (Stop loss: N/A).
- Sells: 0.7217-0.7191 [Tentative – confirmation required] (Stop loss: dependent on where one confirms this area).
USD/JPY:
As can be seen from the weekly chart, the recently broken support at 114.12 was retested as resistance last week, consequently erasing a further 64 pips of value from this market at the close 112.53. The next downside target to have on your watch list comes in at 110.09 – a long-term support.
Stepping down to the H4 chart, both demand at 113.16-113.51 and psychological support 113.00 was taken out in the early hours of Friday’s trading. Shortly after, price retested these broken boundaries and fell to lows of 112.30 by the week’s end. This was a move our team highlighted to keep an eye open for, so well done to any of our readers who managed to lock in some green pips here!
Looking down to the 112.00 figure this week, we see a possible bounce taking place from here. Not only is it bolstered by a deep 78.6% Fibonacci level at 111.77, but it also boasts a collection of very obvious buying tails marked with a dark green arrow. This, at least to us, suggests that pro money were interested in this level not too long ago, thus unfilled buy orders could still remain. For all that though, a bounce is all that’s expected here due to the position of price on the weekly timeframe (see above), so trade cautiously. The more interesting setup, however, would be on the break below and (confirmed) retest of 112.00 since at that point, you’d be trading in-line with weekly expectations. Should our analysis be correct and we manage to pin down a setup below 112.00, we’ll be eyeing the 111.00 figure as our immediate take-profit target, followed by the weekly support at 110.09.
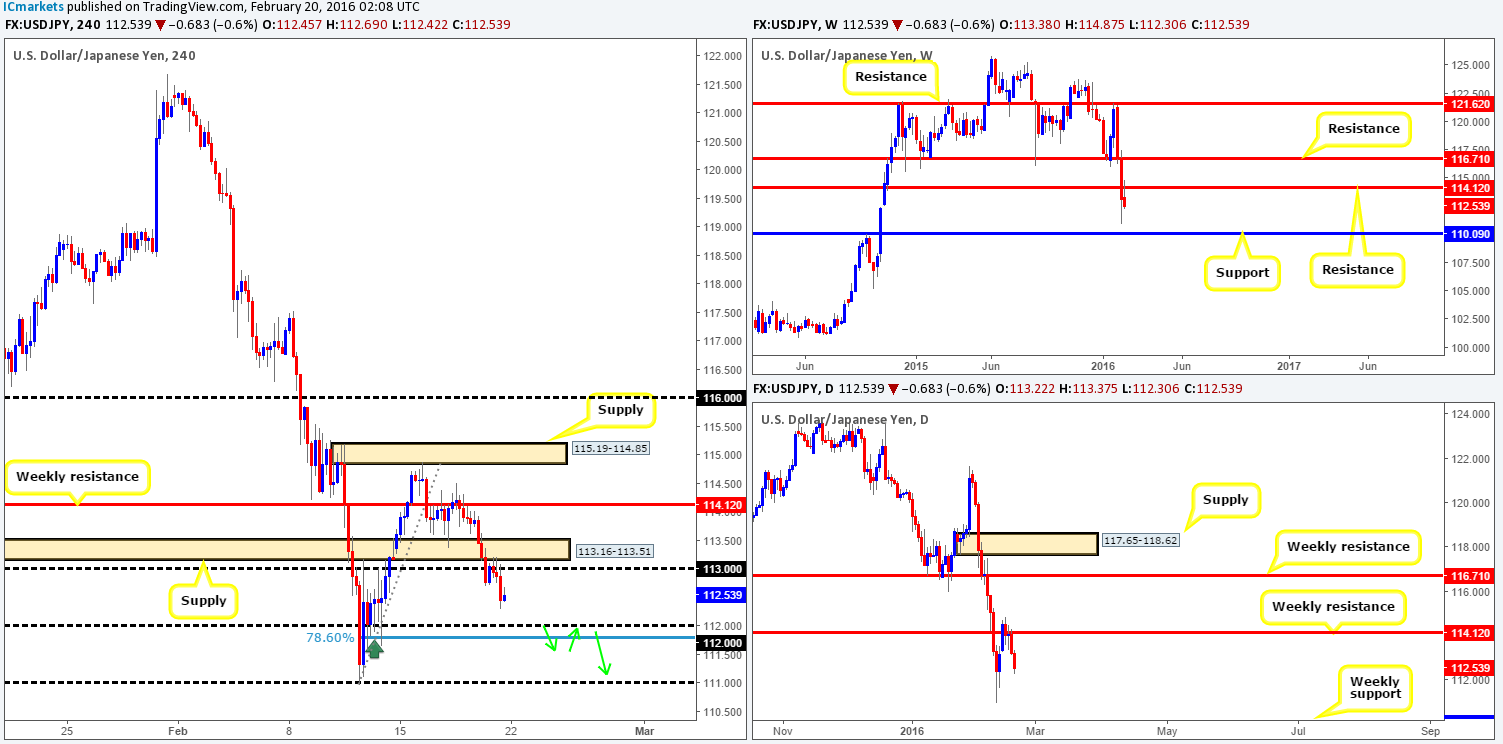
Levels to watch/live orders:
- Buys: 112.00 [Tentative – confirmation required] (Stop loss: dependent on where one confirms this level).
- Sells: Watch for bids to be consumed around 112.00 and look to trade any retest seen thereafter (lower timeframe confirmation required).
USD/CAD:
The USD/CAD sustained further losses for a fifth consecutive week last week, erasing around eighty pips by the close 1.3765. On account of this, weekly support at 1.3814 was taken out, and as a result, could potentially provide resistance to the market this week. The next support target in the limelight comes in at 1.3381 –a clear barrier which has good history.
Zooming in and taking a closer look at the daily action shows that demand drawn from 1.3673-1.3754 appears fragile at the moment. One could consider Friday’s inverted pin bar to be a buy signal from here, but considering the recent close below weekly support, a move lower down to the long-term daily trendline extended from the low 1.1919 is more likely in our opinion.
Jumping across to the H4 chart, price whipsawed through psychological resistance 1.3800 going into Friday’s U.S. session, reaching lows of 1.3762. As previously mentioned, H4 action appears to be chalking up two AB=CD bull patterns on approach to a psychological support at 1.3600 and demand fixed at 1.3516-1.3561. Both areas, as you can probably see, are supported by the daily trendline mentioned above, in spite of this, we still favor the demand. Our rationale behind this approach comes from the fact that psychological boundaries are notorious for fakeouts, and with a juicy-looking demand lurking only forty pips below, a break lower is very likely, hence our decision to focus on the demand.
Despite the confluence seen at this demand, nevertheless, we would highly recommend waiting for the lower timeframes to confirm this zone since, as we discussed above, weekly action is presently showing room for a move lower to support at 1.3381.
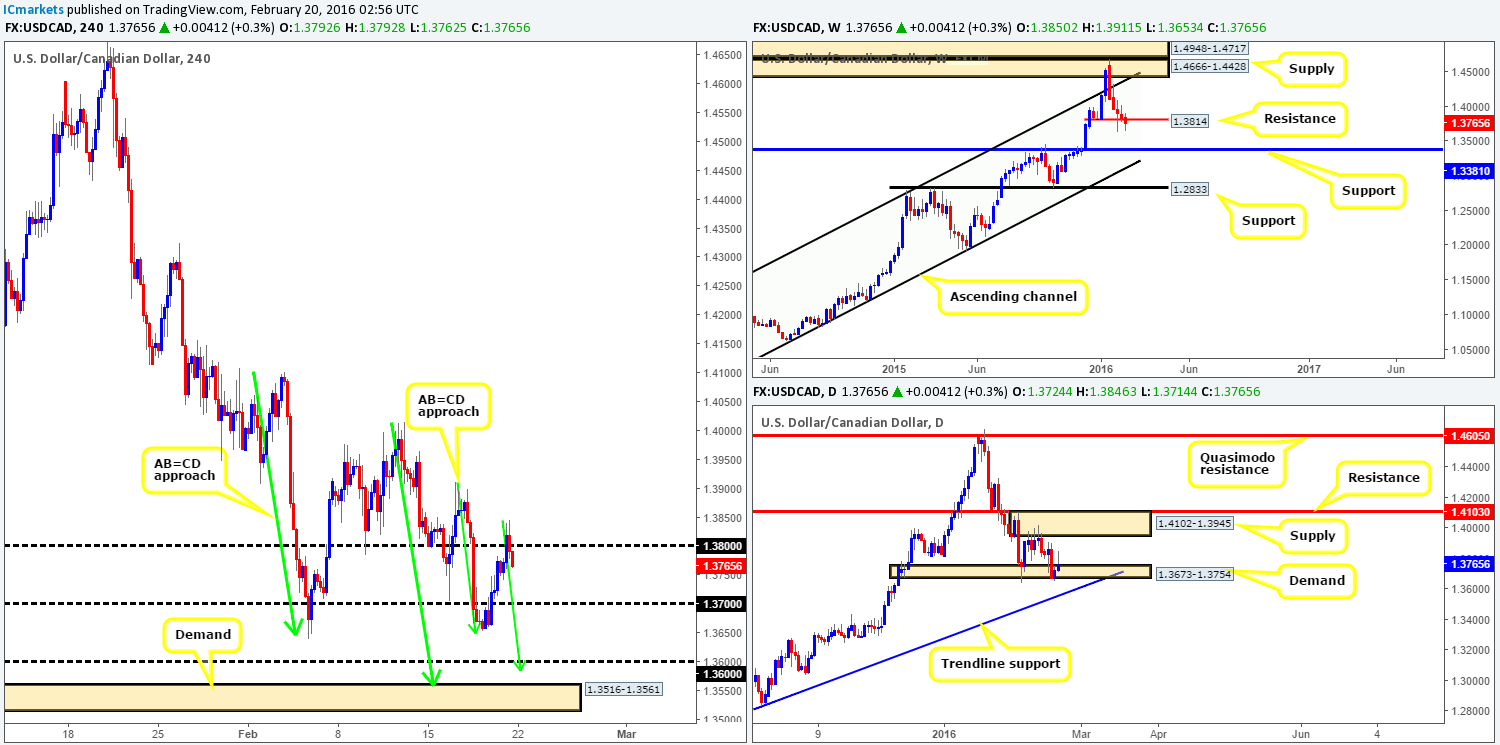
Levels to watch/live orders:
- Buys: 1.3600 [Tentative – confirmation required] (Stop loss: dependent on where one confirms this level). 1.3516-1.3561 [Tentative – confirmation required] (Stop loss: dependent on where one confirms this area).
- Sells: Flat (Stop loss: N/A).
USD/CHF: (Slightly revised)
Following a strong two-week decline, a steady wave of bids came into this market last week off the back of a weekly trendline support extended from the low 0.9078, consequently forming a weekly inside candle (buy signal). As bullish as this may sound, buying on the basis of the above points might not be the best path to take considering price is still housed within a weekly resistance area drawn from 0.9796-0.9902.
Scrolling down to the daily chart, we can see that the pair found resistance at the underside of a supply zone penciled in at 0.9958-1.0036 in the later part of last week. In the event that the bears continue to dig lower this week, however, support at 0.9822 will be the next barrier to come into play.
Breaking into the H4 timeframe, psychological support 0.9900 was taken out a few hours before the week’s close. This has likely opened up the floor for a move down to support at 0.9857. In view of this recent movement coupled with the higher-timeframe picture (see above), the only setup we see possible as of now is a (confirmed) trade short on the retest of 0.9900. Should we manage to pin down a lower timeframe sell beneath this number, we’ll be targeting both the H4 support at 0.9857 and the daily support mentioned above at 0.9822, giving an overall eighty-pip profit objective. Other than this, we unfortunately see no other play until the higher timeframes make a move.
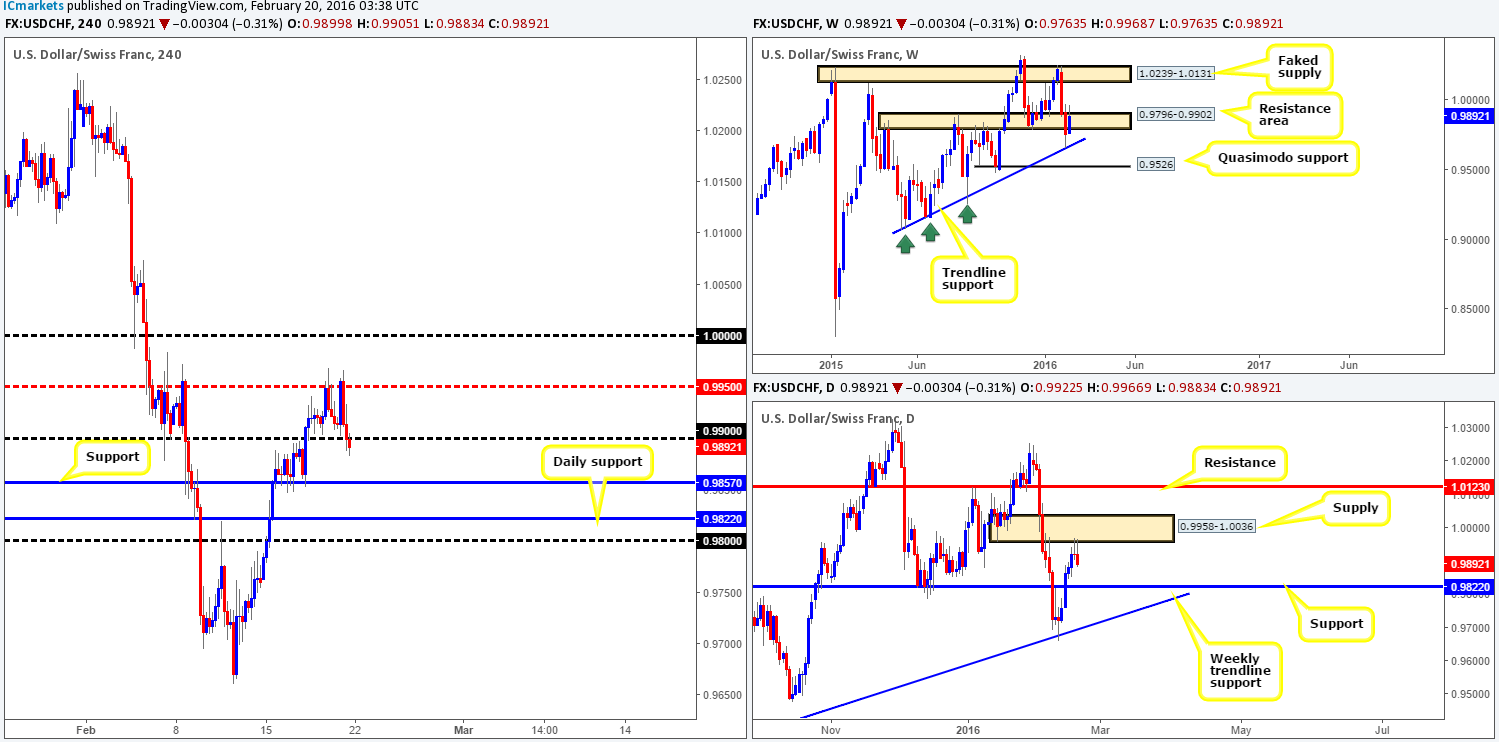
Levels to watch/live orders:
- Buys: Flat (Stop loss: N/A).
- Sells: 0.9900 [Tentative – confirmation required] (Stop loss: dependent on where one confirms this level).
DOW 30:
Weekly support at 15978 once again bolstered this market last week, resulting in the DOW printing a healthy gain of over 400 points into the close 16388. Whether this buying momentum will continue this week is difficult to judge since the 16500 region is clearly a strong ceiling to overcome.
Branching lower, one can see that this weekly ceiling is in actual fact an area of daily resistance at 16625-16435. Technically, for this index to rally up to the minor weekly resistance level at 16935, this barrier will have to be taken out first. Should this take place this week along with a retest of this area as demand, this could make for a wonderful buying opportunity on this timeframe.
From the H4 chart, however, resistance at 16509 held this market lower from Thursday onwards last week, forcing price to lows of 16275 by the week’s end. Via this timeframe, there’s little support stopping this unit from dropping down to test demand coming in at 16110-16211 sometime this week. A break beyond this zone, nevertheless, would likely clear the runway down to the Quasimodo support at 15799.
Given all of the points made above, here are our battle lines going into this week:
For buys:
- The H4 demand at 16110-16211.
- The H4 Quasimodo support at 15799 (located just below the current weekly support level).
For sells:
- H4 resistance at 16509 (located within the aforementioned daily resistance area).
- H4 Quasimodo resistance at 16593 (positioned high within the aforementioned daily resistance area).
Of course, it is down to the individual trader on how he/she decides to enter the market. For us personally, we would not feel comfortable trading the above said levels without corresponding lower timeframe confirmation.
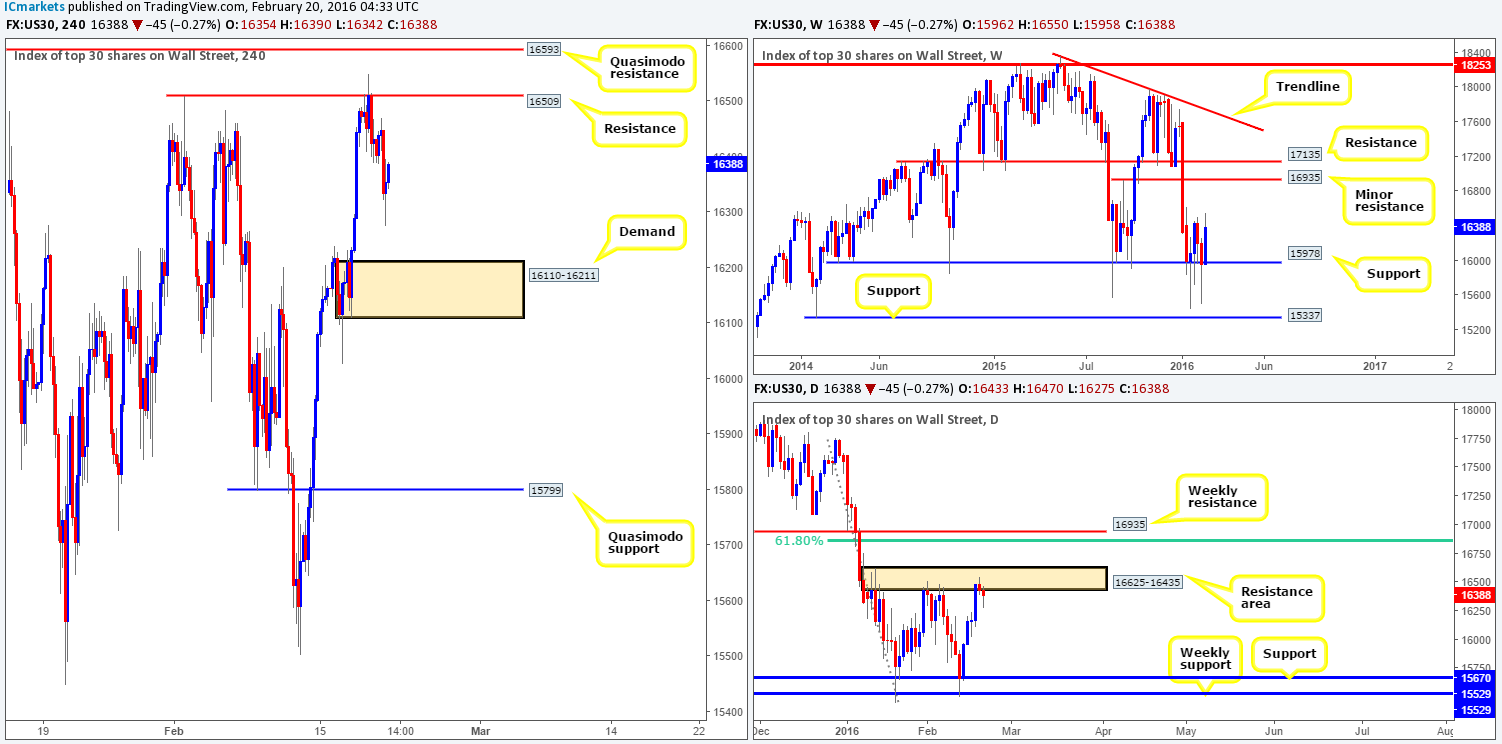
Levels to watch/live orders:
- Buys: 16110-16211 [Tentative – confirmation required] (Stop loss: dependent on where one confirms this area). 15799 [Tentative – confirmation required] (Stop loss: dependent on where one confirms this level).
- Sells: 16509 [Tentative – confirmation required] (Stop loss: dependent on where one confirms this level). 16593 [Tentative – confirmation required] (Stop loss: dependent on where one confirms this level).
XAU/USD: (Gold)
Although Gold posted a weekly loss of around $11 by the week’s end at 1227.7, we still consider it positive. The reason for why comes from seeing price respond so beautifully from not only the weekly broken supply (now demand) at 1205.6-1181.2, but also the recently broken weekly wedge resistance (now support) taken from the high 1485.3. In the event that bids remain stable here, there’s a possibility that the yellow metal may cross paths with supply seen overhead at 1307.4-1280.0 sometime soon.
Casting our line down to the daily chart shows us that upside is presently capped by supply drawn from 1273.9-1260.2, whilst downside is supported by a demand coming in at 1181.4-1200.7. A break above this supply will immediately land one within touching distance of the aforementioned weekly supply. Meanwhile, a break below the current demand could open the floodgates for a move down to weekly support penciled in at 1157.4.
Moving down one more level the H4, Friday’s price action was relatively mellow in comparison to Thursdays. Session highs were recorded at 1234.4, and lows came in at 1219.8. Judging from where the weekly timeframe bounced last week, and considering there is room on the daily timeframe to move higher (see above), our team favors the buy-side of the market this week.
Therefore, the areas we have noted down on our watch list are as follows:
- The H4 demand at 1200.6-1207.8, which sits on top of the daily demand mentioned above at 1181.4-1200.7.
- On the assumption that the above area caves in, however, the next buy zone can be seen at 1181.4-1187.4 – another H4 demand which happens to be positioned within the extreme of the above said daily demand.
Should price reach these areas this week, a bounce is highly likely in our opinion. To be on the safe side though, we’d recommend entering alongside a lower timeframe buy signal.
If Gold continues to advance without crossing swords with the above said areas of value, we’ll then watch for the H4 supply at 1239.9-1235.7 to be taken out. This would, in effect, be our cue to begin watching for a confirmed retest of the supply as demand, with a target objective seen at the H4 resistance at 1256.2 – placed just below the above said daily supply.
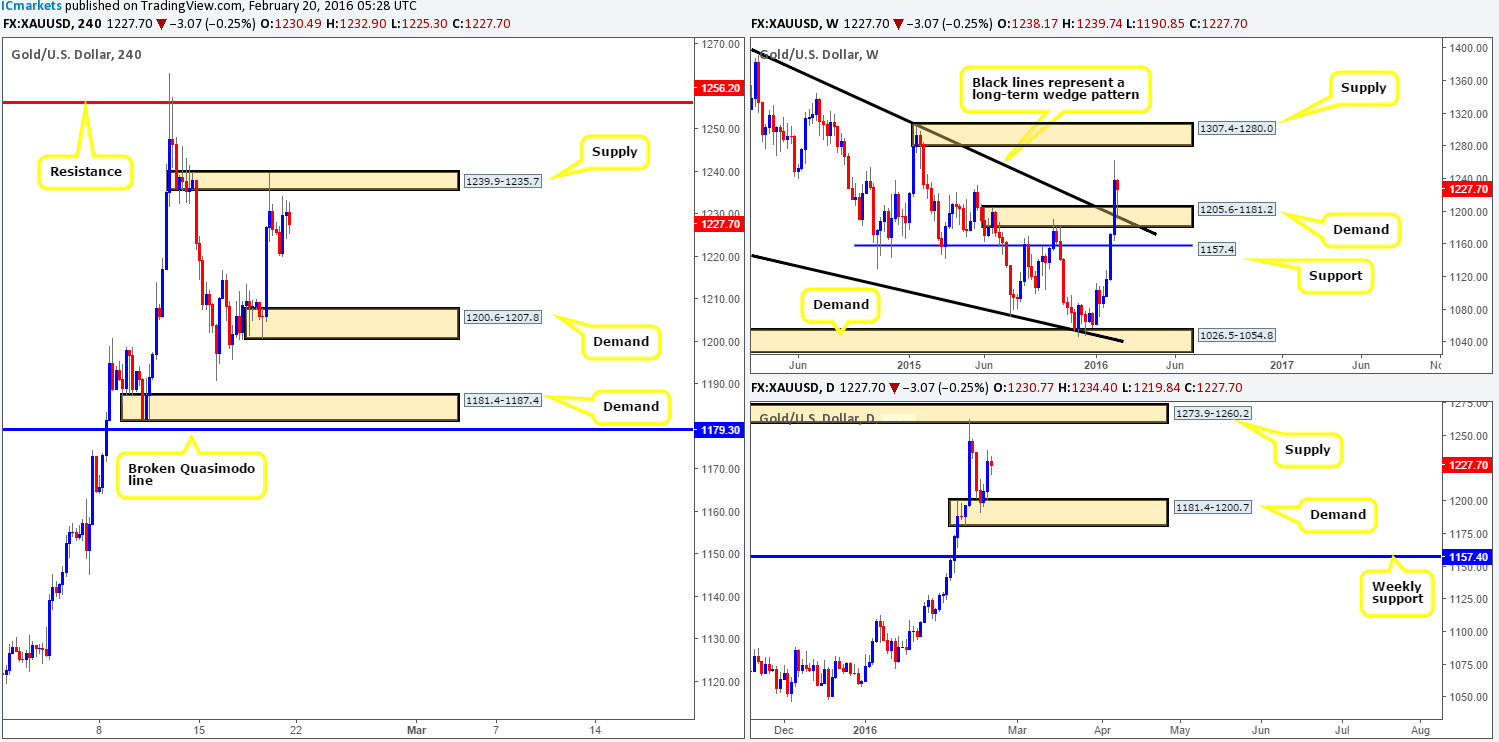
Levels to watch/live orders:
- Buys: 1200.6-1207.8 [Tentative – confirmation required] (Stop loss: dependent on where one confirms this area). 1181.4-1187.4 [Tentative – confirmation required] (Stop loss: dependent on where one confirms this area). Watch for offers to be consumed around the 1239.9-1235.7 and then look to trade any retest seen thereafter (lower timeframe confirmation required).
- Sells: Flat (Stop loss: N/A).


