
A note on lower timeframe confirming price action…
Waiting for lower timeframe confirmation is our main tool to confirm strength within higher timeframe zones, and has really been the key to our trading success. It takes a little time to understand the subtle nuances, however, as each trade is never the same, but once you master the rhythm so to speak, you will be saved from countless unnecessary losing trades. The following is a list of what we look for:
- A break/retest of supply or demand dependent on which way you’re trading.
- A trendline break/retest.
- Buying/selling tails/wicks – essentially we look for a cluster of very obvious spikes off of lower timeframe support and resistance levels within the higher timeframe zone.
- Candlestick patterns. We tend to only stick with pin bars and engulfing bars as these have proven to be the most effective.
We search for lower timeframe confirmation between the M15 and H1 timeframes, since most of our higher-timeframe areas begin with the H4. Stops are usually placed 5-10 pips beyond confirming structures.
EUR/USD:
Weekly gain/loss: + 161 pips
Weekly closing price: 1.1318
Weekly opening price: 1.1307
Weekly view: The recently closed weekly candle, as can be seen from the chart, punched into a major weekly resistance area given at 1.1533-1.1278. This zone has capped upside in this market since May 2015 so a bearish reaction is likely. The next downside target to have an eye on this week falls in around the 1.0970 region, followed closely by a major weekly support seen at 1.0819.
Daily view: In conjunction with weekly price, the daily chart also shows the EUR connecting with a daily supply zone at 1.1446-1.1369 going into the week’s end. Merging beautifully with a daily trendline resistance taken from the low 1.0821, suggests price may tumble south towards at least the daily support area at 1.1224-1.1104 this week.
H4 view: For those who followed our daily reports last week you may recall that our team shorted from 1.1362 with a stop placed at 1.1432. On Friday, we mentioned that we had an initial target set at the 1.13 handle which came very close to being achieved at this morning’s open 1.1307. We’ve now reduced risk to breakeven and have taken 50% of the position off the table. Our final take-profit target for this sell can be seen around the H4 mid-way support 1.1250/H4 support line coming in at 1.1237, due to this barrier lurking just ahead of the daily support area mentioned above at 1.1224-1.1104.
Direction for the week: In light of the technical confluence seen between the weekly and daily charts we feel this market will eventually rotate south this week.
Direction for today: While the 1.13 handle could be a logical area for price to bounce from given that it fuses with a H4 trendline support taken from the high 1.1164, this number, as the higher timeframes suggest, will likely be taken out either today or tomorrow.
Our suggestions: Traders who missed the shorting opportunity around the 1.1360 region last week may get a chance to join this move when/if price closes below the 1.13 number. A close below here followed by a retest would, in our book, be sufficient enough to condone an intraday sell position targeting the 1.1250/1.1237 region, which as we already know, is positioned neatly above the aforementioned daily support area.

Levels to watch/live orders:
- Buys: Flat (Stop loss: N/A).
- Sells: 1.1362 [LIVE] (Stop loss: Breakeven).
GBP/USD:
Weekly gain/loss: + 156 pips
Weekly closing price: 1.3072
Weekly opening price: 1.3051
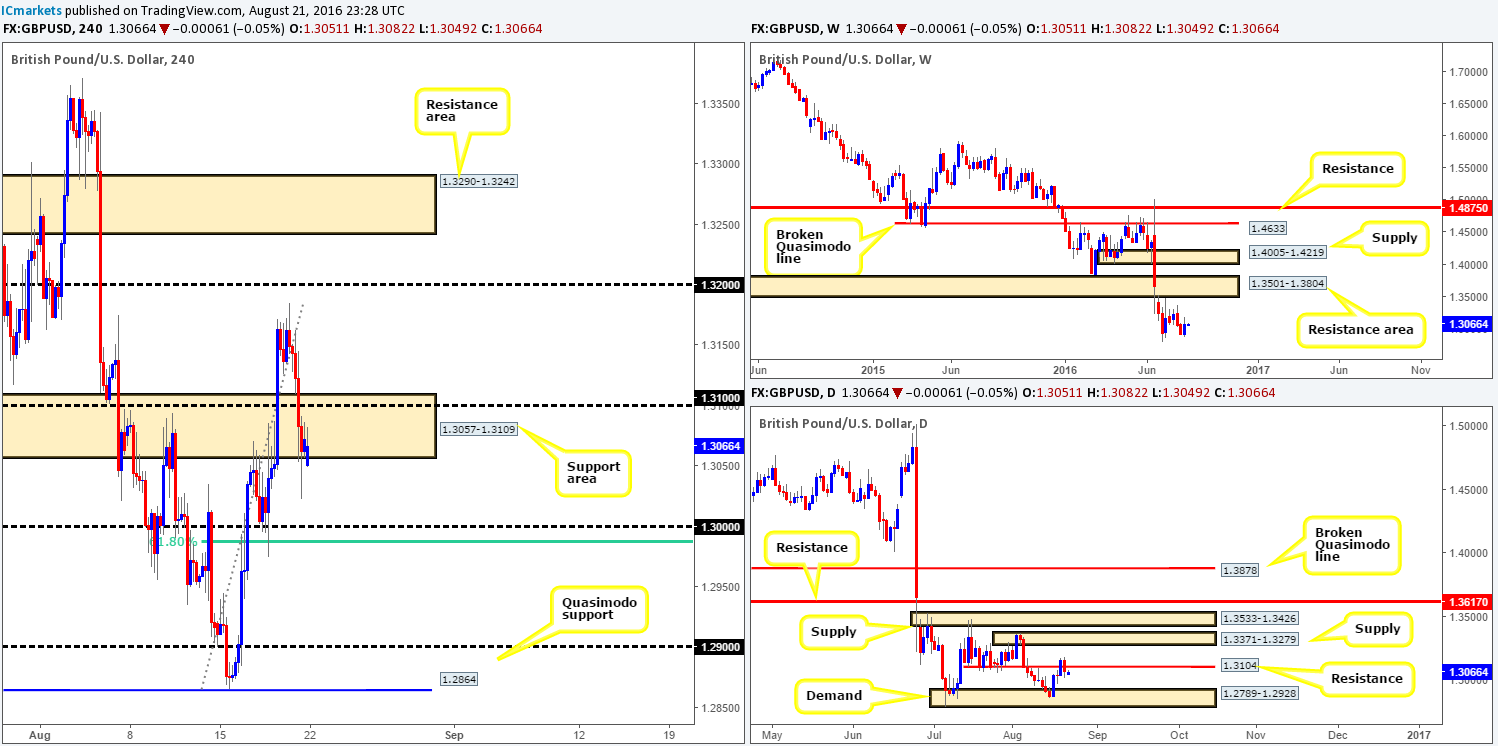
Weekly view: During the course of last week’s action, the pair chalked up a relatively nice-looking weekly bullish engulfing candle. While there’s a possibility that this could propel price north this week, let’s not forget that the predominant trend remains south.
Daily view: On Tuesday last week we saw the bulls rotate price beautifully from daily demand coming in at 1.2789-1.2928. This eventually pulled cable up to daily resistance penciled in at 1.3104, which, as you can see, saw a two-day whipsaw (effectively a daily bearish engulfing candle) take shape around this level by the week’s close.
H4 view: After price topped out around the 1.3160 region on Thursday, we can see that the unit sold off going into Friday’s London session on the back of modest US dollar strength. Price blew through the 1.31 handle and touched base with the lower edge of a H4 support area fixed at 1.3057-1.3109, which for the time being is holding steady.
Direction for the week: A strong weekly trend coupled with a daily bearish engulfing candle forming around a daily resistance at 1.3104 could prompt further selling in the market this week, despite the weekly bullish engulfing candle.
Direction for today: Although the buyers and sellers are trading within the above said H4 support area at the moment, we feel it’s unlikely that we’ll see price breach the 1.31 boundary today. Technically speaking, the key figure 1.30 is the more attractive number traders are likely honing in on today. Not only because it is a large psychological level but also because it blends with a H4 61.8% Fib support at 1.2988.
Our suggestions: Despite the market opening on the bid this morning, we would not recommend buying this market. Instead, traders may want to watch the 1.30 number for an intraday bounce higher (lower timeframe confirmation required – see the top of this report). However, always keep in mind that daily price shows room to extend lower down to a daily demand zone at 1.2789-1.2928, and that the pair is currently entrenched within a rather steep downtrend, hence our expectation of only a bounce from 1.30.
Should price close beyond this number, nevertheless, then we see little standing in the way of a move down to the top edge of the daily demand area at 1.2928. A close below 1.30 accompanied by a retest and a lower timeframe sell signal (see the top of this report) is, in our opinion, enough evidence to condone a short from here, targeting the top edge of the daily demand area at 1.2928.
Levels to watch/live orders:
- Buys: 1.30 [Tentative – confirmation required] (Stop loss: dependent on where one confirms this area).
- Sells: Watch for price to close below 1.30 and then look to trade any retest seen thereafter (lower timeframe confirmation required).
AUD/USD:
Weekly gain/loss: – 22 pips
Weekly closing price: 0.7624
Weekly opening price: 0.7601
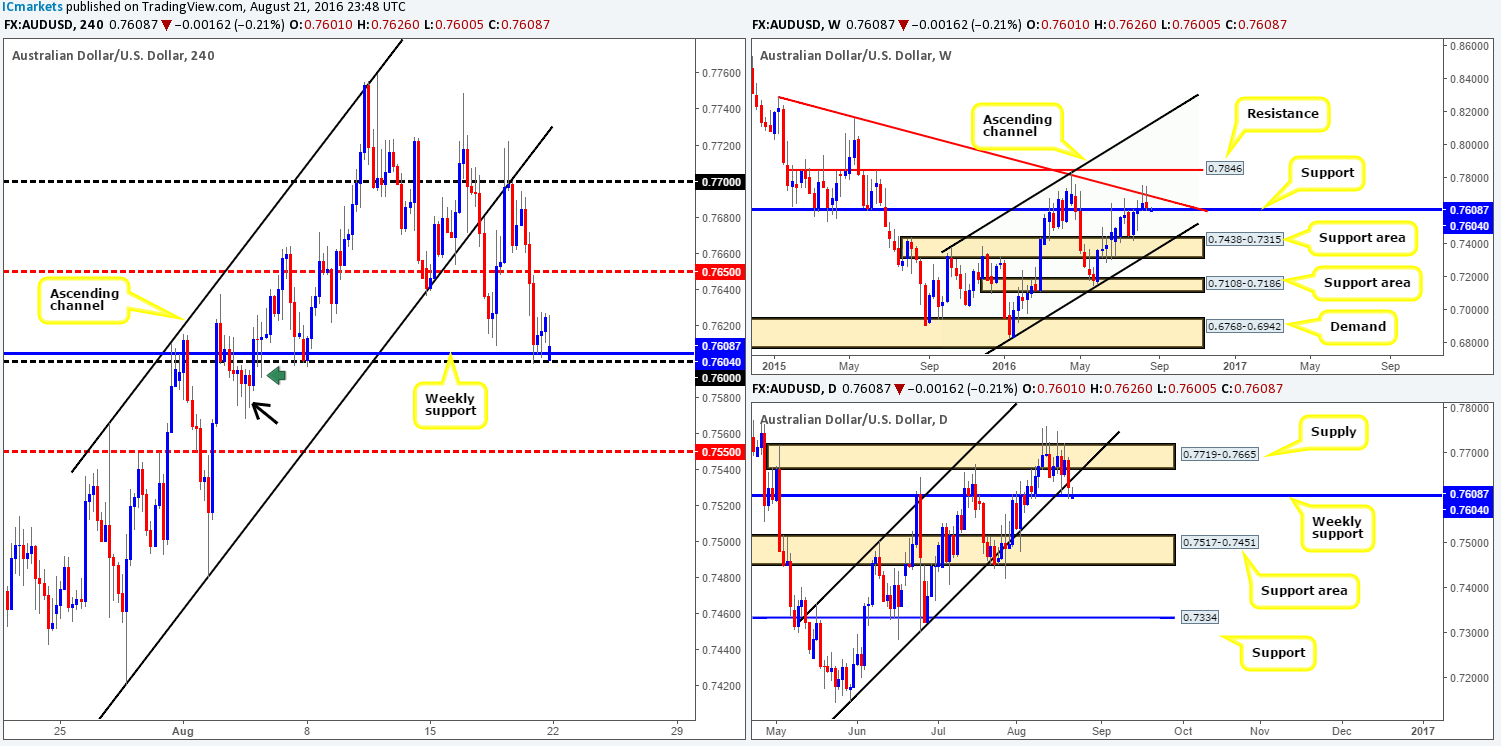
Weekly view: The past week saw the commodity-linked currency print its second consecutive weekly selling wick from the underside of a weekly trendline resistance extended from the high 0.8895. Be that as it may, although this is considered bearish one has to take into that price is also shaking hands with a weekly support level at 0.7604.
Daily view: Down here on the daily chart, the pair closed the week below a daily channel support line taken from the low 0.7148, but simultaneously tagged in bids from around the above said weekly support hurdle. So while the close below the daily channel is a bearish signal, weekly support will have to be engulfed before we become sellers in this market.
H4 view: Going into the early hours of Friday’s London session, the Aussie aggressively tumbled lower. This brought price down to the above mentioned weekly support level, which allowed price to modestly recover into the week’s end. Since price topped out at 0.7759 on the 10th August, the market has been in the process of printing lower lows.
Direction for the week: Personally we feel a break beyond the current weekly support may be on the cards. Two back-to-back weekly selling wicks along with Friday’s daily close beyond the daily channel support line indicates a possible breach of the current weekly support line.
Direction for today: With price seen bouncing from the 0.76 boundary at the moment, we feel this is simply a move to fill the weekend gap. Ultimately, a H4 close below the 0.76 level is what we have our eye on, since there is little active demand seen to the left of current price beyond this number down to the H4 mid-way support 0.7550. The H4 tail marked with a green arrow represents what we like to call a demand consumption tail, which, as you can see, stabbed into a H4 demand area marked with a black arrow at 0.7568-0.7592. Furthermore, seeing as how the next higher-timeframe downside target does not come into view until the daily support area at 0.7517-0.7451, price could extend beyond 0.7550 to touch gloves with the 0.75 handle!
Our suggestions: Watch for a H4 close below 0.76 followed up by a retest and a lower timeframe sell signal, targeting 0.7550 and then 0.75. A lower timeframe sell signal, at least for us, is considered to be either an engulf of demand followed by a subsequent retest, a trendline break/retest or simply a collection of well-defined selling wicks around the 0.76 boundary.
Levels to watch/live orders:
- Buys: Flat (Stop loss: N/A).
- Sells: Watch for price to close below 0.76 and then look to trade any retest seen thereafter (lower timeframe confirmation required).
USD/JPY:
Weekly gain/loss: – 109 pips
Weekly closing price: 100.17
Weekly opening price: 100.77
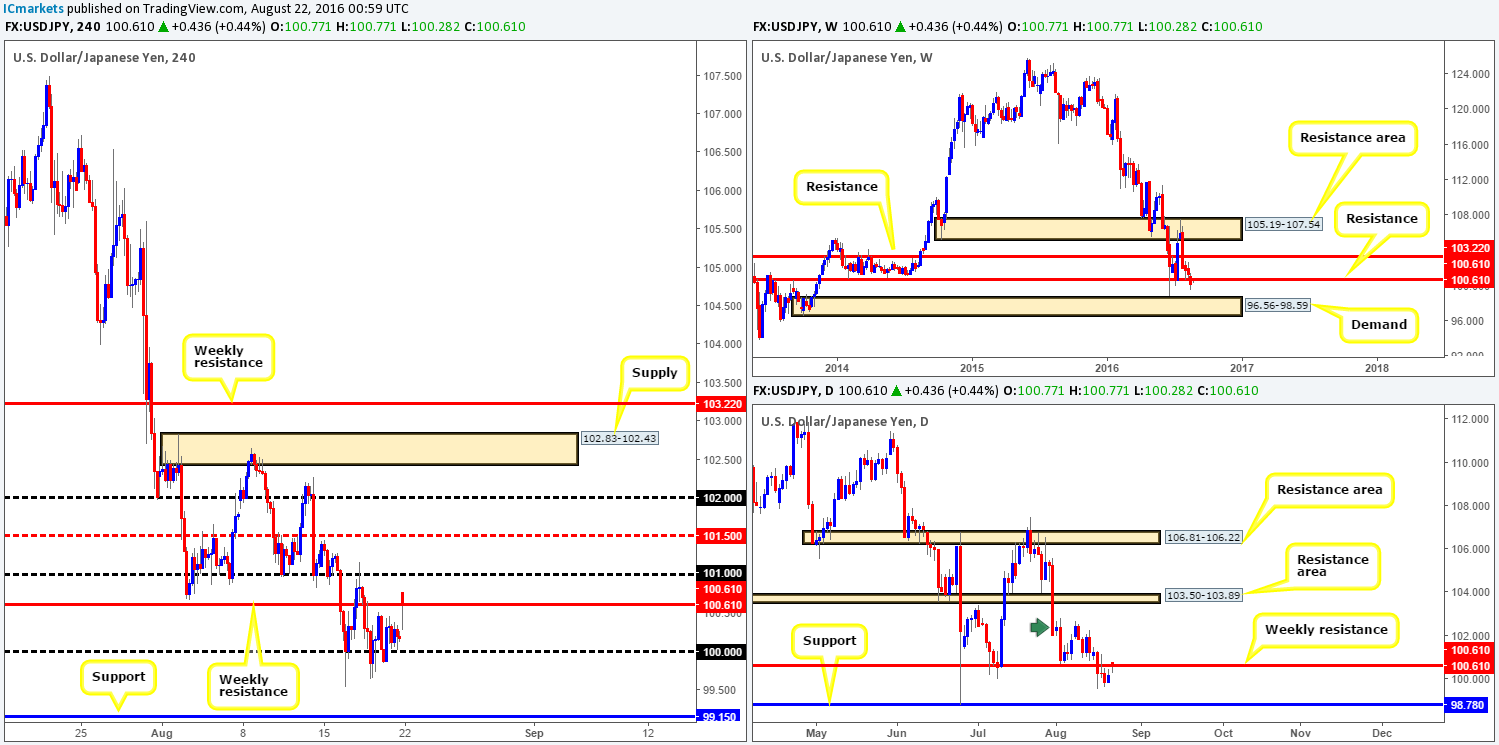
Weekly view: Weekly support at 100.61 (now acting resistance) was taken out last week, consequently chalking up a fourth consecutive close in the red. In the event that the sellers remain dominant here, there’s a chance that we may see price greet the weekly demand base seen at 96.56-98.59 sometime this week.
Daily view: While this morning’s 60-pip gap is evident on the daily chart, the above noted weekly resistance will likely hold this market lower. Should this assumption turn out to be correct, the next downside target to keep an eye on comes in at 98.78: a daily support level.
H4 view: Over the weekend, the BoJ governor Kuroda noted that there’s room for a further rate cut. This sparked a 60-pip yen sell off and by extension, boosted the USD. However, from a technical standpoint, we fail to see price extending beyond the 101 handle today.
Direction for the week: With the weekly chalking up its fourth consecutive close lower, and recently taking out a weekly support, further downside is possibly going to be seen this week down to at least daily support at 98.78.
Direction for today: Price will likely fill the weekend gap and consolidate around the 100 handle, due to a very light economic calendar today.
Our suggestions: As of now, our team sees very little opportunity on this pair. An ideal setup, however, would be to witness a decisive close below 100 along with a retest and a lower timeframe sell signal (see the top of this report). Despite this, we really do not see this coming into play today.
Levels to watch/live orders:
- Buys: Flat (Stop loss: N/A).
- Sells: Watch for price to close below the 100 handle and then look to trade any retest seen thereafter (lower timeframe confirmation required).
USD/CAD:
Weekly gain/loss: – 87 pips
Weekly closing price: 1.2861
Weekly opening price: 1.2894
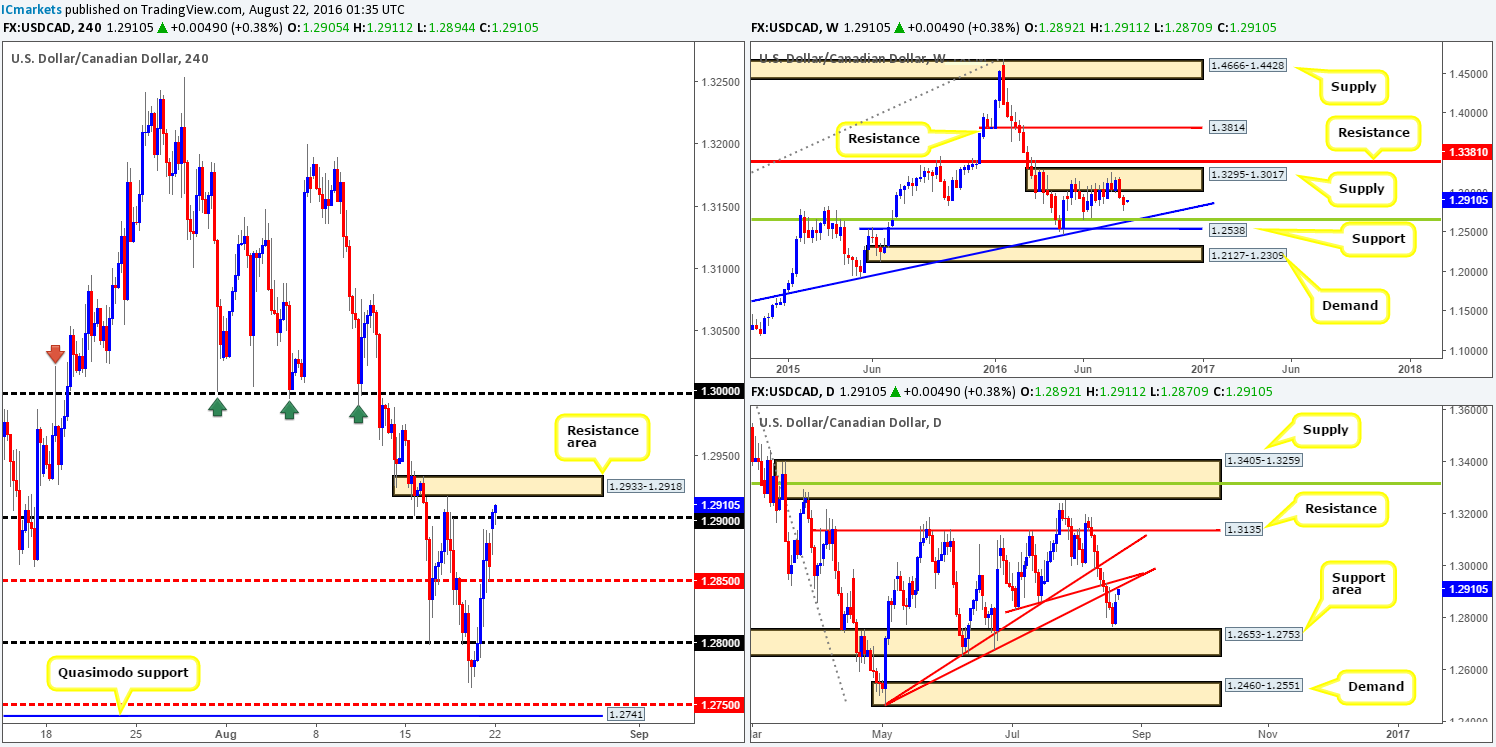
Weekly view: Recent weekly action shows that the USD/CAD extended its push south from weekly supply at 1.3295-1.3017 down to lows of 1.2763. This move, from our point of view, could possibly encourage further selling in this market this week and bring the pair down to a weekly trendline support extended from the high 1.1278 (intersects beautifully with a weekly Fib support line at 1.2649).
Daily view: From this angle, renewed buying interest came into the market on Friday just ahead of a daily support area coming in at 1.2653-1.2753. This, alongside this morning’s opening gap, has brought the unit up to within striking distance of two daily trendline resistances (1.2460/1.2831), which we believe will likely pressure the candles lower.
H4 view: Boosted by Friday’s poor Canadian CPI and retail sales data, the USD/CAD broke above the H4 mid-way resistance level 1.2850, but failed to reach the 1.29 handle before week’s end. Thanks to this morning’s gap higher, however, price is now seen flirting with 1.29.
Direction for the week: Pressure from the weekly supply area coupled with daily action trading in close proximity to two nearby daily trendline resistances, will likely encourage further selling this week.
Direction for today: Today’s direction is also likely to be south. Granted, price is now trading above the 1.29 handle which may tempt traders to buy, but do keep in mind that it was actually a combination of the 1.29 hurdle and a small H4 resistance area at 1.2933-1.2918 which sent prices lower last Wednesday. Therefore, this, coupled with the nearby daily trendlines resistances, will likely send this market back down to the 1.2850 region today and quite possibly beyond.
Our suggestions: Watch for confirmed (see the top of this report) lower timeframe sell entries around the H4 resistance area at 1.2933-1.2918 today, targeting 1.2850 as an initial take-profit zone.
Levels to watch/live orders
- Buys: Flat (Stop loss: N/A).
- Sells: 1.2933-1.2918 [Tentative – confirmation required] (Stop loss: dependent on where one confirms this area).
USD/CHF:
Weekly gain/loss: – 144 pips
Weekly closing price: 0.9600
Weekly opening price: 0.9613
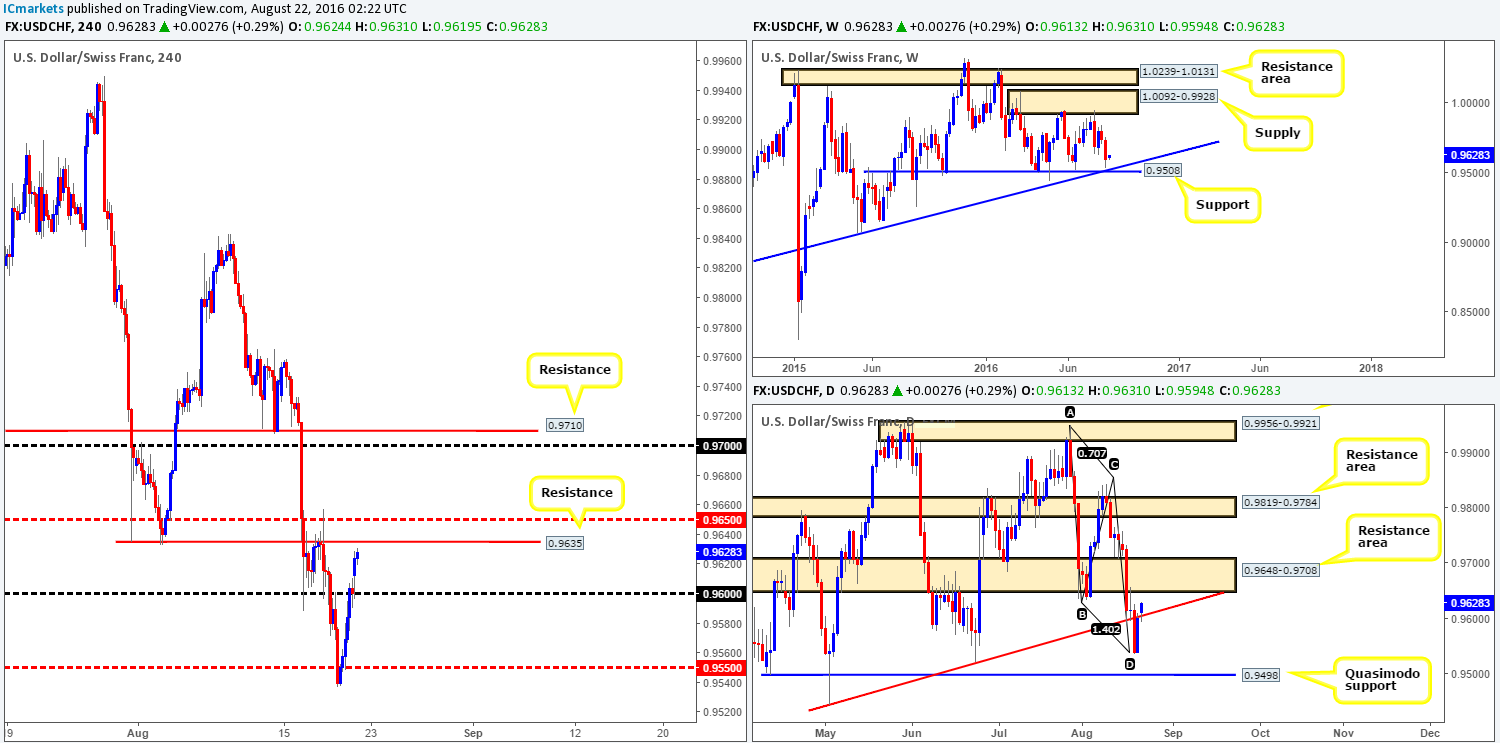
Weekly view: The Swissy was well-offered last week, consequently pulling price down to lows of 0.9537. As you can see, however, there was a small end-of-week correction seen just ahead of weekly support at 0.9508 which happens to fuse nicely with a weekly trendline support extended from the low 0.8703.
Daily view: Technically, the end-of-week correction was likely due to the completion of a daily bullish AB=CD pattern around the 0.9540ish range. Friday’s rebound from this area pushed prices back up to retest a daily trendline resistance extended from the low 0.9443, which has recently been breached and looks set to extend north up to the daily resistance area drawn from 0.9648-0.9708.
H4 view: Friday’s recovery saw prices end the week closing around the 0.96 handle. However, in consequence to this morning’s opening gap, the unit is now seen within touching distance of connecting with a H4 resistance at 0.9635 and the H4 mid-way resistance 0.9650.
Direction for the week: Seeing as how price came so very close to shaking hands with the above said weekly support level, further buying may be seen. Nevertheless, before this can happen, the daily resistance area mentioned above at 0.9648-0.9708 will have to be taken out.
Direction for today: This is very difficult to judge. We would like to think that price will respond bearishly to the 0.9650/0.9635 region on the H4 chart today, due to it being glued to the underside of the aforementioned daily resistance area. However, this is only a rough finger-in-the-wind assessment, since if weekly buyers have loaded up ahead of weekly support this H4 area along with the daily resistance zone will likely be wiped out.
Our suggestions: Keep an eye on the 0.9650/0.9635 region for potential shorting opportunities today, but remain aware that there is a healthy chance this area may fail. Therefore, we’d recommend waiting to see if lower timeframe price action confirms this zone (see the top of this report) before pulling the trigger.
Levels to watch/live orders:
- Buys: Flat (Stop loss: N/A).
- Sells: 0.9650/0.9635 [Tentative – confirmation required] (Stop loss: dependent on where one confirms this area).
GOLD:
Weekly gain/loss: + $4.9
Weekly closing price: 1339.9
Weekly opening price: 1339.9
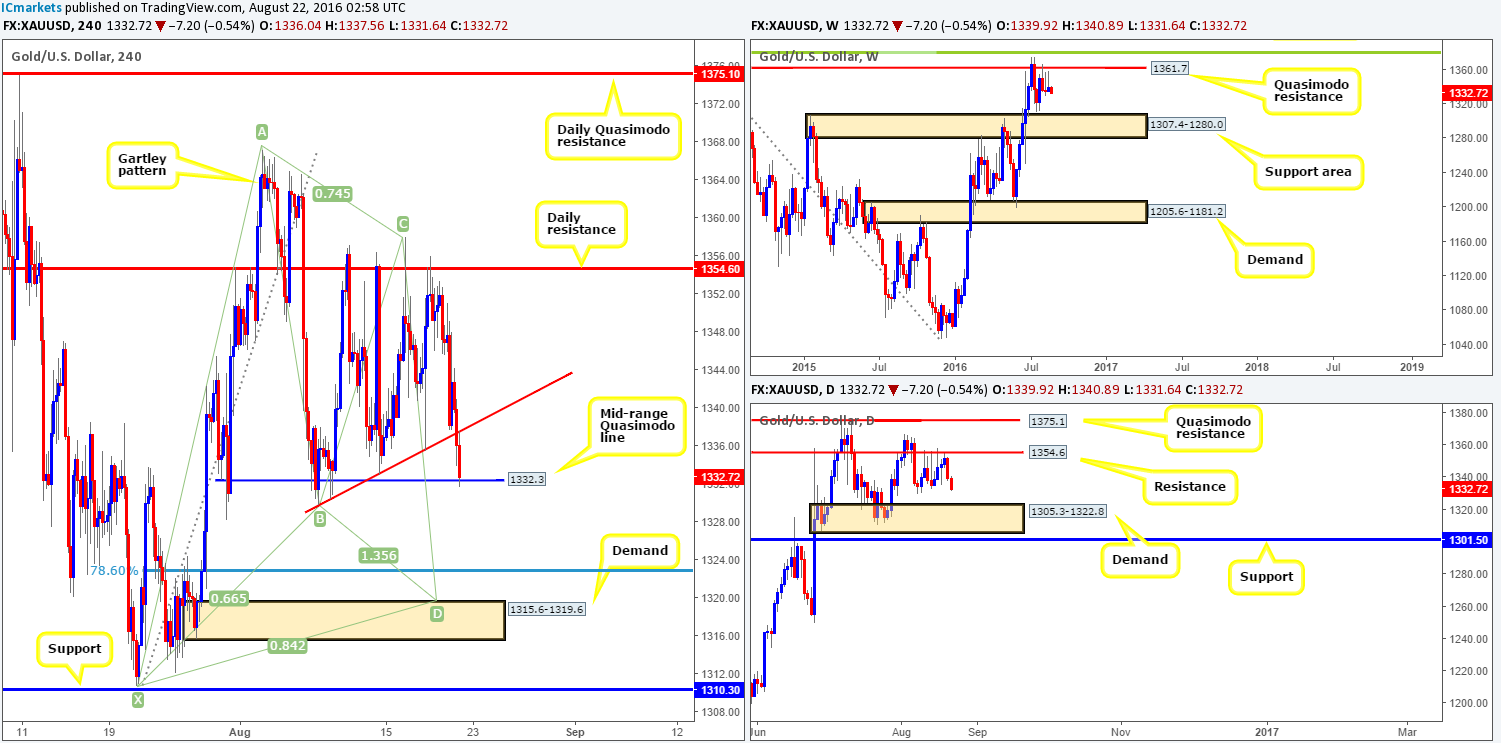
Weekly view: The previous week’s action saw the yellow metal print its second consecutive selling wick, just ahead of a weekly Quasimodo resistance level at 1361.7. While there is always a chance price may still yet spike up to touch gloves with the Quasimodo line, we feel the bears may make an appearance here this week and drag gold down to the weekly support area at 1307.4-1280.0.
Daily view: Following Thursday’s touch of the daily resistance at 1354.6, Friday’s action dove lower on the back of US dollar strength. In the event that the sellers continue to dominate this market, which it looks like they’re doing right now, it’s likely we’ll see price test the daily demand zone coming in at 1305.3-1322.8 (sits on top of the above said weekly support area).
H4 view: Over on the H4 chart, this morning’s selling has seen price cross swords with a H4 mid-range Quasimodo line at 1332.3. A break below here, potentially opens up the path south down to H4 demand at 1315.6-1319.6 (positioned within the above said daily demand).
Direction for the week: Initially, we feel the metal will continue to decline in value. Be that as it may, once/if price nudges into the above said daily demand zone, a correction is highly likely.
Direction for today: Much the same as the direction for the week, we feel price will dive lower and eventually touch base with the aforementioned H4 demand.
Our suggestions: Watch for a clean break below the current H4 mid-range Quasimodo line. Followed up with a retest to the underside of this level as well as a lower timeframe confirmed sell (see the top of this report), this is an ideal place to short from targeting the above said H4 demand.
Should price reach this H4 demand base, all of our short positions will be liquidated and we’ll then go about looking to possibly enter long at market (dependent on the approach and time of day) from this area. However, do be prepared for price to drive below this zone before buyers step in! The reason as to why is because along with the H4 demand and it’s supporting higher-timeframe demands (see above in bold), we also have a merging H4 harmonic Gartley reversal zone between the H4 Fib 78.6% support and the X point of the H4 harmonic pattern at 1310.7.
Levels to watch/live orders:
- Buys: 1315.6-1319.6 [Dependent on the approach and time of day a market long is possible] (Stop loss: below the X point of the H4 harmonic formation: 1309.1, which is, as you can see, set just beyond the H4 support at 1310.3).
- Sells: Watch for price to close below the H4 mid-range Quasimodo level at 1332.3 and then look to trade any retest seen thereafter (lower timeframe confirmation required).


