EUR/USD:
Weekly Gain/Loss: -1.23%
Weekly Close: 1.1602
Weekly perspective:
Fashioned in the shape of a clear-cut bearish engulfing formation out of a resistance area at 1.1717-1.1862, last week’s flow witnessed the single currency erode its entire upside move from the week prior. Assuming further selling takes place this week, traders could attempt a run towards demand drawn from 1.1312-1.1445.
Daily perspective:
Try as it might, EUR/USD bulls failed to muster enough strength to breach a notable resistance at 1.1802 in the early stages of last week. A strong near-full-bodied bearish close formed on Thursday, overthrowing support at 1.1723 (now acting resistance) and clearing the pathway south for Friday’s test of a support area penciled in at 1.1479-1.1583. It might be worth noting a break of this zone almost immediately places weekly traders within close proximity of its demand mentioned above at 1.1312-1.1445.
H4 perspective:
Influenced by the Italian government's decision to approve a 2.4% budget deficit, along with subdued EU macroeconomic data, Friday witnessed the euro print its third consecutive daily loss vs. its US counterpart. 1.16 suffered a brutal hit to the mid-section, tapping lows of 1.1570, though the candles managed to mildly recover amid US hours on the back of lower-than-expected US data (DXY pulled back from weekly highs of 95.37).
Areas of consideration:
With stop-loss orders absolutely annihilated around 1.16 on the H4 scale, the triple-bottom support located at 1.1530 may enter the fold this week. Newly formed H4 supply at 1.1651-1.1633 and its nearby resistance level at 1.1653 is also of interest this week, owing to its strong momentum produced from the base.
While weekly price supports a short from the noted H4 supply, daily action has unfortunately thrown up its red flag given the unit recently shook hands with a support area coming in at 1.1479-1.1583.
On account of the above, traders are urged to exercise caution around the noted H4 supply. Waiting for additional candlestick confirmation is certainly worth considering before pressing the sell button, as this will help determine seller intent. In the event this trade comes to fruition, downside targets fall in around 1.16, the top edge of daily support area at 1.1583 and then the H4 triple-bottom support located at 1.1530.
Today’s data points: German retail sales m/m; FOMC member Bostic speaks; US ISM manufacturing PMI.
GBP/USD:
Weekly Gain/Loss: -0.36%
Weekly Close: 1.3029
Weekly perspective:
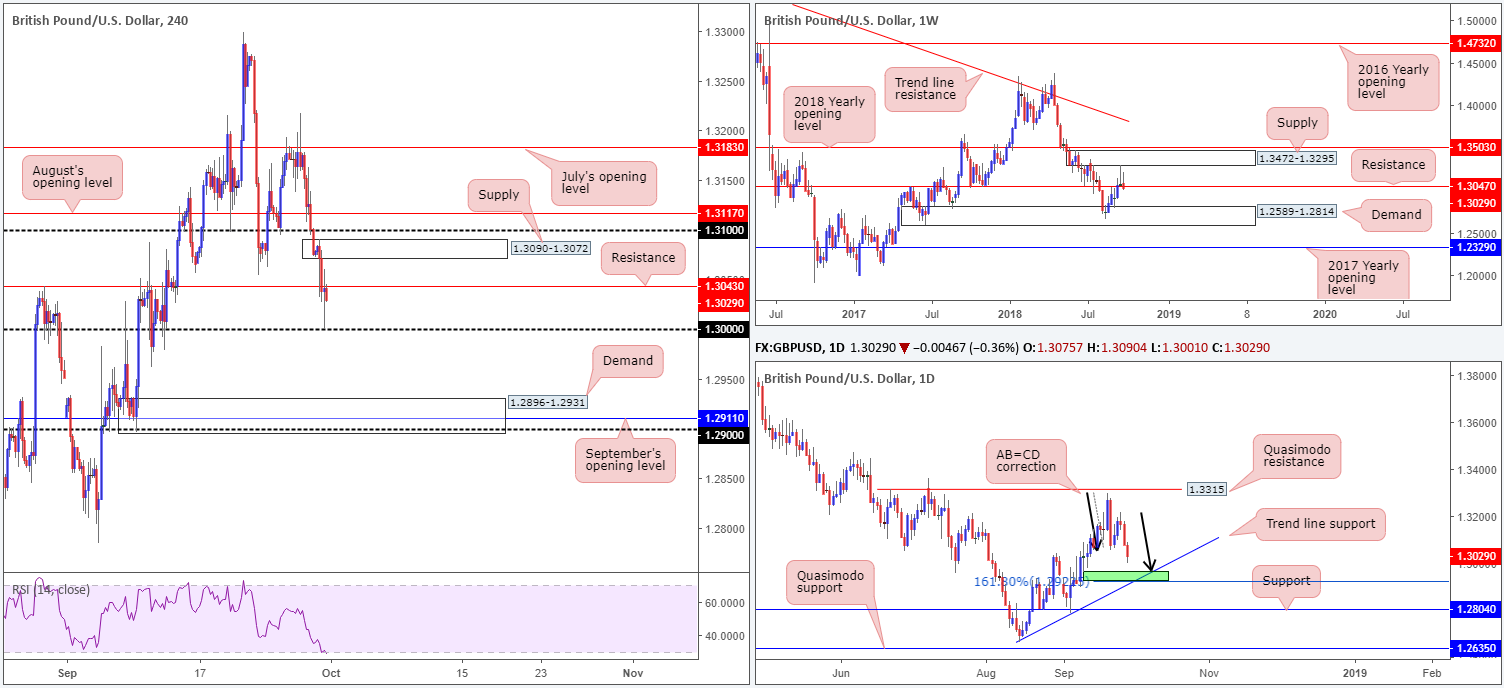
Leaving the underside of supply at 1.3472-1.3295 unchallenged, the pound concluded last week forming a bearish pin-bar pattern that marginally closed beneath support at 1.3047 (now acting resistance). This – coupled with a second-rate recovery from demand at 1.2589-1.2814 over the past month (indicating weakness from the buy-side of this market) – could see the unit retest the noted demand with force this week.
Daily perspective:
In terms of where we are on the daily timeframe, the candles are in the process of printing a rather nice-looking AB=CD bullish correction pattern (black arrows). Pattern completion, however, in our humble view, does not occur until we reach 1.2927 (green zone): its 161.8% Fib ext. point (also labelled an AB=CD alternate pattern). What’s also notable from a technical perspective is the trend line support seen intersecting with this region (taken from the low 1.2661).
H4 perspective:
Dovish BoE commentary, as well as lower-than-expected UK data, undermined the pound on Friday. Unfortunately, price failed to retest 1.31 before pressing lower (this was a noted resistance for shorts in Friday’s briefing), ripping through support at 1.3043 (now acting resistance) and challenging the key figure 1.30. Speculative interest emerged from 1.30 amid US hours (fuelled by soft US data), though the candles were unable to reclaim the recently lost support at 1.3043.
Areas of consideration:
Technically speaking, 1.30 appears fragile at the moment. Aside from 1.3043: the H4 resistance seen stationed nearby, we also have to take into account both weekly and daily flow suggests further downside may be in store.
With this in mind, two tradable scenarios are in the offing:
- Simply watch for 1.30 to be taken out. A H4 close beyond this number that’s followed up with a bearish candlestick formation would likely be enough evidence to suggest further selling towards H4 demand at 1.2896-1.2931. Stop-loss orders and entry are dictated by the candlestick structure selected.
- The H4 demand, aside from being a take-profit target for shorts, is also a zone worthy of longs. Not only does it house September’s opening level at 1.2911 and the 1.29 handle, it also converges with the daily AB=CD termination point marked in green at 1.2927. Collectively, this is likely enough confluence to produce a bounce, at the very least.
Today’s data points: UK manufacturing PMI; UK net lending to individuals m/m; FOMC member Bostic speaks; US ISM manufacturing PMI.
AUD/USD:
Weekly Gain/Loss: -0.86%
Weekly Close: 0.7222
Weekly perspective:
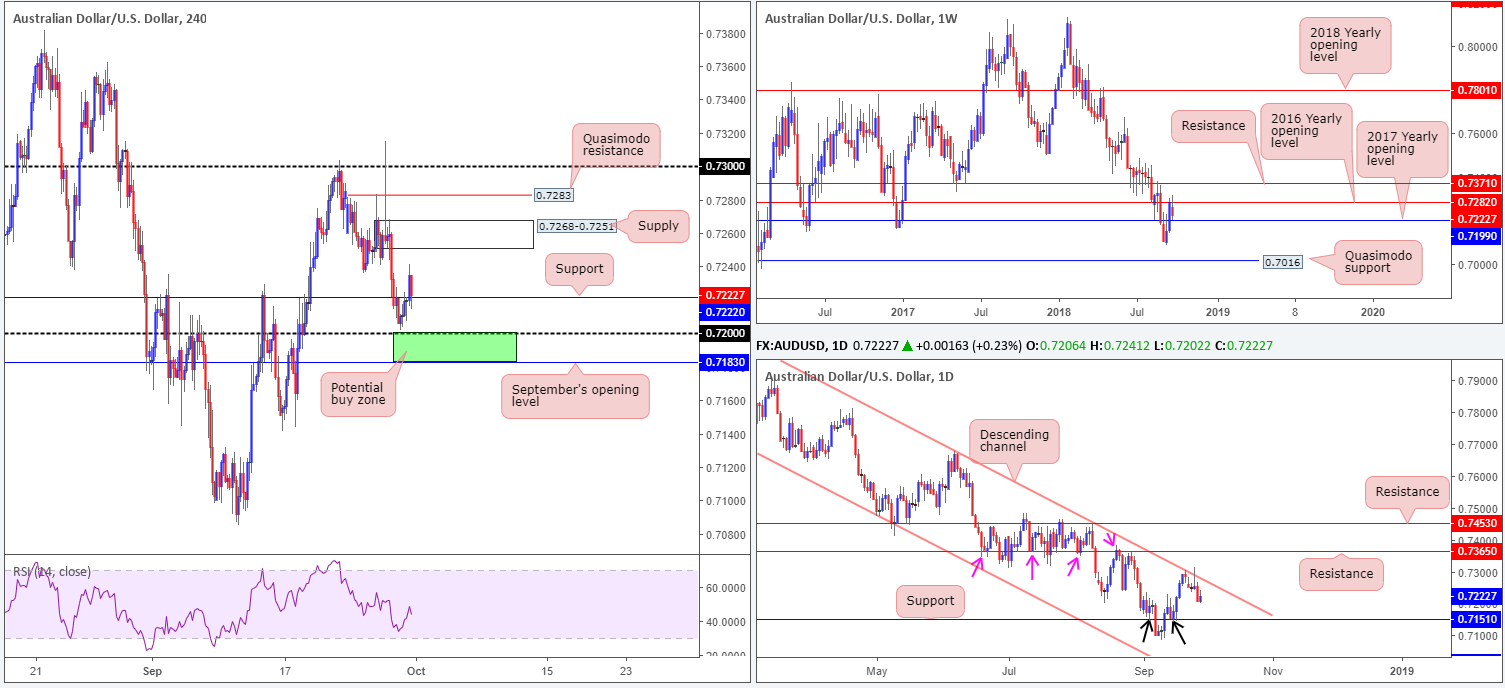
Despite encountering buyer interest around the 2016 yearly opening level at 0.7282 last week, the level remained firm as a resistance. As a result of this, price action came within striking distance of its 2017 yearly opening level placed at 0.7199. Should we get beyond this barrier this week, the September 10 lows of 0.7085 are in view, followed by Quasimodo support at 0.7016.
Daily perspective:
Fading a long-term channel resistance (penciled in from the high of 0.8135) in the shape of a bearish pin-bar formation on Wednesday, along with Thursday’s precipitous decline, communicates a bearish tone on this scale towards support at 0.7151.
H4 perspective:
As you can see, the H4 candles held a mildly positive tone on Friday. Leaving the 0.72 handle (also represents the 2017 yearly opening level at 07199 on the weekly timeframe) unchallenged, the pair reclaimed nearby resistance at 0.7222 and retested it as support into the closing bell. Overhead areas of interest can be seen at supply carved from 0.7268-0.7251, shadowed closely by a Quasimodo resistance level at 0.7283.
Areas of consideration:
Although daily price emphasizes a southerly tone right now, both H4 and weekly structure show support nearby. In fact, the team remains in favour of the 0.7183/0.72 (green area comprised of September’s opening level and the round number 0.72) H4 zone for longs. Conservative traders may wish to wait and see if H4 price can chalk up a bullish candlestick formation before pulling trigger from here, given the threat of further downside on the daily timeframe. The initial upside target from the buy zone falls in around 0.7222, followed by H4 supply at 0.7268-0.7251.
Today’s data points: FOMC member Bostic speaks; US ISM manufacturing PMI.
USD/JPY:
Weekly Gain/Loss: +1.00%
Weekly Close: 113.67
Weekly perspective:
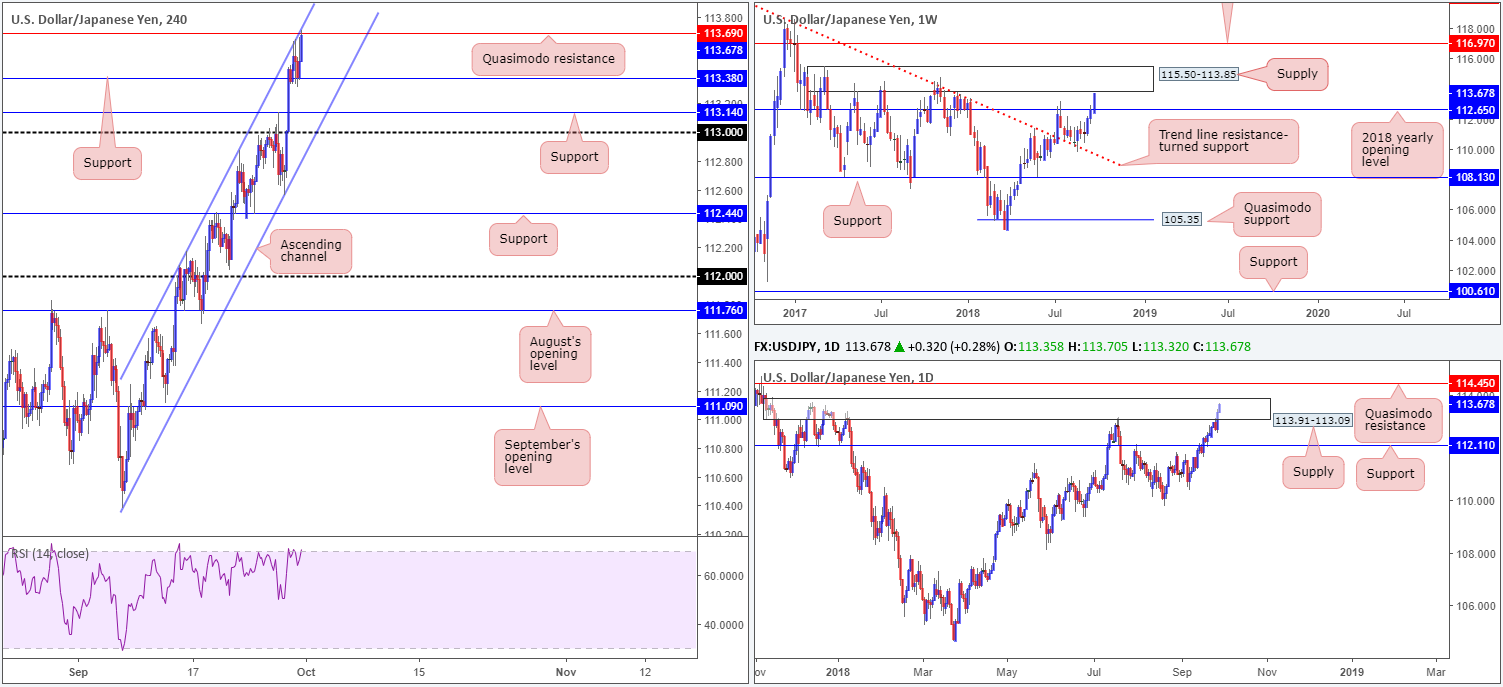
USD/JPY bulls were in fine form last week, successfully dethroning its 2018 yearly opening level at 112.65 and positioning the unit within close proximity to a notable supply at 115.50-113.85. Note this area boasts notable history, capping upside on a number occasions throughout 2017. Overlooking this zone, therefore, is not recommended!
Daily perspective:
Supply at 113.91-113.09 lacks willing sellers at the moment, recently forming two back-to-back near-full-bodied bullish candles within its walls. Despite being fastened to the underside of the aforementioned weekly supply zone, a break of this area is a possibility this week, targeting Quasimodo resistance at 114.50 (firmly fixed within the walls of the noted weekly supply).
H4 perspective:
After successfully retesting resistance-turned support at 113.38 amid European hours on Friday, the pair gathered momentum in the second half of the day as us equities pared earlier losses. Ending the week recording its highest weekly close of the year, the USD/JPY managed to shake hands with a Quasimodo resistance at 113.69 that happens to merge with a steep channel resistance (etched from the high 112.06).
Areas of consideration:
Knowing weekly price is likely headed for a test of 113.85 this week: the lower edge of its supply zone, a fakeout of the current H4 Quasimodo resistance, despite holding confluence from a H4 channel resistance, should be expected.
Should the H4 candles head higher to test the weekly supply and swiftly close back beneath the aforementioned H4 Quasimodo resistance, this would be considered a bearish indicator, in our humble view (ultimately we would not want to see the top edge of daily supply at 113.91 challenged here). Not only would stop-loss orders be taken from above the Quasimodo (offering liquidity to sell), weekly sellers should begin making an appearance. H4 support at 113.38 is considered an initial take-profit target, followed by H4 support at 113.14.
Today’s data points: FOMC member Bostic speaks; US ISM manufacturing PMI.
USD/CAD:
Weekly Gain/Loss: -0.03%
Weekly Close: 1.2907
Weekly perspective:
In spite of ranging nearly 200 pips last week, the USD/CAD concluded the session virtually unchanged.
Although the unit closed the week out by way of a clear-cut bearish pin-bar formation, price is seen within close proximity to a trend line resistance-turned support (extended from the high 1.4689). This barrier supported this market once already back in late August, so there’s a chance we may see history repeat itself.
Daily perspective:
Since late June (apart from the time price wandered out of range in early September for a week or so) the pair has been compressed within a descending channel formation (1.3386/1.3066). Of late, the market observed a precipitous decline take place from the upper edge of this channel, placing the candles just north of a support level coming in at 1.2887.
H4 perspective:
A quick recap of Friday’s movement on the H4 scale shows the USD/CAD fell sharply following better-than-expected Canadian GDP data. The move was later exacerbated amid US hours on the back of a rally in crude oil prices.
The key figure 1.30 put up little fight as support (if you drill down to the M5 timeframe you’ll actually see price retested this number as resistance after its break), as did nearby demand at 1.2945-1.2959 (acting resistance area). As you can see, the day wrapped up closing just north of its 1.29 handle in the form of a near-full-bodied bearish candle.
Areas of consideration:
For folks thinking of fading 1.29 on the H4 timeframe today, do bear in mind price action could potentially fake beneath this number to bring in buyers from daily support at 1.2887. A H4 bullish pin-bar pattern formed here that pierces 1.29 and tests 1.2887 would, technically speaking, likely be enough to draw in buyers at least until we reach the H4 resistance area at 1.2945-1.2959. By that point, the H4 RSI indicator would also be displaying an oversold reading, too.
As for entry and stop-loss placement, traders are urged to use the pin-bar formation to dictate these parameters.
Today’s data points: FOMC member Bostic speaks; US ISM manufacturing PMI; CAD Gov. Council Member Lane speaks.
USD/CHF:
Weekly Gain/Loss: +2.46%
Weekly Close: 0.9816
Weekly perspective:
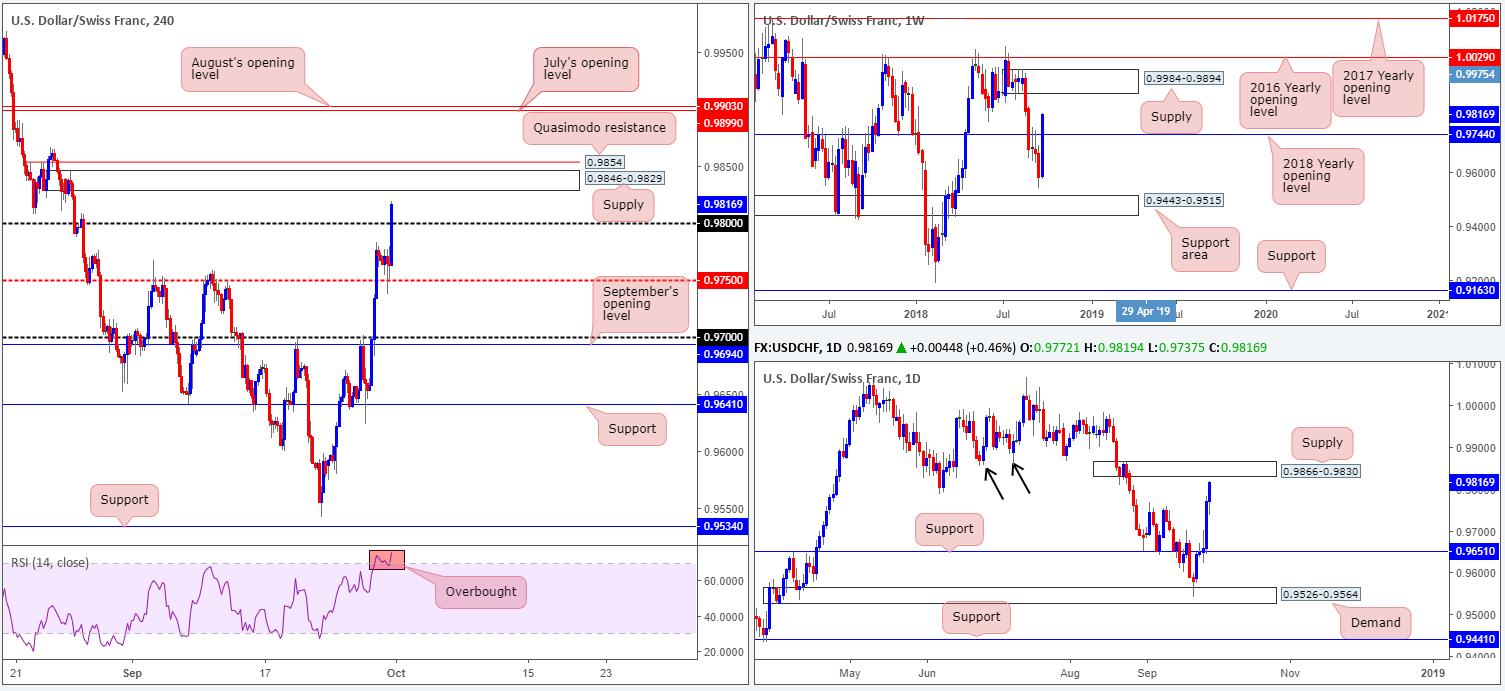
The USD/CHF, in the shape of a full-bodied bullish candle, soared to highs not seen since late August last week. Managing to overthrow its 2018 yearly opening level at 0.9744, the pair is in a healthy position to continue north this week and test a notable supply zone priced in at 0.9984-0.9894.
Daily perspective:
Before reaching the aforesaid weekly supply, however, daily buyers need to contend with a potentially hard-wearing supply zone at 0.9866-0.9830. Aside from this area delivering solid downside momentum from its base, it was effectively the decision point to break through support marked with two black arrows around the 0.9855 neighbourhood. For this reason, the area commands attention!
H4 perspective:
Intraday flow struggled to maintain its bullish presence amid Asia/London trade on Friday, dipping beneath 0.9750 to lows of 0.9737. At the closing stages of the week, though, broad-based USD buying kept the USD on the winning side of the table against the Swiss franc, closing out firmly above its 0.98 handle.
Overhead, traders might want to pencil in the supply zone seen nearby at 0.9846-0.9829, tailed closely by a Quasimodo resistance level at 0.9854. Both barriers carry equal weight, as both are sited within the confines of daily supply mentioned above at 0.9866-0.9830.
Areas of consideration:
While we would agree weekly price portends further upside in this market this week, the combination of daily and H4 supply is likely to hinder buying. With that being the case, traders are urged to keep eyeballs on the H4 Quasimodo resistance level at 0.9854 for possible shorts this week.
Why not the H4 supply seen below it at 0.9846-0.9829? Of course, this area equally has the potential to hold price action lower, though we’re selecting the level that offers the best bang for our buck. Shorting from the noted Quasimodo resistance level not only allows traders to position stops above the current daily supply, it also brings in stops taken from above the H4 supply to sell into (stops taken from sellers are automatically buy orders).
A move from 0.9854 to 0.98 offers incredible risk/reward conditions, nearly 4 times the position risk, assuming one places the stop two pips above the daily supply at 0.9868.
Today’s data points: FOMC member Bostic speaks; US ISM manufacturing PMI.
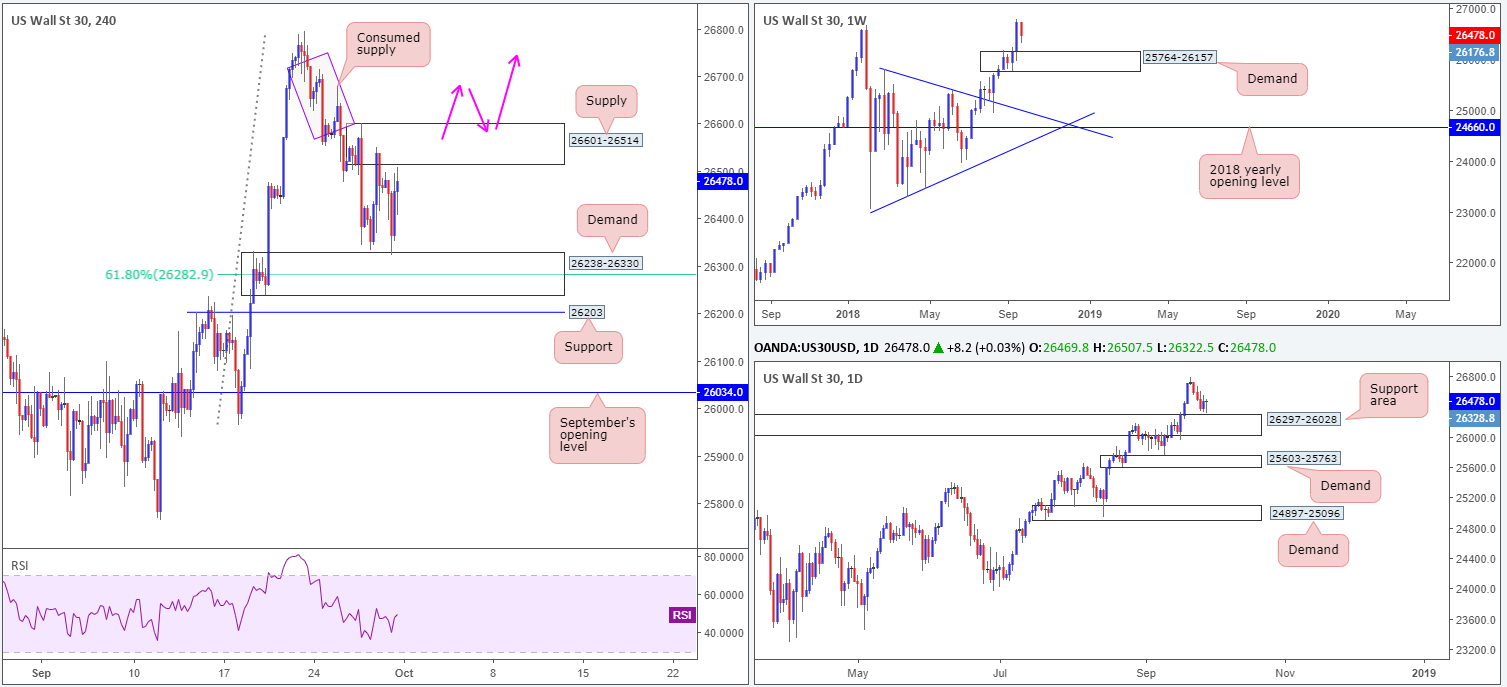
Dow Jones Industrial Average:
Weekly Gain/Loss: -0.91%
Weekly Close: 26478
Weekly perspective:
US equities struggled to sustain its bullish position over the course of last week, falling from record peaks of 26790. As is evident from this timeframe, the index could potentially pullback as far south as demand printed at 25764-26157 before we witness buyers re-enter the fray.
Daily perspective:
A closer look at price action on the daily timeframe brings a support area drawn from 26297-26028 into the picture. Although this area has yet to be officially tested, price action chalked up a strong bottoming signal from just north of this zone on Friday in the frame of a bullish pin-bar formation.
H4 perspective:
Friday’s movement on the H4 scale observed a beautiful to-the-pip test off of demand at 26238-26330 (merges with a 61.8% H4 Fib support at 26282) as we crossed London’s lunchtime hour, and rotated back to the upside towards supply at 26601-26514.
For folks who read Friday’s morning briefing you may recall the team highlighted the aforementioned demand zone as a budding area for longs. Our technical studies showed aside from the H4 demand housing a Fibonacci support level, the area is also positioned around the top edge of a daily support area marked at 26297-26028, which itself is reinforced by a weekly demand area visible from 25764-26157.
Well done to any of our readers who managed to jump aboard this move.
Areas of consideration:
For those who are long this market right now, the expectation is for a break of the current H4 supply. Stop-loss orders should ideally reside at breakeven by now, in the event price reverses and retests the aforementioned H4 demand.
Should the market drive beyond the H4 supply zone, we do not see much in the way of active supply stopping the unit from advancing to test record highs. For that reason, longs on any retest seen at 26601-26514 is also something to keep an eye on this week (pink arrows), both for traders who missed the initial buy from demand, and those who wish to pyramid their current long position.
Today’s data points: FOMC member Bostic speaks; US ISM manufacturing PMI.
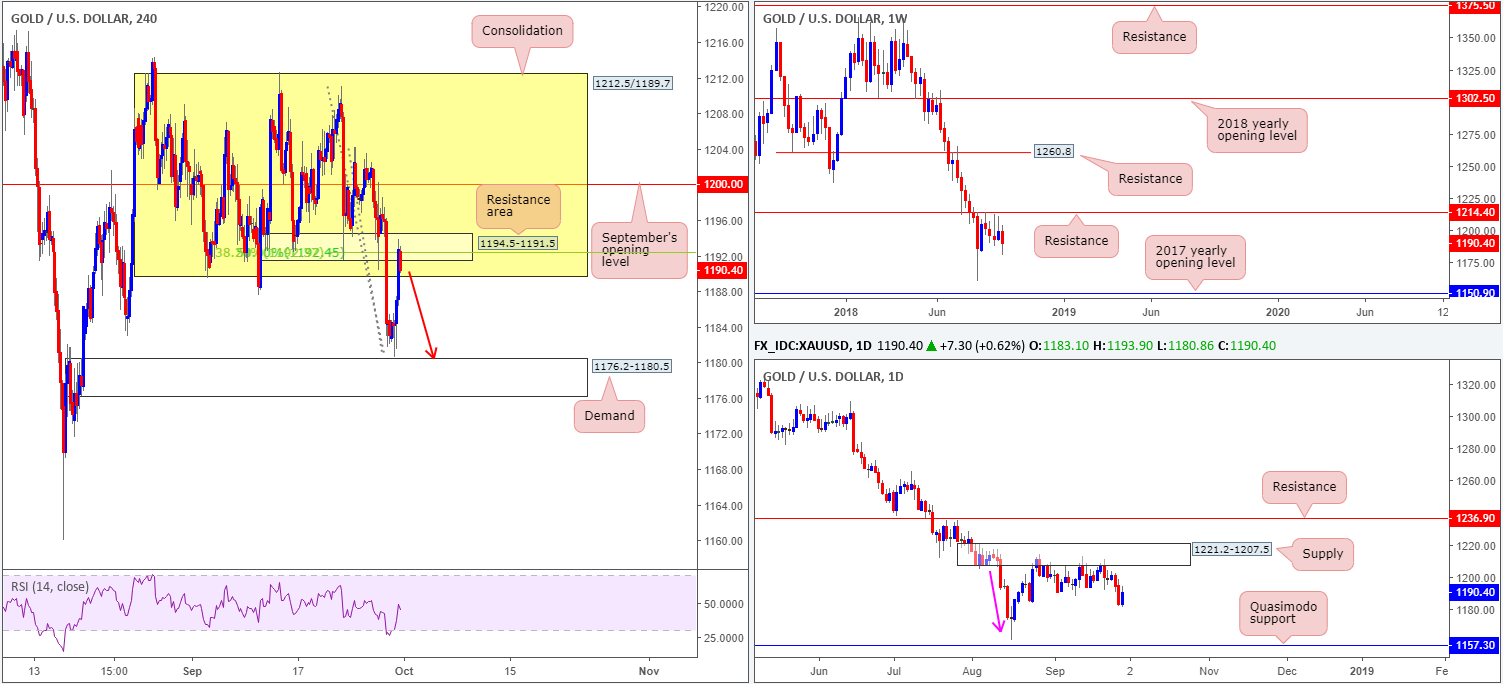
XAU/USD (Gold)
Weekly Gain/Loss: -0.77%
Weekly Close: 1190.4
Weekly perspective:
Gold, as you can see on the weekly timeframe, remains languishing beneath a key resistance level coming in at 1214.4. Following the formation of back-to-back bearish pin-bar patterns, the yellow metal clocked lows of 1180.8 last week. Further downside from this point could eventually stretch as far south as the 2017 yearly opening level at 1150.9.
Daily perspective:
In conjunction with weekly flow, daily movement made good ground beneath a nice-looking supply zone at 1221.2-1207.5 last week. Aside from the base displaying attractive downside momentum (pink arrow), this area could also be considered the ‘decision point’ to print 2018 yearly lows of 1160.3. From current price, structure shows room to press as low as a Quasimodo support at 1157.3.
H4 perspective:
Leaving demand at 1176.2-1180.5 unchallenged by a couple of pips, bullion rose to highs of 1193.9 on Friday. While price action effectively re-entered its consolidation zone between 1212.5/1189.7, shorting opportunities are still on the table, according to our studies. Not only are we seen trading around the lower edge of a notable H4 range, H4 action concluded Friday’s session in the shape of a near-full-bodied bearish candle out of a small resistance zone at 1194.5-1191.5. It may also be worth noting a Fibonacci resistance cluster is seen sited around 1192.4.
Areas of consideration:
Entering short at current price is certainly an option, with stop-loss orders positioned above the current H4 resistance area and an initial take-profit target set at the noted H4 demand zone. Should the trade come to fruition and the first target be achieved, traders are then urged to switch over to the higher timeframes and attempt to hold a portion of the position for a possible run towards the daily Quasimodo support mentioned above at 1157.3.
The use of the site is agreement that the site is for informational and educational purposes only and does not constitute advice in any form in the furtherance of any trade or trading decisions.
The accuracy, completeness and timeliness of the information contained on this site cannot be guaranteed. IC Markets does not warranty, guarantee or make any representations, or assume any liability with regard to financial results based on the use of the information in the site.
News, views, opinions, recommendations and other information obtained from sources outside of www.icmarkets.com.au, used in this site are believed to be reliable, but we cannot guarantee their accuracy or completeness. All such information is subject to change at any time without notice. IC Markets assumes no responsibility for the content of any linked site. The fact that such links may exist does not indicate approval or endorsement of any material contained on any linked site.
IC Markets is not liable for any harm caused by the transmission, through accessing the services or information on this site, of a computer virus, or other computer code or programming device that might be used to access, delete, damage, disable, disrupt or otherwise impede in any manner, the operation of the site or of any user’s software, hardware, data or property.

