
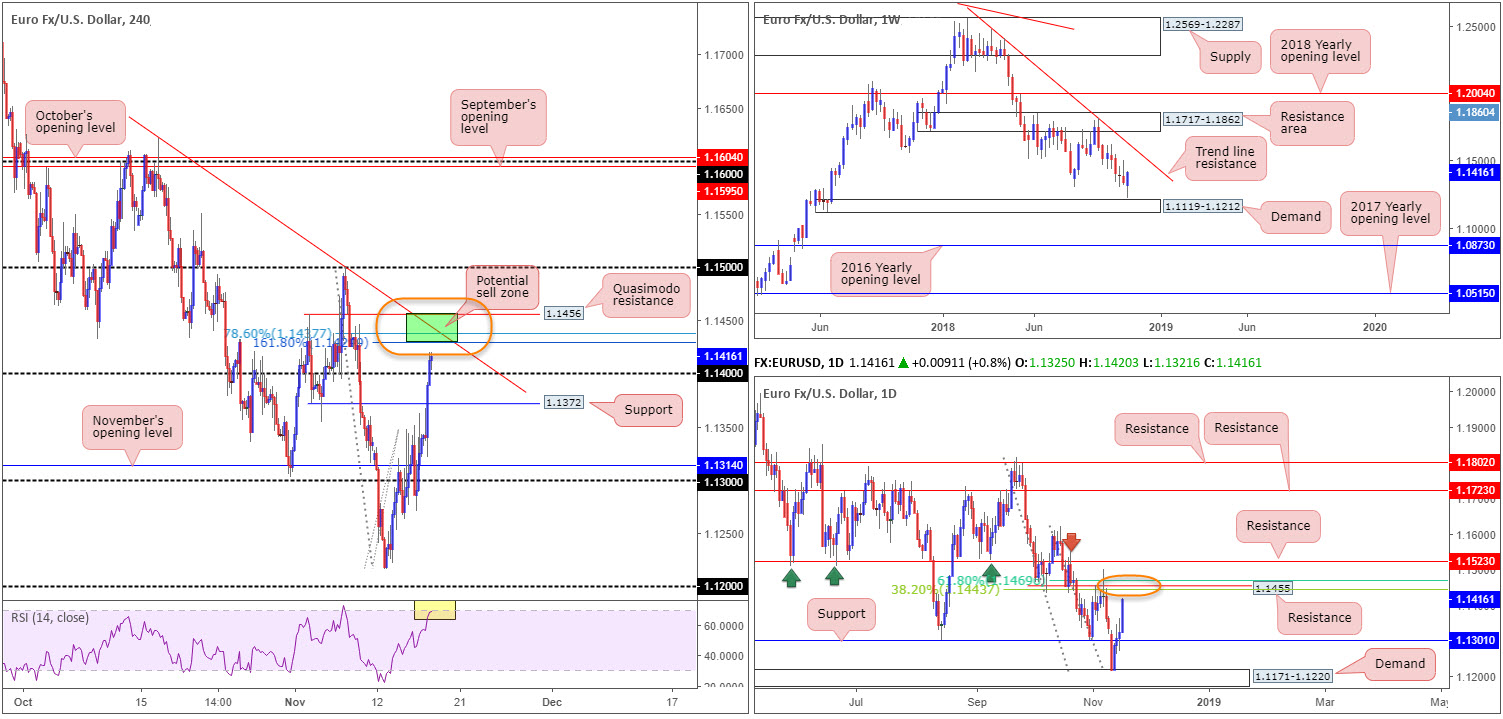
EUR/USD:
Weekly Gain/Loss: +0.85%
Weekly Close: 1.1416
Weekly perspective:
A stronger-than-expected rebound developed just north of demand at 1.1119-1.1212 last week, consequently breaking a four-week bearish phase. Continued buying from this point could eventually lift the unit towards trend line resistance (etched from the high 1.2476), trailed closely by a resistance area at 1.1717-1.1862.
Daily perspective:
Demand at 1.1171-1.1220, as you can see, elbowed its way into the spotlight Tuesday. The following day witnessed price overpower nearby resistance at 1.1301 (now acting support), which ultimately led to a continuation move north into the week’s close. Overhead, local resistance is positioned at 1.1455, which dovetails nicely with two Fib resistances: 38.2%/61.8% at 1.1443 and 1.1469, respectively. Beyond here, an additional layer of resistance rests at 1.1523.
H4 perspective:
Underpinned by broad-based USD selling, the EUR/USD recorded strong gains Friday, up 0.80%. The catalyst behind the move largely stemmed from comments made by US President Trump, stating China wants to make a deal on trade. In addition to this, some cautious remarks about contagion from slower global growth via Fed’s Clarida and Kaplan also weighed on the greenback.
At the closing stages of Friday’s trade, the H4 candles overthrew the 1.14 handle and closed within striking distance of a rather interesting area of resistance marked in green between 1.1456/1.1430. Comprised of a Quasimodo resistance at 1.1456, a 78.6% Fib resistance at 1.1437, a trend line resistance (etched from the high 1.1621), a 161.8% Fib ext. point at 1.1430, as well as the RSI indicator displaying an overbought reading, this zone cautions against an overly exuberant bullish approach today/early week. Another supporting factor to bear in mind is the daily resistance mentioned above at 1.1455 (and its nearby Fibonacci values) converges nicely with the upper edge of the H4 base.
Areas of consideration:
Although the EUR/USD ended the week in positive territory, traders are likely looking to fade this momentum from the H4 resistance area highlighted above at 1.1456/1.1430. As the first area of concern (support) rests nearby at 1.14, traders are urged to look for selling opportunities within the upper limit of the aforementioned H4 resistance zone, therefore keeping risk/reward parameters in check.
Conservative traders may opt to wait and see how H4 price action behaves before pulling the trigger. A bearish candlestick formation would help confirm seller interest, and also provide entry/stop parameters. Aggressive traders, on the other hand, may have eyes on 1.1444ish with stop-loss orders planted a few pips beyond 1.1469 (the 61.8% daily Fib resistance).
Today’s data points: Limited.
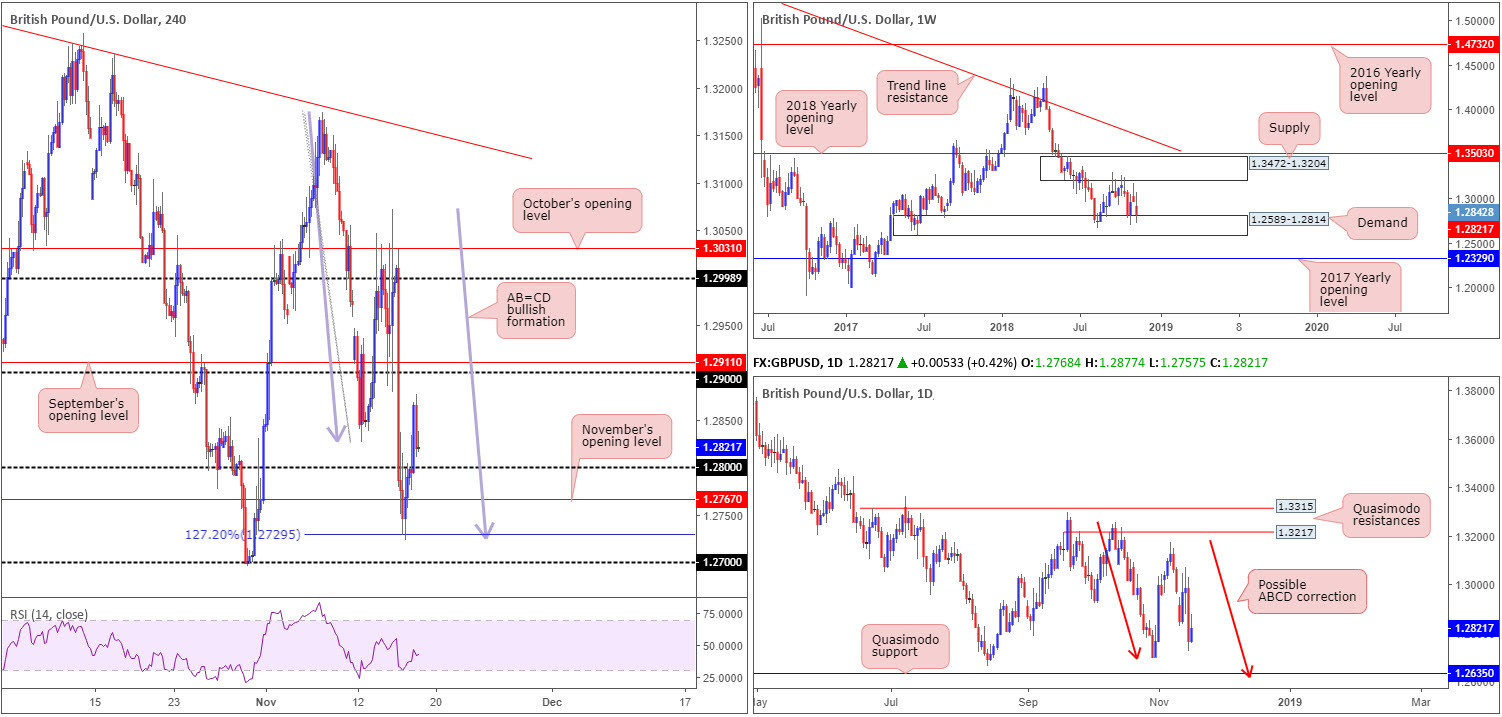
GBP/USD:
Weekly Gain/Loss: -0.72%
Weekly Close: 1.2821
Weekly perspective:
Despite ranging 350 pips on the week amid UK political tensions, the pair remained limited to a consolidation carved from demand at 1.2589-1.2814 and a supply drawn from 1.3472-1.3204. Outside of this border, notable areas fall in at the 2018/2017 yearly opening levels drawn from 1.3503 and 1.2329, respectively.
Daily perspective:
A closer look at price action on the daily timeframe, nevertheless, shows the unit positioned within close proximity to the 1.2695 Oct 30 low. While a response from this neighbourhood is possible, the Quasimodo support seen at 1.2635 also remains an appealing level, given the amount of stop-loss orders likely positioned beneath the said low and the 1.2661 Aug 15 low (taking out these stops provide liquidity for pro money to buy), along with a possible ABCD approach (red arrows) terminating just south at 1.2614.
H4 perspective:
Following Thursday’s precipitous decline, some much needed respite for sterling was observed Friday after the unit extended gains off an AB=CD (blue arrows) 127.2% Fib ext. point at 1.2729. Buyers regained more of a dominant position following news the UK Environment Secretary Michael Gove and Trade minister Liam Fox extended support to the UK Prime Minister. Despite this, politicians, officials and diplomats openly questioned how long May had left as speculation that a leadership challenge could take place soon.
From a technical perspective, H4 action reclaimed 1.28 to the upside in early London hours, reaching a session high of 1.2877. In spite of this, the day ended with a close just north of 1.28. A retest of this number today has a reasonably clear run towards 1.29/September’s opening level at 1.2911. A violation of 1.28, nonetheless, pulls November’s opening level at 1.2767 immediately back into the limelight.
Areas of consideration:
In essence we have the weekly timeframe suggesting a move higher, the daily timeframe showing signs it may want to explore lower ground until reaching 1.2635ish and H4 price poised to retest its 1.28 handle as support.
Longer term, longs from the daily Quasimodo support mentioned above at 1.2635 are appealing. Not only is the level sited within the walls of weekly demand at 1.2589-1.2814, the approach is likely to take shape in the form of a daily ABCD bullish pattern (1.2614ish).
Shorter term, however, it’s a tricky read at the moment. Although many traders will be eyeing 1.28 as a possible support to trade, a fakeout beyond this number to November’s opening level at 1.2767 is also a strong possibility. This – coupled with the current political situation in the UK – makes trading intraday moves challenging at the moment.
Today’s data points: Limited.
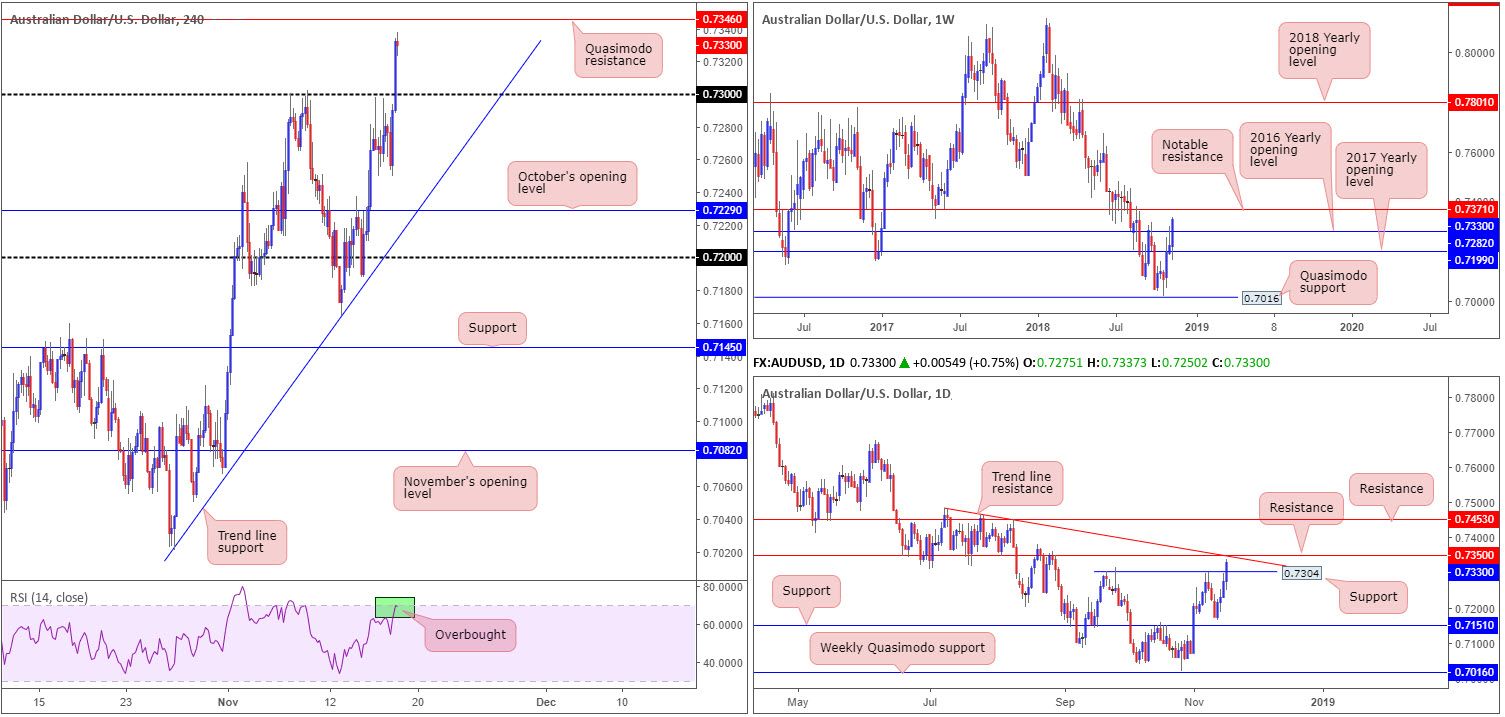
AUD/USD:
Weekly Gain/Loss: +1.54%
Weekly Close: 0.7330
Weekly perspective:
The Australian dollar rallied strongly against its US counterpart last week, consequently shipping price action above its 2016 yearly opening level at 0.7282 and settling just south of notable resistance priced in at 0.7371. This resistance has served as a critical level in this market for a number of years, and therefore may hinder further upside this week.
Daily perspective:
Closer analysis shows resistance plotted at 0.7350 as the next upside hurdle on the daily scale, which happens to unite with a trend line resistance (extended from the high 0.7483). Although a reaction from here is likely, it is worth noting active buyers may reside close by at 0.7304: a resistance-turned support level. In the event the market pushes for higher ground this week, traders’ crosshairs will likely be fixed at another layer of resistance drawn from 0.7453.
H4 perspective:
A brief sketch of Friday’s movement on the H4 timeframe reveals the commodity currency witnessed a resurgence of bidding in US hours. The US dollar index, which started the day a little above its 97 handle, lost traction on comments made by US President Trump, along with some cautious remarks about contagion from slower global growth via Fed’s Clarida and Kaplan. A waning buck provided the AUD/USD impetus to overthrow its 0.73 handle, leaving the path free for a potential approach towards a Quasimodo resistance level at 0.7346.
Areas of consideration:
On account of the above, a short from the H4 Quasimodo resistance level at 0.7346 is an option today/early week. What’s appealing about this level is the fact it converges closely with daily resistance at 0.7350 and its associated trend line resistance. Note we also have the weekly resistance plotted just twenty pips above here at 0.7371, and the H4 RSI indicator displaying an overbought reading.
Aggressive traders likely have eyes on 0.7350 for a short with stop-loss orders planted a few pips beyond weekly resistance at 0.7371. Conservative traders, on the other hand, may opt to wait and see how H4 price action behaves before pulling the trigger. A bearish candlestick formation would help confirm seller interest, and also provide entry/stop parameters thus possibly offering better risk/reward should the unit test weekly resistance.
In terms of take-profit targets from the 0.7350 region, the 0.73 handle appears a logical starting point owing to daily support also merging with this level at 0.7304.
Today’s data points: Limited.
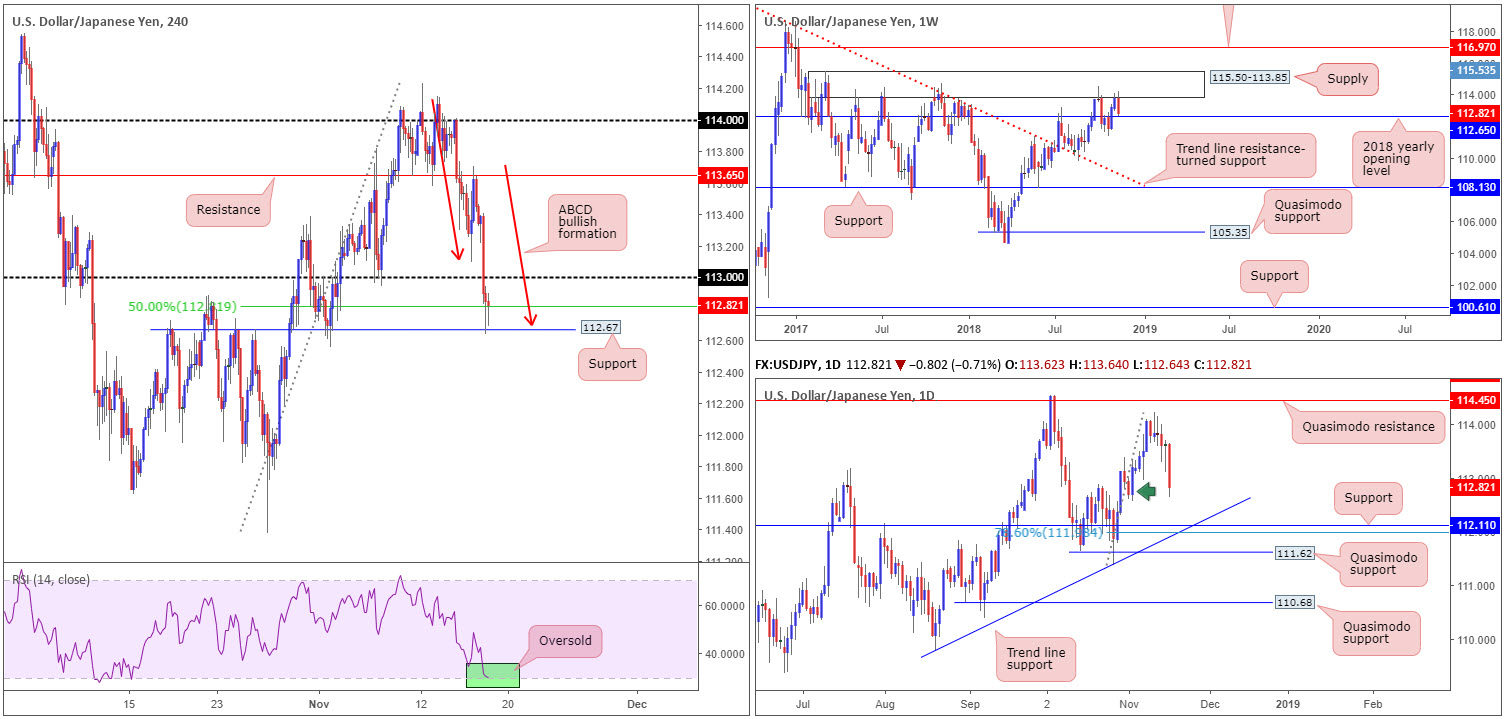
USD/JPY:
Weekly Gain/Loss: -0.84%
Weekly Close: 112.82
Weekly perspective:
After shaking hands with the underside of a major supply zone at 115.50-113.85 last week, the USD/JPY pressed lower and tested the 2018 yearly opening level at 112.65. Traders may also want to acknowledge recent movement printed a bearish engulfing candle. This – coupled with the supply area having capped upside since May of 2017 – could see the pair attempt to overthrow 112.65 this week.
Daily perspective:
Supporting the possibility of further selling this week, daily price shows room to potentially challenge support priced in at 112.11, followed closely by a Quasimodo support at 111.62. Note 112.11 also fuses with a trend line support (extended from the low 109.77) and a 78.6% Fib support at 111.98.
Why would the current demand area marked with a green arrow at 112.56-113.00 not hold price action higher, though? While the demand area could still hold firm, it has already been tested on November 7 at 112.94, and therefore might be weak.
H4 perspective:
For those who read Friday’s briefing you may recall the piece highlighted a potential retest play off H4 resistance at 113.65, having seen weekly price engage with supply mentioned above at 115.50-113.85. Well done to any of our readers who managed to take advantage of this move!
On the back of broad-based USD selling, thanks to comments from Trump as well as Fed’s Clarida and Kaplan, the pair concluded the day testing a 50.0% support value at 112.82 and familiar support derived from 112.67. It may also be worth noting the H4 candles formed a nice-looking ABCD bullish formation (red arrows) on approach and the RSI indicator is currently seen toying with its oversold value.
Areas of consideration:
After analyzing all three timeframes, our technical studies show the pendulum appears to be marginally swinging in favour of a bounce higher today/early week. The combination of the 2018 yearly opening level on the weekly timeframe at 112.65, the current daily demand (albeit a slightly weakened zone) and the collection of H4 supports in play is likely enough to pull the unit above 113.
To be on the safe side, however, traders may want to consider waiting and seeing if H4 price consumes 113. This should be enough to prove buyer intent. A H4 close above this number, followed up with a retest (preferably in the form of a bullish candlestick pattern – provides entry/stop parameters) is potentially sufficient enough to draw in buyers to target H4 resistance at 113.65, shadowed closely by the underside of weekly supply at 113.85.
Today’s data points: Limited.
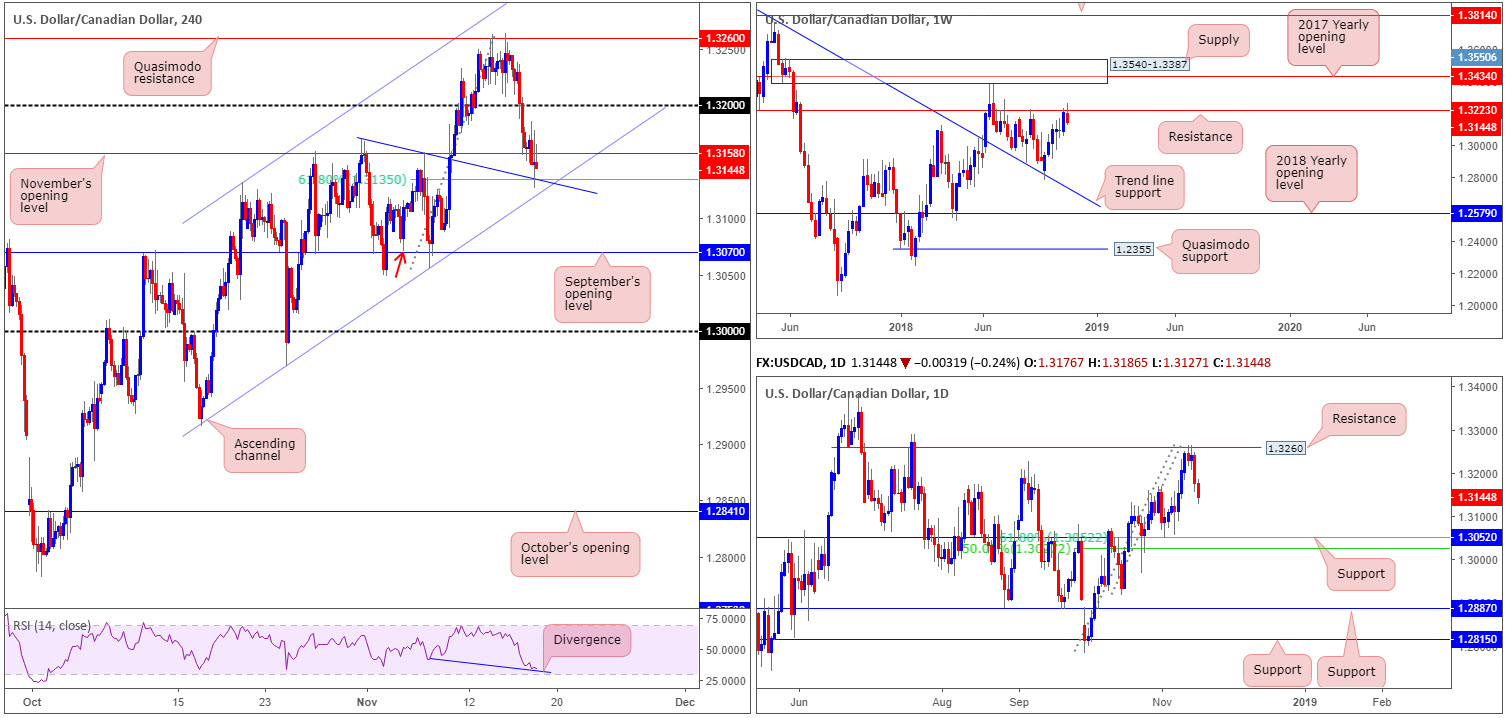
USD/CAD:
Weekly Gain/Loss:-0.43%
Weekly Close: 1.3144
Weekly perspective:
USD/CAD bulls lost their flavor last week after price action sold off from resistance coming in at 1.3223, consequently breaking a six-week bullish run. With respect to this timeframe, limited support is visible until the 1.2782 Oct 1 low, followed closely by trend line resistance-turned support (etched from the high 1.4689).
Should the current resistance fail to inspire further downside this week, supply at 1.3540-1.3387 is the next area on the hit list (houses the 2017 yearly opening level within at 1.3434).
Daily perspective:
In conjunction with the current weekly resistance level, daily action also encountered strong selling off resistance at 1.3260. The next support target in view from here falls in around the 1.3052 neighbourhood, placed just north of a 50.0% support value at 1.3026 and in line with a 61.8% Fib support.
H4 perspective:
A closer look at price action shows the H4 candles eventually overwhelmed November’s opening level at 1.3158 Friday. A combination of a waning USD and advancing oil prices forced the pair to challenge a 61.8% Fib support at 1.3135, which, as you can see, merges with a local trend line resistance-turned support (taken from the high 1.3170). It may also interest traders to note the RSI indicator currently displays divergence, and directly beneath 1.3135 is a channel support (extended from the low 1.2916).
Areas of consideration:
From an intraday perspective, many traders are expecting buyers to make an appearance from the noted H4 channel support. While a push above 1.3158 and a subsequent run towards 1.32 is a possibility, both weekly and daily structure currently reflects a bearish tone. Therefore, trading long is considered chancy, according to the technical picture.
Rather than trying to buy against higher-timeframe flow, consider waiting and seeing if H4 price engulfs the current H4 channel support and retests it as resistance. This, in the shape of a bearish candlestick formation, would likely be enough to draw in sellers towards September’s opening level at 1.3070, which also happens to represent a Quasimodo left shoulder (red arrow). Note this level is also positioned less than twenty pips above the next downside target on the daily scale: 1.3052.
Today’s data points: Limited.
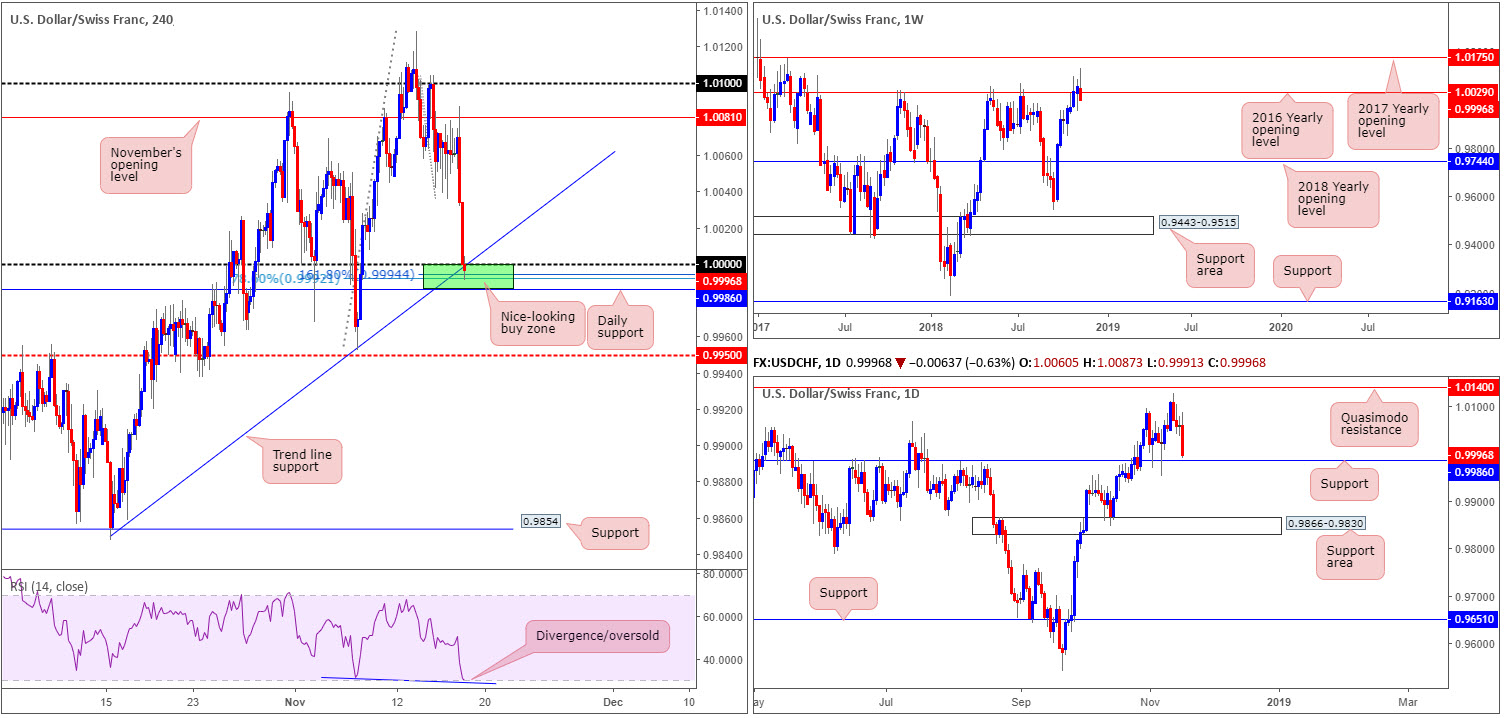
USD/CHF:
Weekly Gain/Loss: -0.51%
Weekly Close: 0.9996
Weekly perspective:
After a seven-week bullish run, as well as a marginal close above the 2016 yearly opening level at 1.0029 the week prior, last week’s action observed a sharp change in mood. Despite clocking highs of 1.0128, the pair turned lower and reclaimed 1.0029, possibly unlocking downside as far south as the 2018 yearly opening level at 0.9744.
Daily perspective:
Despite weekly action threatening the market with lower prices, daily movement concluded Friday’s session within striking distance of a notable support level at 0.9986. Although most are not expecting a to-the-pip test of this level judging by its recent history, active buyers will still likely attempt to make an appearance.
H4 perspective:
Going into the early hours of US trade, broad-based USD selling overtook the market Friday from the underside of November’s opening level at 1.0081 on the back of comments from Trump as well as Fed’s Clarida and Kaplan, forcing the H4 candles to touch gloves with parity (1.0000).
By and of itself, 1.0000 is an appealing level of support. However, when fusing closely with a H4 trend line support (etched from the low 0.9847), a 78.6% H4 Fib support at 0.9992, a 161.8% H4 Fib ext. point at 0.9994, daily support mentioned above at 0.9986 and the H4 RSI indicator displaying an oversold/divergence reading, this level can now be labeled a high-probability reversal zone.
Areas of consideration:
Based on our technical studies, 1.0000 (in particular the zone marked with a green square) is likely an area the market could see buyers enter the fray today. In regard to upside targets, 1.0050 appears a reasonably logical starting point.
Conservative traders may opt to wait and see how H4 price action behaves before pulling the trigger. A bullish candlestick formation would help confirm buyer interest, and also provide entry/stop parameters. Aggressive traders, however, may simply enter at market around current price and position stops a few pips beneath daily support at 0.9986.
Today’s data points: Limited.
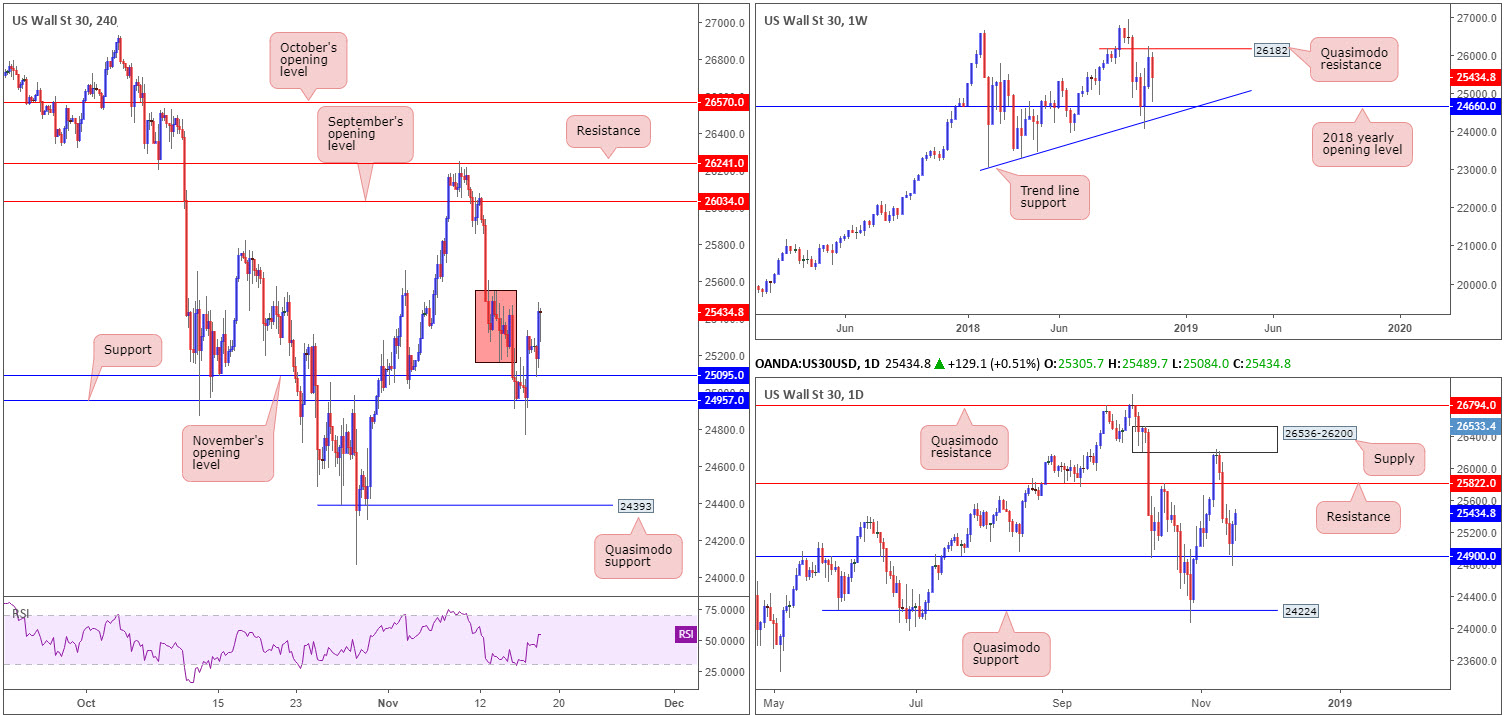
Dow Jones Industrial Average:
Weekly Gain/Loss: -1.98%
Weekly Close: 25434
Weekly perspective:
With the 2018 yearly opening level at 24660 (merges closely with trend line support [extended from the low 23055]) seen holding the index higher a few weeks ago and the Quasimodo resistance at 26182 equally as defensive in recent trade, both levels remain on the radar this week. Overthrowing 26182 could eventually see the market push for fresh record highs, whereas a break of 24660 may lead to significant losses given the lack of active demand.
Daily perspective:
Lower down on the curve, support at 24900 strongly entered the fight Thursday, encouraging additional gains on Friday. Assuming buyers remain in the driving seat here, the next area of concern can be seen around the 25822 resistance level, trailed closely by supply coming in at 26536-26200. In the event the current daily support gives way this week, however, a proven Quasimodo support rests at 24224.
H4 perspective:
In recent news, US President Trump said China wants to make a deal on trade, but not acceptable as it is now. Crucially, Trump also said he may not have to impose further tariffs on China, and hopefully a deal can be made, though he once again said that trade must be reciprocal. Following a retest of November’s opening level at 25095, this prompted further buying Friday.
Though the H4 candles remained bullish into the week’s close, the unit remains grappling with a large portion of consolidation marked in red at 25550-25166, which could still act as resistance and hinder upside. Should the unit press beyond here, the next upside target on the H4 scale can be seen at September’s opening level carved from 26034.
Areas of consideration:
While further buying on the daily timeframe is certainly a possibility, traders likely remain cautious given the red area of consolidation on the H4 timeframe mentioned above at 25550-25166. Even with this area out of the picture, traders still have to contend with nearby resistance seen on the daily timeframe at 25822.
In view of the above reading, similar to Friday’s outlook, neither a long nor short seems attractive today.
Today’s data points: Limited.
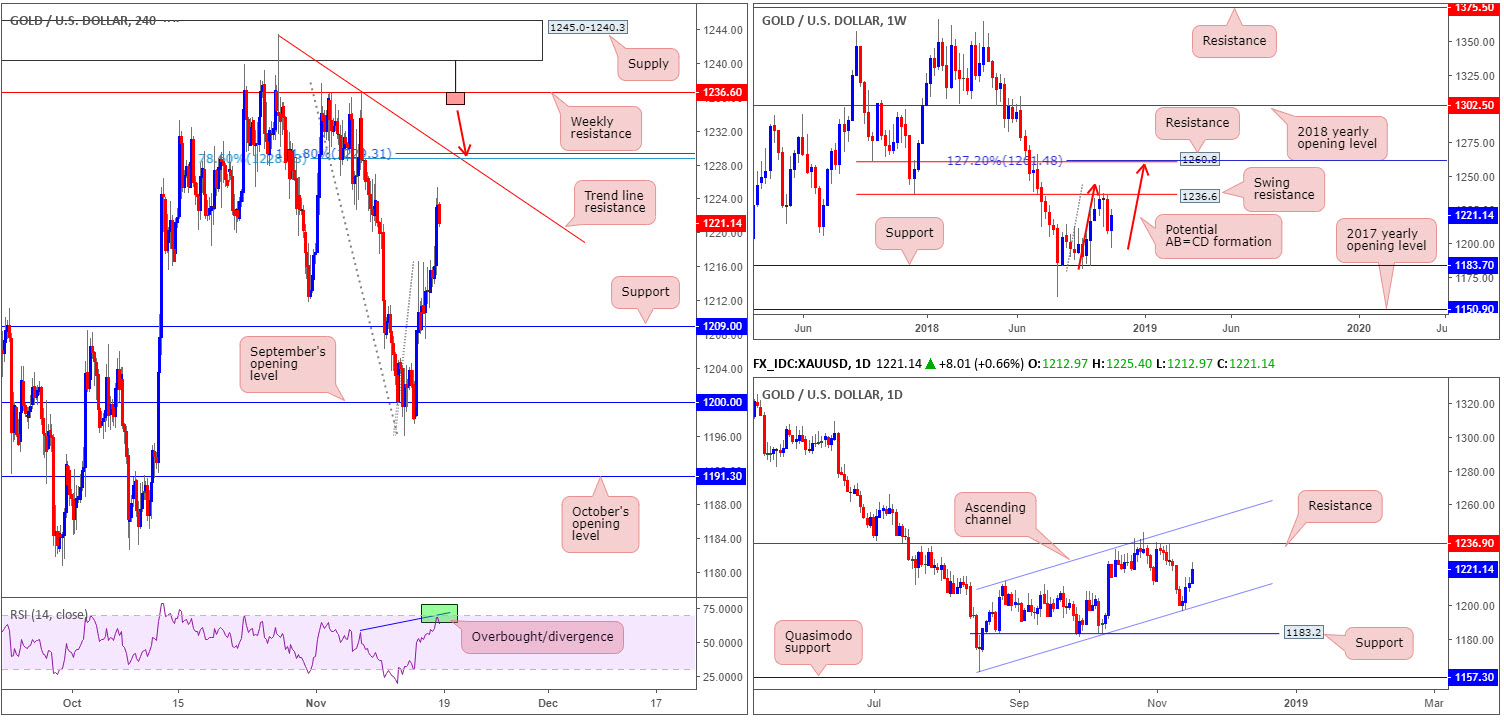
XAU/USD (Gold):
Weekly Gain/Loss: +0.95%
Weekly Close: 1221.1
Weekly perspective:
According to the longer-term technical structure on the weekly timeframe, support at 1183.7 remains a point of interest, as does the swing resistance priced in at 1236.6. Although either area could be brought into play going forward, the potential for an AB=CD (red arrows) 127.2% bearish formation to complete just north of another layer of resistance (1260.8) at 1261.4 is certainly worth keeping in mind.
Daily perspective:
Looking at this market in more detail, we can see the yellow metal is currently compressing within an ascending channel formation (1160.3/1214.3), with the candles possibly working their way towards a test of resistance at 1236.9 (essentially representing the weekly swing resistance mentioned above at 1236.6) this week.
H4 perspective:
With the US dollar falling reasonably sharply on Friday, bullion extended recent gains. As we hope is clearly demonstrated on the H4 chart, a trend line resistance (extended from the high 1243.4) is recognized as the next upside target on this scale. In addition to this, a 78.6% Fib resistance at 1228.7 is seen nearby, along with a 161.8% Fib ext. point at 1229.3 as well as the RSI indicator currently displaying an overbought/divergence reading. To expect more than a bounce from the noted trend line resistance would be considered chancy, though, knowing both weekly and daily price show room to press beyond this region towards 1236ish.
Areas of consideration:
While a bounce from the current H4 trend line resistance could be seen, the majority of traders will likely be honing in on the weekly resistance level at 1236.6. With H4 supply at 1245.0-1240.3 positioned just north of this weekly line, traders should prepare for the possibility of a fakeout play. Therefore, should a H4 bearish pin-bar formation take shape that pierces through the weekly resistance and tests the H4 supply (see H4 chart for a visual), this would be considered a high-probability shorting opportunity (stop-loss orders can be positioned either beyond the noted H4 supply or a few pips above the pin-bar’s wick), targeting the other side of the trend line resistance (at that point support) as an initial take-profit zone.
The use of the site is agreement that the site is for informational and educational purposes only and does not constitute advice in any form in the furtherance of any trade or trading decisions.
The accuracy, completeness and timeliness of the information contained on this site cannot be guaranteed. IC Markets does not warranty, guarantee or make any representations, or assume any liability with regard to financial results based on the use of the information in the site.
News, views, opinions, recommendations and other information obtained from sources outside of www.icmarkets.com.au, used in this site are believed to be reliable, but we cannot guarantee their accuracy or completeness. All such information is subject to change at any time without notice. IC Markets assumes no responsibility for the content of any linked site. The fact that such links may exist does not indicate approval or endorsement of any material contained on any linked site.
IC Markets is not liable for any harm caused by the transmission, through accessing the services or information on this site, of a computer virus, or other computer code or programming device that might be used to access, delete, damage, disable, disrupt or otherwise impede in any manner, the operation of the site or of any user’s software, hardware, data or property.


