
EUR/USD:
Weekly gain/loss: +1.39%
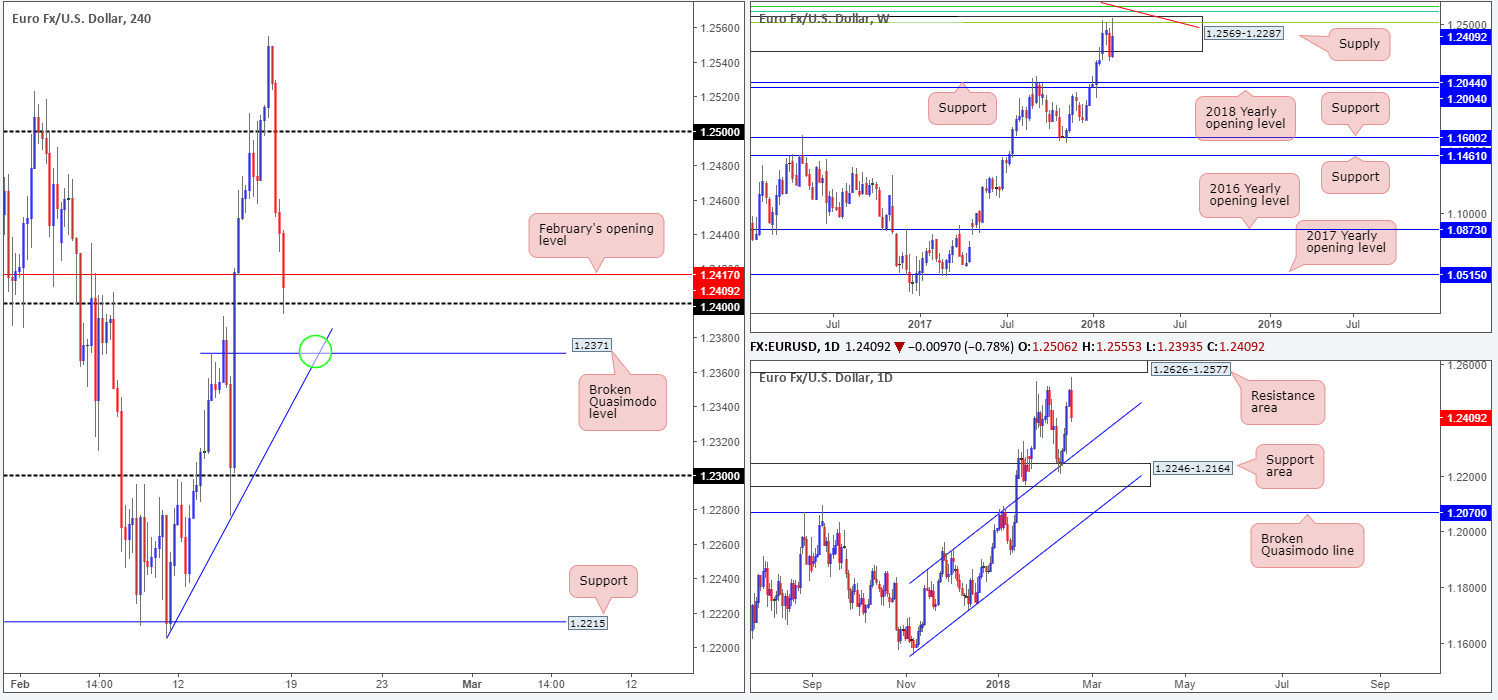
EUR/USD bulls went on the offensive over the course of last week, reversing the majority of the prior week’s downside move. Despite clocking fresh highs of 1.2555, however, weekly price remains capped within a weekly supply base coming in at 1.2569-1.2287. Circling around the top edge of this area, traders may have also noticed a nice-looking Fibonacci resistance cluster (see below) and a long-term weekly trendline resistance taken from the high 1.6038.
- 61.8% Fib resistance at 1.2604 taken from the high 1.3993.
- 50.0% Fib resistance at 1.2644 taken from the high 1.4940.
- 38.2% Fib resistance at 1.2519 taken from the high 1.6038.
Looking at things a little lower on the curve, we can see that daily action recently printed a bearish engulfing candle just ahead of a daily resistance area at 1.2626-1.2577. This – coupled with weekly structure – suggests further downside could be in store this week. The daily channel resistance-turned support extended from the high 1.1861 will likely be the first port of call, followed closely by a daily support area seen at 1.2246-1.2164.
A quick recap of Friday’s movement on the H4 timeframe shows that the single currency came under pressure as the US dollar looked to secure the monthly support seen on the USDX at 88.50. The pair was further influenced by a slew of better-than-expected US data. As you can see, the session ended marginally surpassing February’s opening level at 1.2417 and connecting with the 1.24 handle.
Potential trading zones:
Overall, the team believes lower prices could be the order of the week.
However, shorting beyond the 1.24 handle is not favored since a few pips below it sits a H4 broken Quasimodo line at 1.2371, which happens to converge closely with a H4 trendline support taken from the low 1.2205. This area, should it come into contact anywhere near where the trendline and Quasimodo intersect (green circle), will likely hold price and possibly challenge offers around 1.24. Is this worthy of a trade? Well, it could be if you’re willing to trade against both weekly and daily flow and are prepared to liquidate around 1.24.
Apart from a bounce off of 1.2371, the 1.23 handle is also likely eyed this week. Therefore, a decisive H4 close beyond 1.2371 followed up with a successful retest could offer a potential shorting opportunity.
Data points to consider: US banks closed in observance of Presidents’ Day.
Areas worthy of attention:
Supports: 1.24/3 handle; 1.2371; H4 trendline support; daily channel support; 1.2246-1.2164.
Resistances: 1.2569-1.2287; weekly Fib resistance cluster; weekly trendline resistance; 1.2626-1.2577.
GBP/USD:
Weekly gain/loss: +1.37%
Weekly closing price: 1.4033
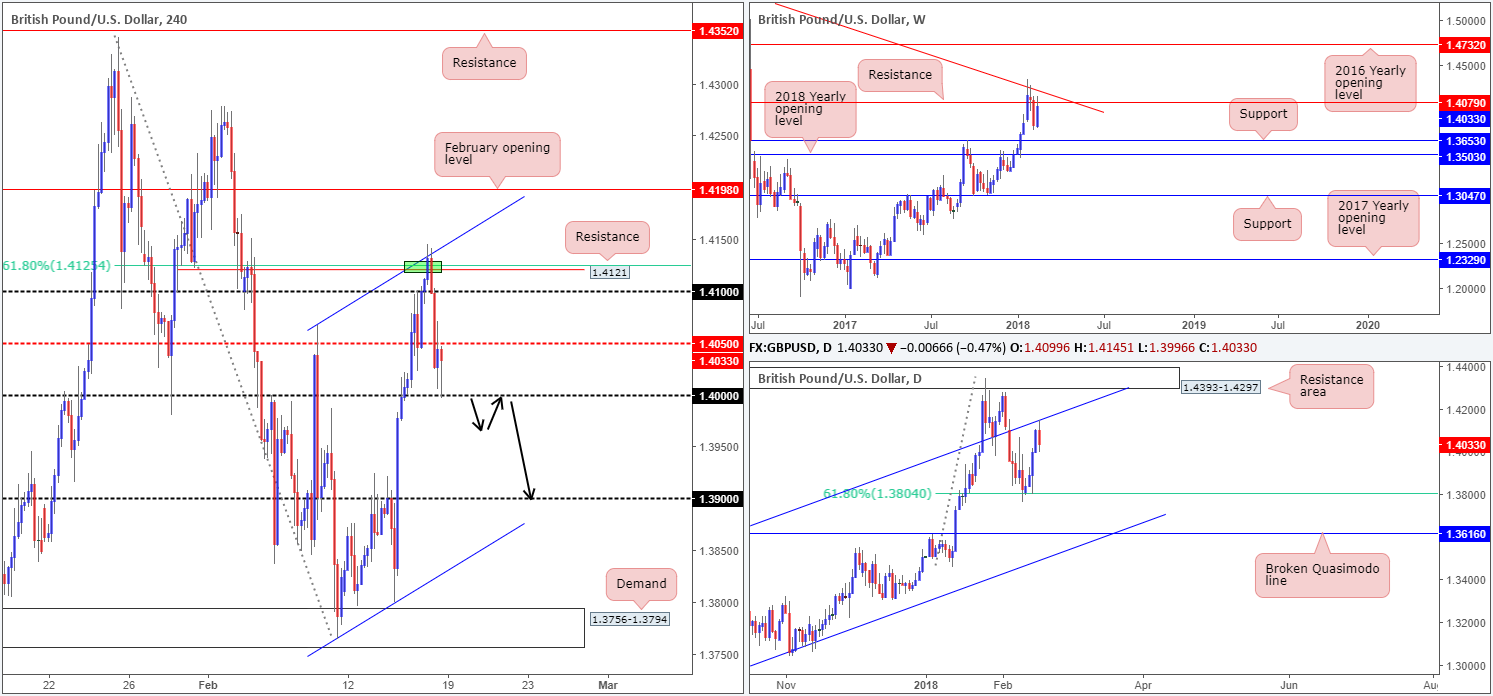
In a similar fashion to the EUR/USD, the GBP/USD also went on the offensive last week, consequently reversing the majority of the prior week’s downside move. Weekly price, however, remains capped by a weekly resistance plotted at 1.4079, which, as you can see, is closely situated near a weekly trendline resistance etched from the high 1.5930. A push higher from here could open the gates for an approach up to the 2016 yearly opening level at 1.4732, whereas a move to the downside has the weekly support at 1.3653 to target.
A closer look at price action on the daily timeframe shows that the unit managed to secure a band of support from the 61.8% daily Fib level at 1.3804 during the course of last week’s segment. The pair corrected sharply higher from here on Wednesday and concluded the week mildly paring gains from a daily channel resistance extended from the high 1.2903.
For those who read Friday morning’s outlook you may recall that the team highlighted a possible sell zone around the 1.4121ish area (comprised of a H4 resistance at 1.4121, a H4 channel resistance taken from the high 1.4067 and a H4 61.8% Fib resistance drawn from 1.4125 (green line). Well done to any of our readers who managed to take advantage of this move. The candles dropped more than 100 pips, ending the day mildly trimming losses from the 1.40 psychological band.
Potential trading zones:
With both weekly and daily structure establishing a base around noted resistances, the H4 mid-level resistance at 1.4050 will likely put up a fight today.
Ultimately though, a decisive H4 close below 1.40 is what we’re looking for. This, alongside a successful retest, would, in our technical opinion, be enough to warrant attention, due to where we’re currently trading on the bigger picture and also the fact that there’s little support on the H4 radar until we reach 1.39.
Data points to consider: BoE Gov. Carney speaks at 6.45pm GMT. US banks closed in observance of Presidents’ Day.
Areas worthy of attention:
Supports: 1.40/39 handle; 1.3804; 1.3653.
Resistances: 1.4050; 1.4121; 1.4079; daily channel resistance.
AUD/USD:
Weekly gain/loss: +1.16%
Weekly closing price: 0.7907
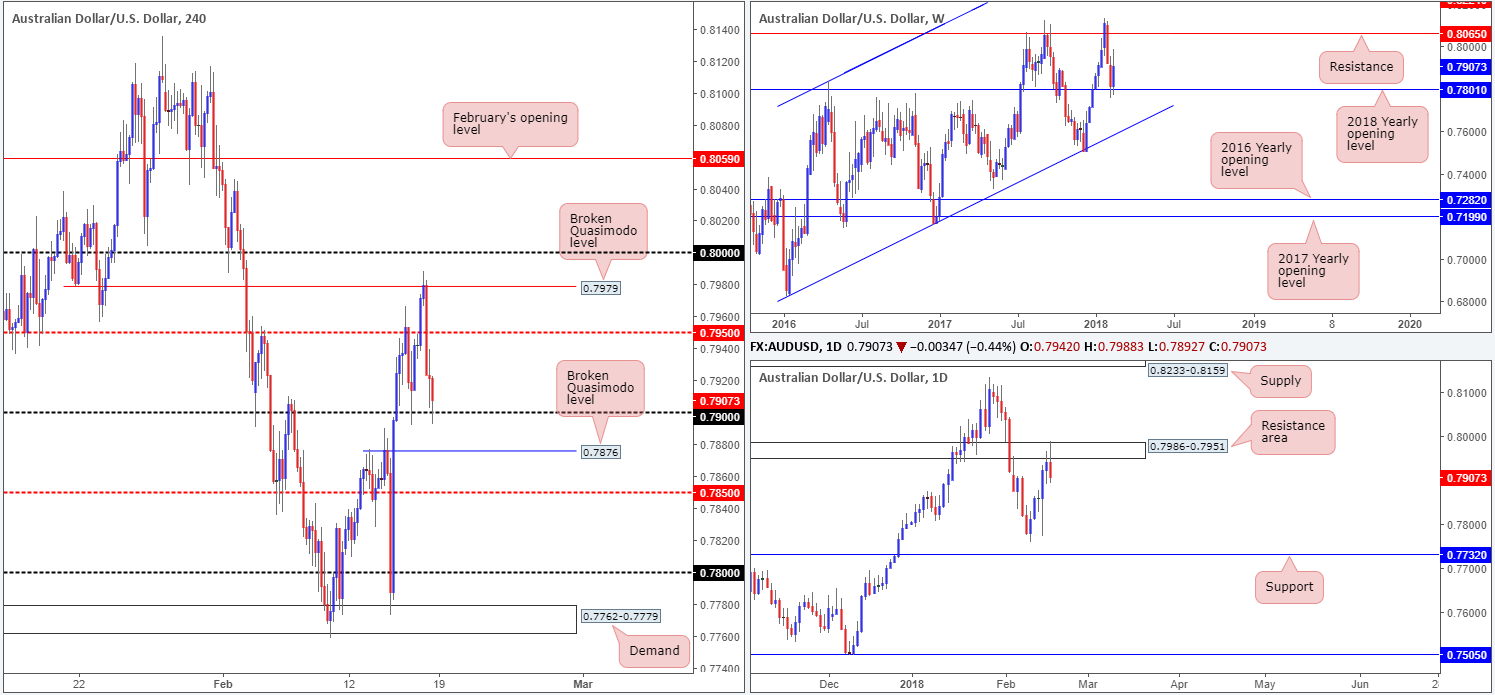
The commodity currency stood tall off the 2018 yearly opening level at 0.7801 last week, breaking a dominant two-week bearish phase and recouping the majority of the prior week’s losses. Sustained upside from this point may eventually pull the unit back up to the weekly resistance level pegged at 0.8065.
Drilling down to the daily timeframe, nevertheless, we can see that price chalked in a reasonably strong bearish reversal candle on Friday from a daily resistance area coming in at 0.7986-0.7951. Therefore, in order for weekly price to climb higher, this daily zone will need to be engulfed.
Looking across to the H4 timeframe, the broken Quasimodo line at 0.7979 (positioned 20 pips beneath the large psychological band 0.80) held beautifully on Friday, as the US dollar began showing signs of recovery. The H4 mid-level support at 0.7950 put up little fight, consequently clearing the path south down to the 0.79 handle.
Potential trading zones:
At this point in time, the Aussie market is not really offering much to shout about in terms of trading opportunities.
A long from the 0.79 handle (or even the H4 broken Quasimodo line seen just below at 0.7876) is overshadowed by the current daily resistance area, despite showing backing from weekly structure.
Selling this market is also just as challenging given the collection of H4 supports in view at the moment!
On account of the above, opting to stand on the sidelines for the time being may be a path to consider.
Data points to consider: RBA Assist Gov. Bullock speaks at 10.15pm GMT; US banks closed in observance of Presidents’ Day.
Areas worthy of attention:
Supports: 0.79 handle; 0.7876; 0.7801.
Resistances: 0.7979; 0.80 handle; 0.7986-0.7951.
USD/JPY:
Weekly gain/loss: -2.39%
Weekly closing price: 106.27
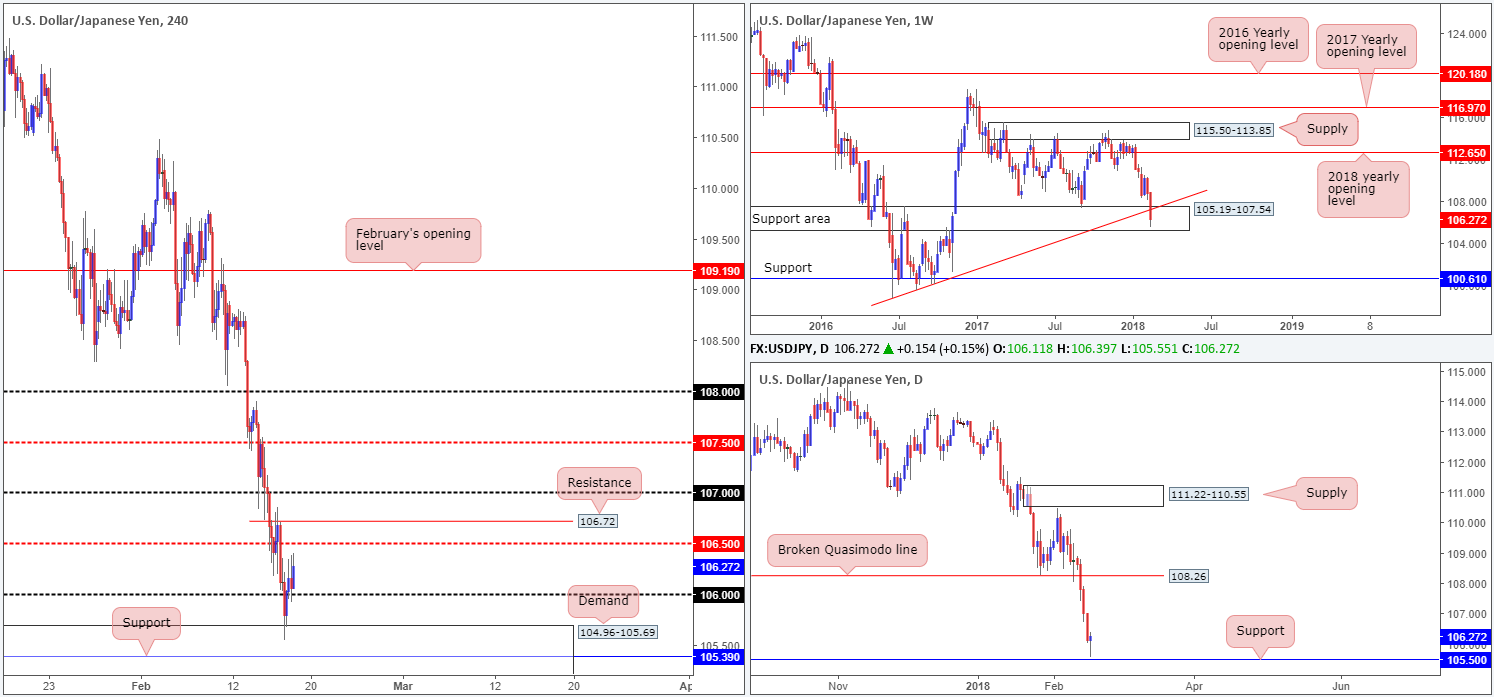
Another miserable week for the USD/JPY pair saw the unit clock considerable losses. This has, as you can see, forced weekly price deeper within the jaws of a weekly support area at 105.19-107.54, and probed below a weekly trendline support etched from the low 98.78. A clean break of this support area could exacerbate losses, since beyond here there’s little stopping the action from trading as far south as the weekly support band coming in at 100.61.
After a four-day selling frenzy, shaped by four reasonably dominant daily bearish candles, daily price managed to find a footing just ahead of a daily support level marked at 105.50. Should this prompt a recovery this week, we could see the daily candles target the broken Quasimodo line at 108.26.
A brief look at recent dealings on the H4 timeframe reveals that H4 demand at 104.96-105.69 (houses a H4 support level at 105.39 and the aforementioned daily support) held ground on Friday, bidding the action back above the 106 handle into the closing bell. To the upside, we can see a fair amount of wood to chop through in the shape of a nearby H4 mid-level resistance at 106.50, local H4 resistance at 106.72 and then the 107 handle. Each level, in our opinion, carries equal weight.
Potential trading zones:
According to our technicals, upside appears somewhat limited at the moment. Not only do we have the H4 structures to contend with, there’s also the possibility that we may face resistance from the underside of the recently broken weekly trendline support. Therefore, for those traders considering a long on the basis of the daily buying tail printed ahead of daily support, please do consider the above restrictions.
Data points to consider: US banks closed in observance of Presidents’ Day.
Areas worthy of attention:
Supports: 106 handle; 104.96-105.69; 105.39; 105.50; 105.19-107.54.
Resistances: 106.50; 106.72; 107 handle; weekly trendline resistance (potentially).
USD/CAD:
Weekly gain/loss: -0.17%
Weekly closing price: 106.27
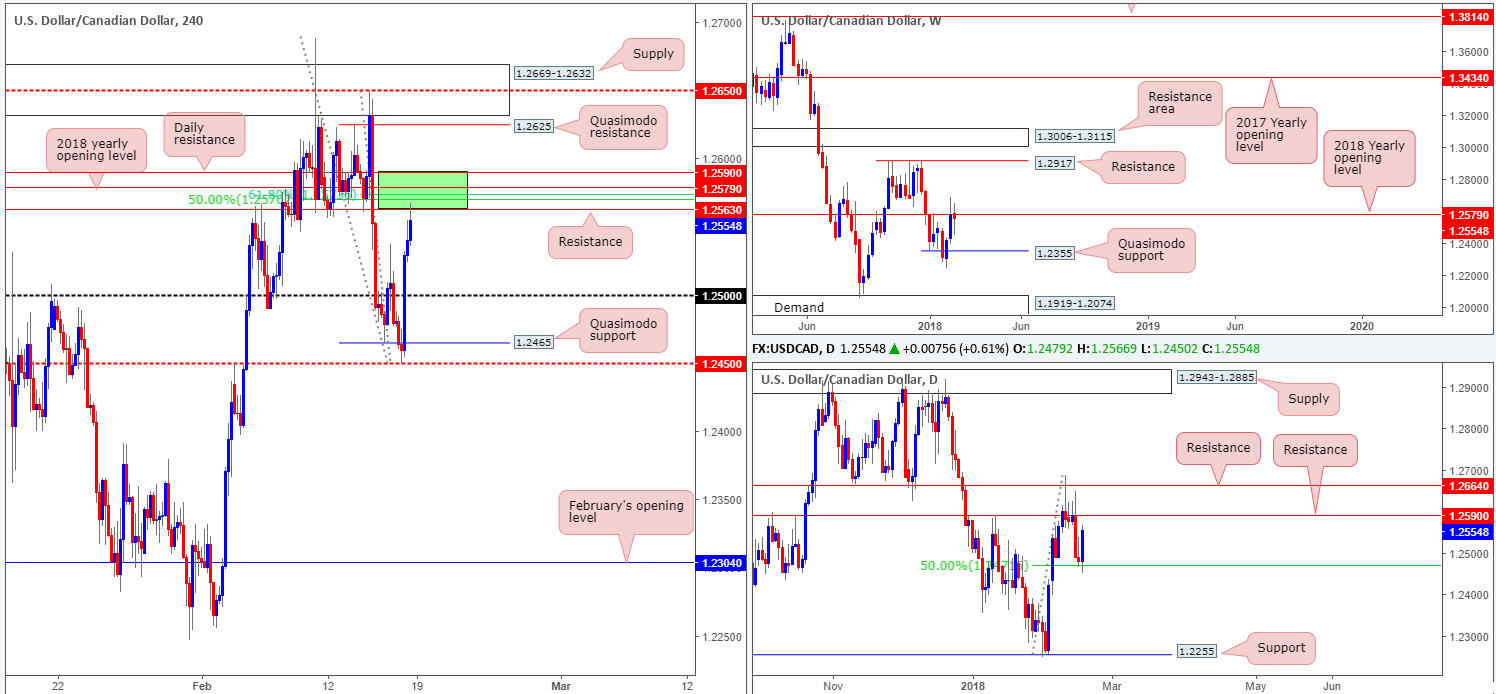
Despite ranging 200 pips last week, the pair managed to end the week reasonably even, pitching itself a few pips beneath the 2018 yearly opening level at 1.2579. Topside possibilities beyond this number comes in at a weekly resistance base drawn from 1.2917, whereas a bearish turn could see the unit face a weekly Quasimodo support level at 1.2355.
The story on the daily timeframe recently placed daily action around a common reversal point: the 50.0% support value at 1.2470. The response from this angle produced a strong-looking daily bullish engulfing candle, which likely caught the attention of candlestick enthusiasts. Although we admit that this is a sign of strength, upside is somewhat restricted. Besides the 2018 yearly opening level seen on the weekly timeframe, we also have to take into account two nearby daily resistances planted at 1.2664/1.2590.
On the back of strong dollar sentiment, and a slew of upbeat US economic readings, the H4 candles put in a strong performance on Friday. The 1.25 handle was completely obliterated, which left the floor free for the H4 candles to lay claim on the H4 resistance level at 1.2563.
Potential trading zones:
The H4 resistance level at 1.2563 is of interest, since it is surrounded by a number of attractive structures. Comprised of the daily resistance level at 1.2590, the 2018 yearly opening level and a H4 61.8% Fib/50.0% resistance value at 1.2573/1.2570, this area (shaded in green) provides a possible platform for one to consider shorting this market from today.
In addition to the noted confluence, downside is relatively clear until we reach at least the 1.25 handle – an ideal first take-profit area.
Data points to consider: US banks closed in observance of Presidents’ Day.
Areas worthy of attention:
Supports: 1.25 handle; 1.2470; 1.2355.
Resistances: 1.2590/1.2563.
USD/CHF:
Weekly gain/loss: -1.34%
Weekly closing price: 0.9270
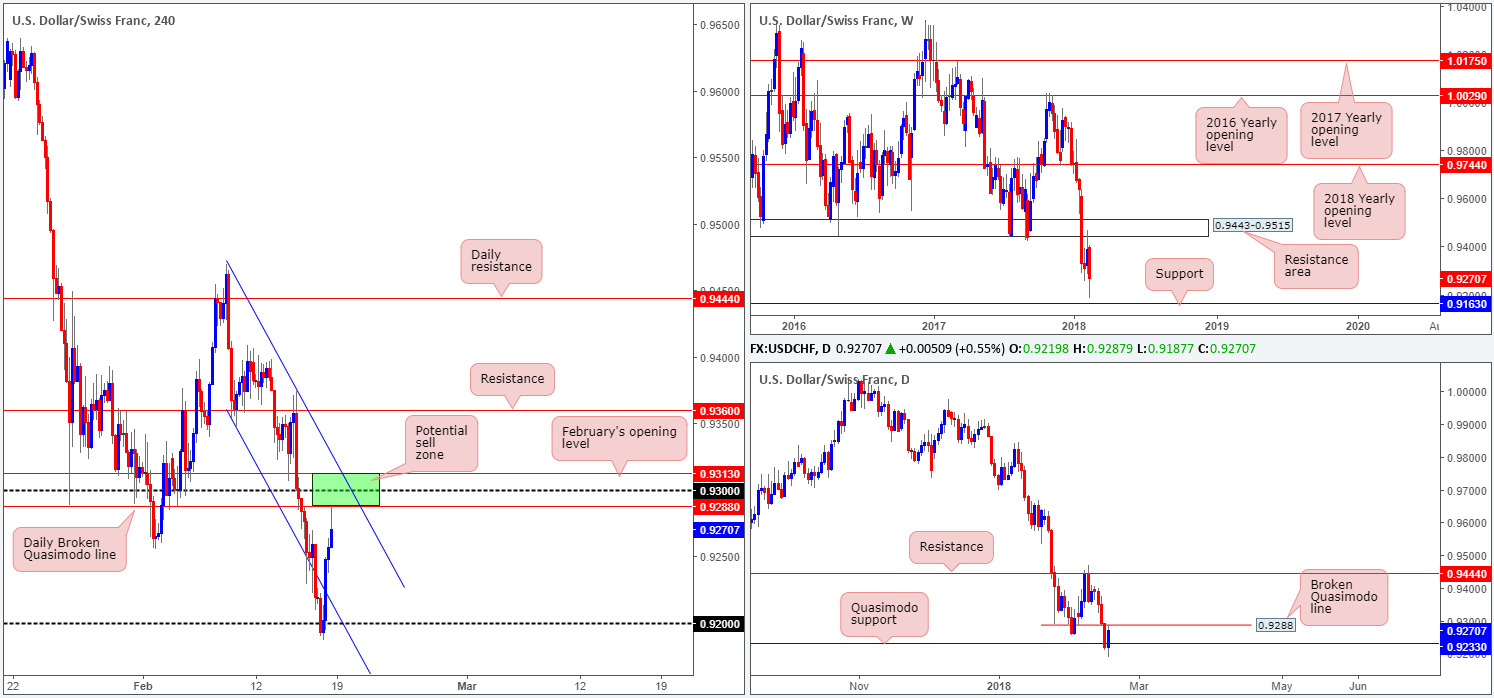
Following a retest to the underside of a recently broken weekly support area at 0.9443-0.9515 (now acting resistance zone), the USD/CHF aggressively probed lower during the course of last week’s action. In spite of this, as you can probably see, weekly price failed to reach weekly support at 0.9163, printing a mild end-of-week correction tail just ahead of the line.
Moving a little lower on the curve, we can see that active bids came into the market on Friday from a daily Quasimodo support level at 0.9233. While we believe this is a solid base of support, we are a tad concerned by the nearby broken daily Quasimodo line at 0.9288. These levels are high-probability reversal points, and considering that downside momentum is favored right now, further selling could be the order of the week.
Over on the H4 timeframe, the bearish tone is further supported. Not only is the aforementioned daily broken Quasimodo line in the picture, we also have to take into account the 0.93 handle, February’s opening level at 0.9313 and a steep H4 channel resistance extended from the high 0.9470 (green H4 area). This is a great deal of wood to chop through!
Potential trading zones:
To sell the H4 green zone marked at 0.9313/0.9288, you may want to consider holding fire and waiting for additional candle confirmation. We say this simply because round numbers tend to entice fakeouts, due to the large amount of orders it attracts. A full or near-full-bodied H4 bearish candle printed within the green area would, in our book, be considered a high-probability sell signal, with an initial target objective set at 0.9233, followed by the 0.92 handle and then weekly support mentioned above at 0.9163.
Data points to consider: US banks closed in observance of Presidents’ Day.
Areas worthy of attention:
Supports: 0.92 handle; 0.9233; 0.9163.
Resistances: 0.9443-0.9515; 0.9313/0.9288.
GOLD:
Weekly gain/loss: +2.37%
Weekly closing price: 1346.4
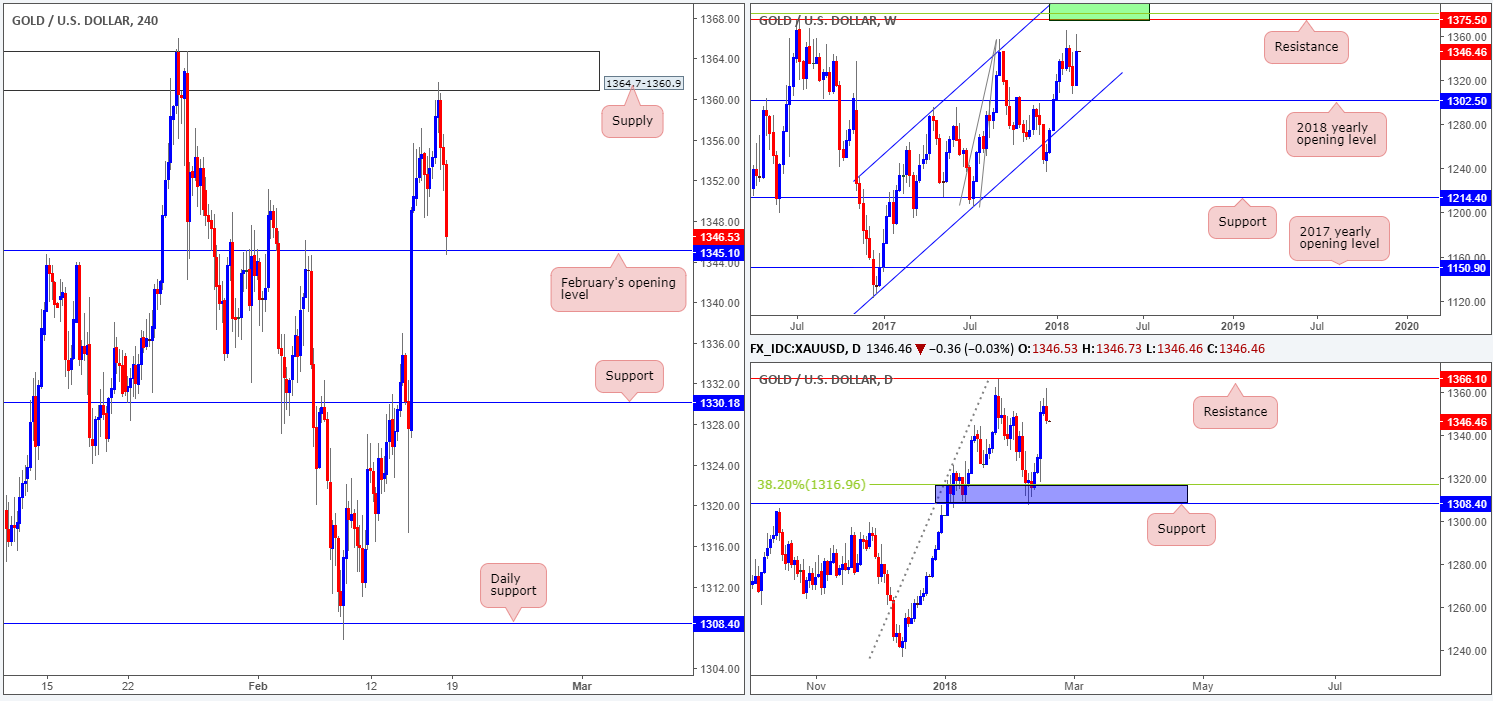
Across the board the US dollar turned lower last week, consequently strengthening major assets, including the precious metal gold. Increasing its value by over $30 and reclaiming approximately two weeks’ worth of losses, the yellow metal is now in good standing to approach the 1396.8/1375.5 weekly zone marked in green (comprised of a 127.2% weekly Fib ext. point at 1396.8, a 38.2% weekly Fib resistance and a weekly resistance level at 1375.5).
Before weekly flow can achieve this price, though, daily action will need to clear active offers residing around daily resistance plotted at 1366.1. This might not be something we see occur today, or even early this week, since Friday’s action, similar to the EUR/USD (a correlated market), printed a strong-looking daily bearish engulfing candle. Assuming this candlestick formation entices trade, we do not see a whole lot stopping this market from diving as low as the 38.2% daily Fib support at 1316.9/daily support at 1308.4 (blue zone).
H4 supply at 1364.7-1360.9 (formed back in Aug 2016) was brought back into the fray on Friday. The move from here, backed by a bout of US dollar recovery from monthly support on the USDX at 88.50, forced H4 price to lock horns with February’s opening level at 1345.1.
Potential trading zones:
So, let’s just run through what we have here:
- Weekly price looking as though it wants to challenge higher prices.
- Daily bearish engulfing candle with space seen to move lower.
- H4 trading from a monthly opening band.
Selling the daily bearish engulfing candle, according to the above, may not be the path to take at this time. You’d effectively be shorting into H4 structure and against potential weekly direction.
Buying, although the unit is trading from H4 support and alongside possible weekly direction, would entail buying into potential selling on the daily timeframe.
As you can see, we are somewhat snookered at the moment!
Therefore, waiting to see if H4 price closes below February’s opening line could be the line to follow. A decisive push below here (preferably followed up with a successful retest) would likely open up H4 downside to support at 1330.1, and also confirm bearish intent in relation to the daily bearish engulfing candle! This, technically speaking, would be considered a high-probability short.
Areas worthy of attention:
Supports: 1345.1; 1330.1; 1308.4/1316.9.
Resistances: 1364.7-1360.9; 1366.1; 1396.8/1375.5.
This site has been designed for informational and educational purposes only and does not constitute an offer to sell nor a solicitation of an offer to buy any products which may be referenced upon the site. The services and information provided through this site are for personal, non-commercial, educational use and display. IC Markets does not provide personal trading advice through this site and does not represent that the products or services discussed are suitable for any trader. Traders are advised not to rely on any information contained in the site in the process of making a fully informed decision.
This site may include market analysis. All ideas, opinions, and/or forecasts, expressed or implied herein, information, charts or examples contained in the lessons, are for informational and educational purposes only and should not be construed as a recommendation to invest, trade, and/or speculate in the markets. Any trades, and/or speculations made in light of the ideas, opinions, and/or forecasts, expressed or implied herein, are committed at your own risk, financial or otherwise.
The use of the site is agreement that the site is for informational and educational purposes only and does not constitute advice in any form in the furtherance of any trade or trading decisions.
The accuracy, completeness and timeliness of the information contained on this site cannot be guaranteed. IC Markets does not warranty, guarantee or make any representations, or assume any liability with regard to financial results based on the use of the information in the site.
News, views, opinions, recommendations and other information obtained from sources outside of www.icmarkets.com.au, used in this site are believed to be reliable, but we cannot guarantee their accuracy or completeness. All such information is subject to change at any time without notice. IC Markets assumes no responsibility for the content of any linked site. The fact that such links may exist does not indicate approval or endorsement of any material contained on any linked site.
IC Markets is not liable for any harm caused by the transmission, through accessing the services or information on this site, of a computer virus, or other computer code or programming device that might be used to access, delete, damage, disable, disrupt or otherwise impede in any manner, the operation of the site or of any user’s software, hardware, data or property.


