
A note on lower timeframe confirming price action…
Waiting for lower timeframe confirmation is our main tool to confirm strength within higher timeframe zones, and has really been the key to our trading success. It takes a little time to understand the subtle nuances, however, as each trade is never the same, but once you master the rhythm so to speak, you will be saved from countless unnecessary losing trades. The following is a list of what we look for:
- A break/retest of supply or demand dependent on which way you’re trading.
- A trendline break/retest.
- Buying/selling tails – essentially we look for a cluster of very obvious spikes off of lower timeframe support and resistance levels within the higher timeframe zone.
- Candlestick patterns. We tend to only stick with pin bars and engulfing bars as these have proven to be the most effective.
For us, lower timeframe confirmation starts on the M15 and finishes up on the H1, since most of our higher timeframe areas begin with the H4.
EUR/USD:
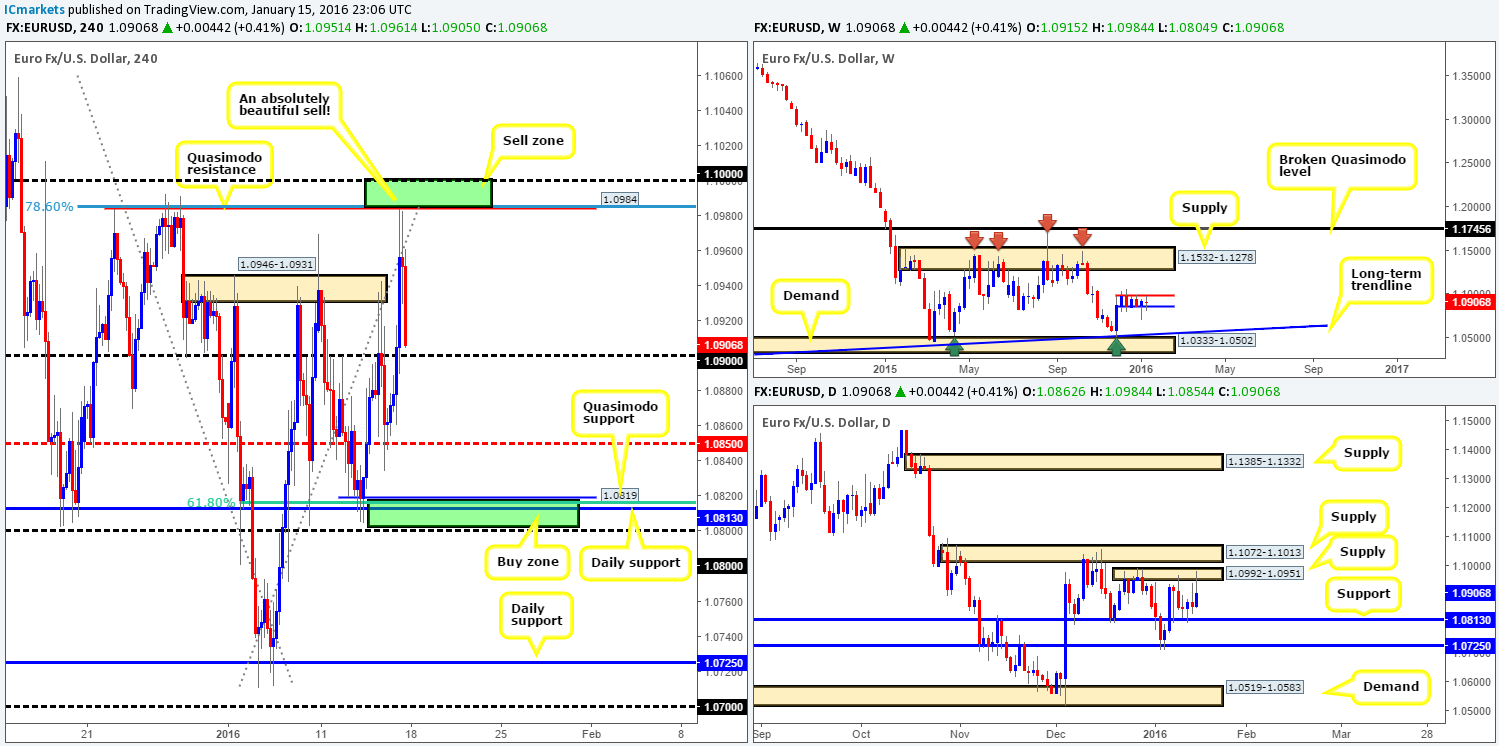
The EUR/USD market remained pretty much unchanged by the close 1.0906 last week, consequently printing a weekly indecision candle. As such, price is still confined between 1.0983/1.0851 (blue/red lines), which, as you can see, has been the case since Dec 7th 2015. Beyond this tight range, however, there’s weekly demand seen penciled in below at 1.0333-1.0502 (converges with a long-term trendline extended from the low 0.8231), and weekly supply above at 1.1532-1.1278.
On the other side of the coin, daily flow shows that support at 1.0813 and supply coming in at 1.0992-1.0951 were both hit during last week’s trading, with price settling for the week betwixt the two aforementioned zones.
Turning our attention to the H4 chart, nevertheless, our long position taken from 1.08153 on Wednesday hit its final take-profit level (the H4 Quasimodo at 1.0984) going into Friday’s American session. For those who read our previous report (http://www.icmarkets.com/blog/friday-15th-january-keep-an-eye-on-the-u-s-dollar-at-1-30-pm-gmt-volatility-expected/), you may recall that we also had a pending short order placed at 1.0983 as this was not only a perfect take-profit area, but also a nice sell zone too. It boasted a 78.6% Fibonacci barrier at 1.0985, a large Psychological resistance just above it at 1.1000 and sat nicely within the extremes of the above said daily supply zone.
At the time of writing, our stop for the current short position is sitting at breakeven with 70% of the trade already being liquidated a little before the weekly close at 1.0920. Well done to any of our readers who took part in the above trades last week, the EUR/USD was very kind to our method! Regarding the remaining 30% of the sell position, however, we’re eyeing the H4 Quasimodo support below at 1.0819 (the region we initially bought from) this week, since it boasts a collection of converging structures (daily support at 1.0813, psychological support 1.0800, 61.8% Fibonacci support at 1.0815). Should our short position hit final take profit, we may, dependent on how the lower timeframes behaves and the time of day, look to go long from here again.
As noted in previous reports, other than the H4 buy and sell zones mentioned above, the levels in between – the psychological support 1.0900 and mid-level support at 1.0850 are considered by us to be mid-range since there’s little higher-timeframe convergence.
Levels to watch/live orders:
- Buys: 1.0819/1.0800 [Tentative – confirmation required] (Stop loss: dependent on where one confirms this area).
- Sells: 1.0983 [LIVE] (Stop loss: breakeven).
GBP/USD:
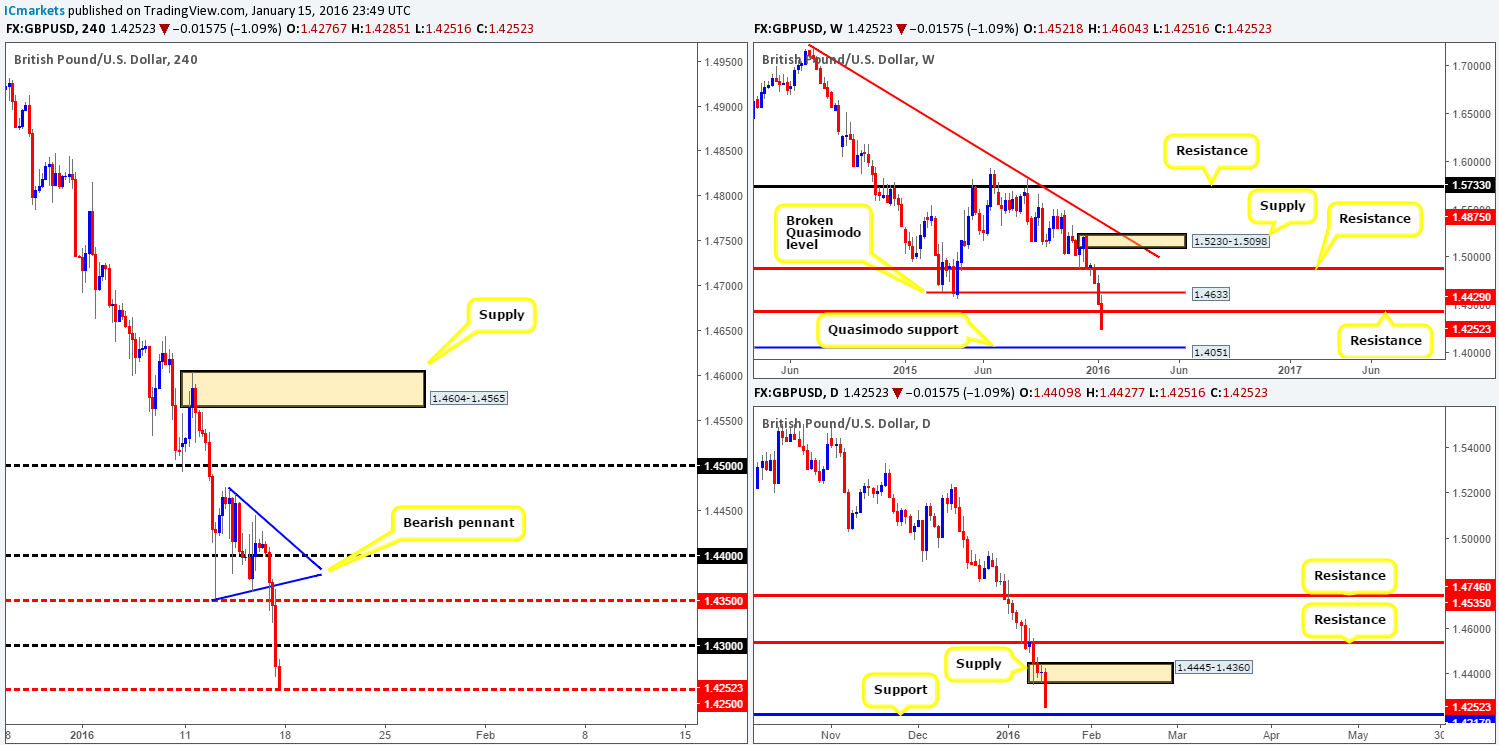
The slaughter continues! Cable takes another blow to the mid-section as prices plummet for a third consecutive week, losing around 260 pips into the close 1.4252. As a result of this most recent down move, weekly support (now resistance) at 1.4429 was engulfed, leaving the path south potentially free this week down towards a weekly Quasimodo support drawn from 1.4051.
Daily action, on the other hand closed the week out just above support penciled in at 1.4217. However, judging how aggressive the weekly candle’s close was, and the fact that daily supply sits directly above current prices at 1.4445-1.4360, we’re not holding much hope for this support this week!
A quick recap of Friday’s sessions on the H4 shows very little but a sea of red candles! The bearish pennant (1.4474/1.4351) was breached going into Friday’s London open, and went on to wipe out both mid-level support 1.4350 and psychological support 1.4300, ending the day two pips above mid-level support 1.4250.
Given the recent movement on both the weekly and daily timeframes (see above), 1.4250 has, at least in our opinion, little hope of holding this week. A more likely area, if you’re looking for longs, would be around the psychological support 1.4200 due to it merging with the aforementioned daily support level. Nevertheless, with the weekly indicating further selling is possible down to 1.4051, and the fact that this market is extremely bearish right now, trading long from this converging barrier is not something that interests us at this point. Therefore, we are going to patiently wait and see what today’s action brings to the table before making any further decisions.
Levels to watch/live orders:
- Buys: Flat (Stop loss: N/A).
- Sells: Flat (Stop loss: N/A).
AUD/USD:
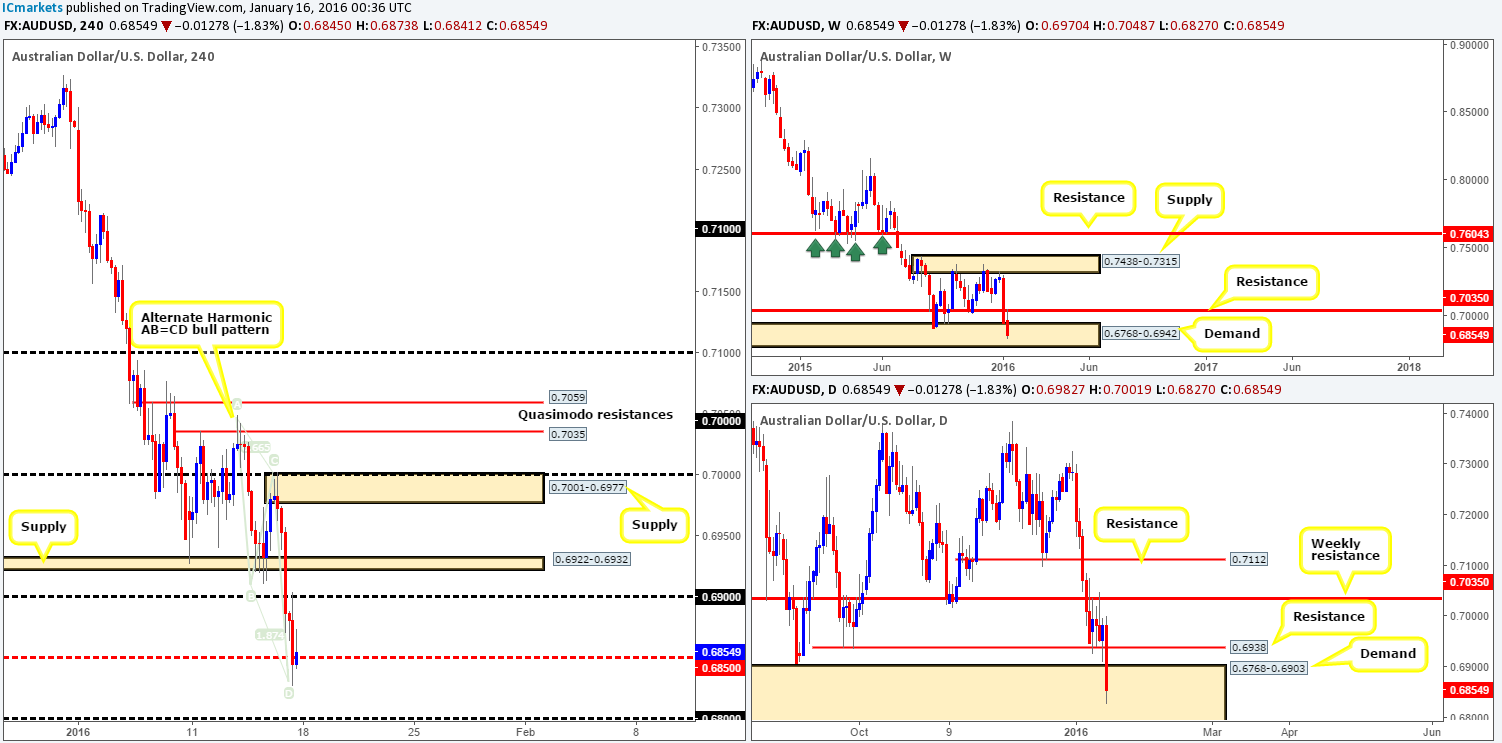
Following the close below weekly support at 0.7035 two weeks back, last week’s weekly action responded by retesting this level as resistance, consequently forcing this pair to close the week out deep within demand formed back in early 2009 (0.6768-0.6942) at 0.6854. It will be interesting to see what the lower timeframes have on offer…
Looking to the daily chart, one can see that this pair remained capped between support (now resistance) at 0.6938 and the aforementioned weekly resistance level up until Thursday’s close. It was only once we entered into Friday’s session did this market collapse, taking out the above said support and driving deep into demand fixed between 0.6768-0.6903 (located deep within the aforementioned weekly demand).
A quick look at Friday’s sessions on the H4 show that price sold off from the large psychological resistance 0.7000 and never looked back until it connected with mid-level support 0.6850. Now, for those who read our previous report on the Aussie (http://www.icmarkets.com/blog/friday-15th-january-keep-an-eye-on-the-u-s-dollar-at-1-30-pm-gmt-volatility-expected/), you may recall that we took a small position long from 0.69355 on Thursday. 70% of our position was closed out at 0.7000 (as planned), and the remaining 30% got took for breakeven. Well done to any of our readers who joined us on this trade!
Given the recent move lower on the H4, price appears to have chalked up an alternate Harmonic AB=CD bullish pattern completing around 0.6821. This – coupled with both the weekly and daily timeframes trading in demand at present (see above) makes this a nice area to be looking for buys today. We would not advise entering long at market here, nevertheless, due to the possibility that price may dive lower to fill bids at psychological support 0.6800, which is also positioned deep within both the above said higher timeframe demands. Assuming however, that we manage to spot lower timeframe buying strength forming from the 0.6850/0.6820 region today, we’d jump in for a long here, targeting 0.6900 first and foremost, followed closely by the small supply at 0.6922-0.6932 and then finally supply at 0.7001-0.6977.
Levels to watch/live orders:
- Buys: 0.6820/0.6850 region [Tentative – confirmation required] (Stop loss: dependent on where one confirms this area).
- Sells: Flat (Stop loss: N/A).
USD/JPY:
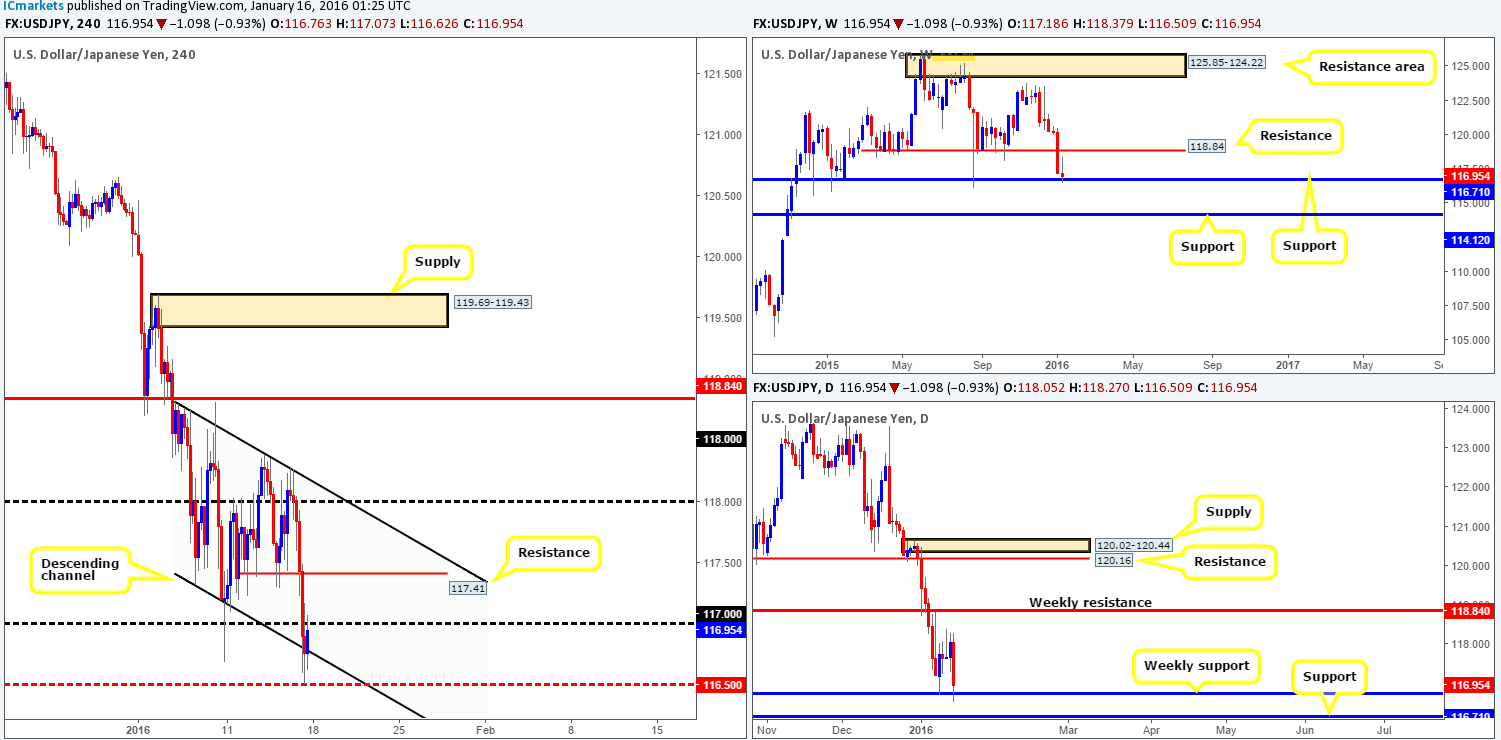
Although the USD/JPY ranged close to 190 pips last week, little change was seen on the weekly timeframe as prices settled only 25 pips lower than the prior week’s close at 116.95. However, what this recent movement did do was paint a weekly inverted pin-bar candle on top of support drawn from 116.71, thus potentially laying a foundation for longs this week.
Down on the daily scale, however, we witnessed price being bid from weekly support Monday through to Thursday; it was only Friday’s action that spoiled the fun! The entire week’s gains were erased in one day with price ending the week stabbing beneath the weekly level itself reaching lows of 116.50. In the event that the majority of buyers are consumed here, the market may drop lower to test bids around support painted at 116.14 sometime this week.
Moving down into the pits of the H4 timeframe, Friday’s movement was similar to that of the AUD/USD – nothing but a sea of red candles until price connected with the lower limits of the channel support taken from the low 117.32 (bolstered by mid-level support 116.50). Be that as it may, buying this market right now with psychological resistance lurking directly above at 117.00 is out of the question for us no matter what the weekly chart is suggesting (see above). Granted, should today’s sessions push price above 117.00 followed by a retest, we may, dependent on what vibe we get from the lower timeframe candles, look to enter long from here. 117.41 would be our first port of call for profit taking, followed closely by psychological resistance 118.00 which converges nicely with channel resistance extended from the high 118.81.
Levels to watch/live orders:
- Buys: Watch for offers to be consumed around 117.00 and look to trade any retest seen thereafter (lower timeframe confirmation required).
- Sells: Flat (Stop loss: N/A).
USD/CAD:
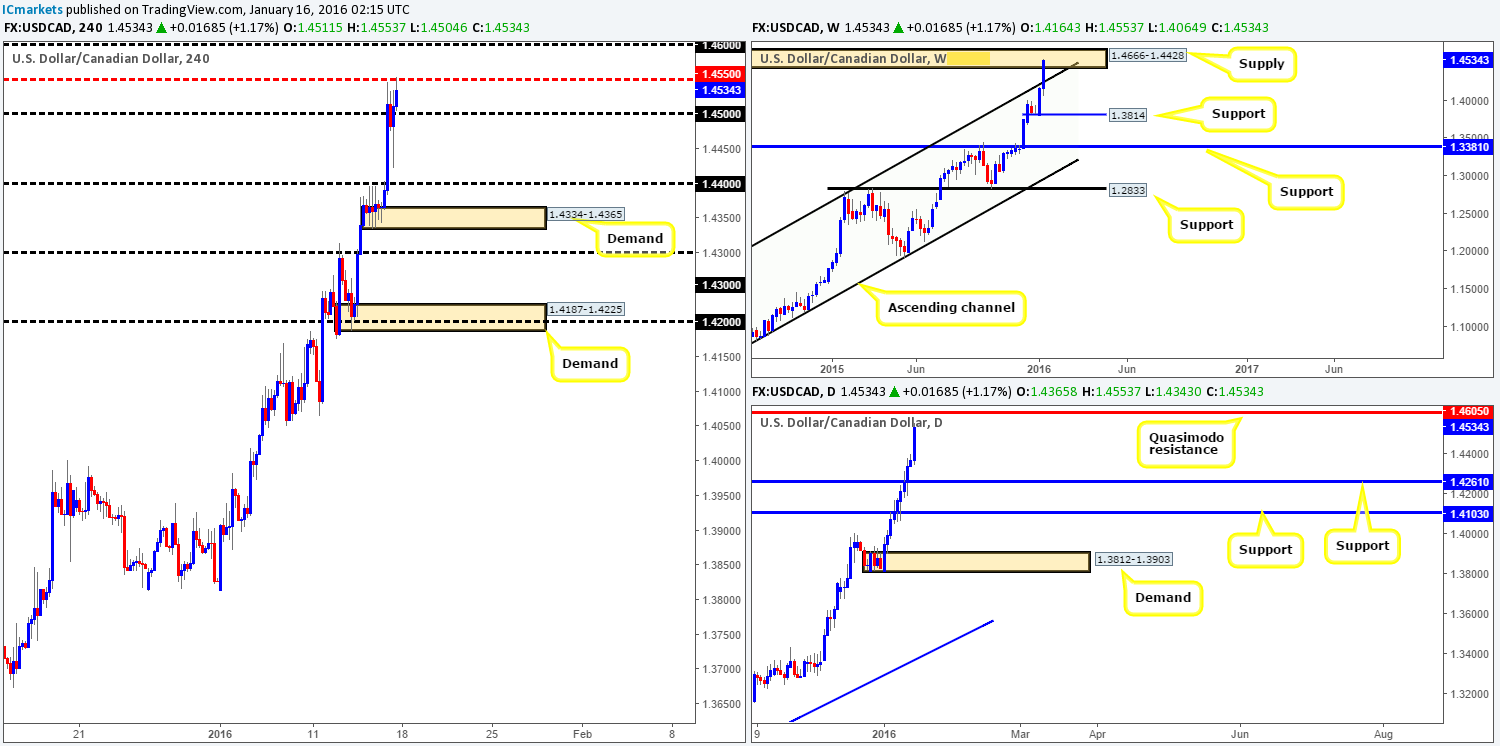
The USD/CAD pair enjoyed another hugely successful week, increasing its value by a further 370 pips into the close 1.4534. This, as can be seen on the weekly chart, forced price to smash through the upper channel resistance band extended from the high 1.1173 and collide with long-term supply penciled in at 1.4666-1.4428.
Zooming in and looking at the daily picture, it’s clear to see how well-bid this pair has been lately – not one bearish close since the beginning of 2016! Although the weekly chart shows price trading within supply, the path north on the daily chart appears free for further upside this week until 1.4605 – a Quasimodo resistance level located deep within the aforementioned weekly supply.
Now, in view of price lingering within supply on the weekly chart right now, entering long in this market is not something we‘re comfortable with at present. This may sound a little crazy considering how strong this pair is trending right now, but we’re actually looking at the psychological resistance 1.4600 for confirmed shorts early this week. Not only does this number fuse beautifully with the daily Quasimodo resistance at 1.4605, but it is also lodged deep within the current weekly supply.
The reason we’re not considering longs at present (apart from the obvious fact that weekly action is trading at supply) is simply because the profit potential is too small up to the daily Quasimodo level. Look at it this way… We’d require either 1.4500 to be retested with confirmation, or a break above 1.4550 followed by a confirmed retest, thus leaving us, at best, with 100 pips to play with. We know this is still a considerable sum, but when dealing with weekly zones, we’re afraid we need a little more leeway than this!
Levels to watch/live orders:
- Buys: Flat (Stop loss: N/A).
- Sells: 1.4600 [Tentative – confirmation required] (Stop loss: dependent on where one confirms this level).
USD/CHF:
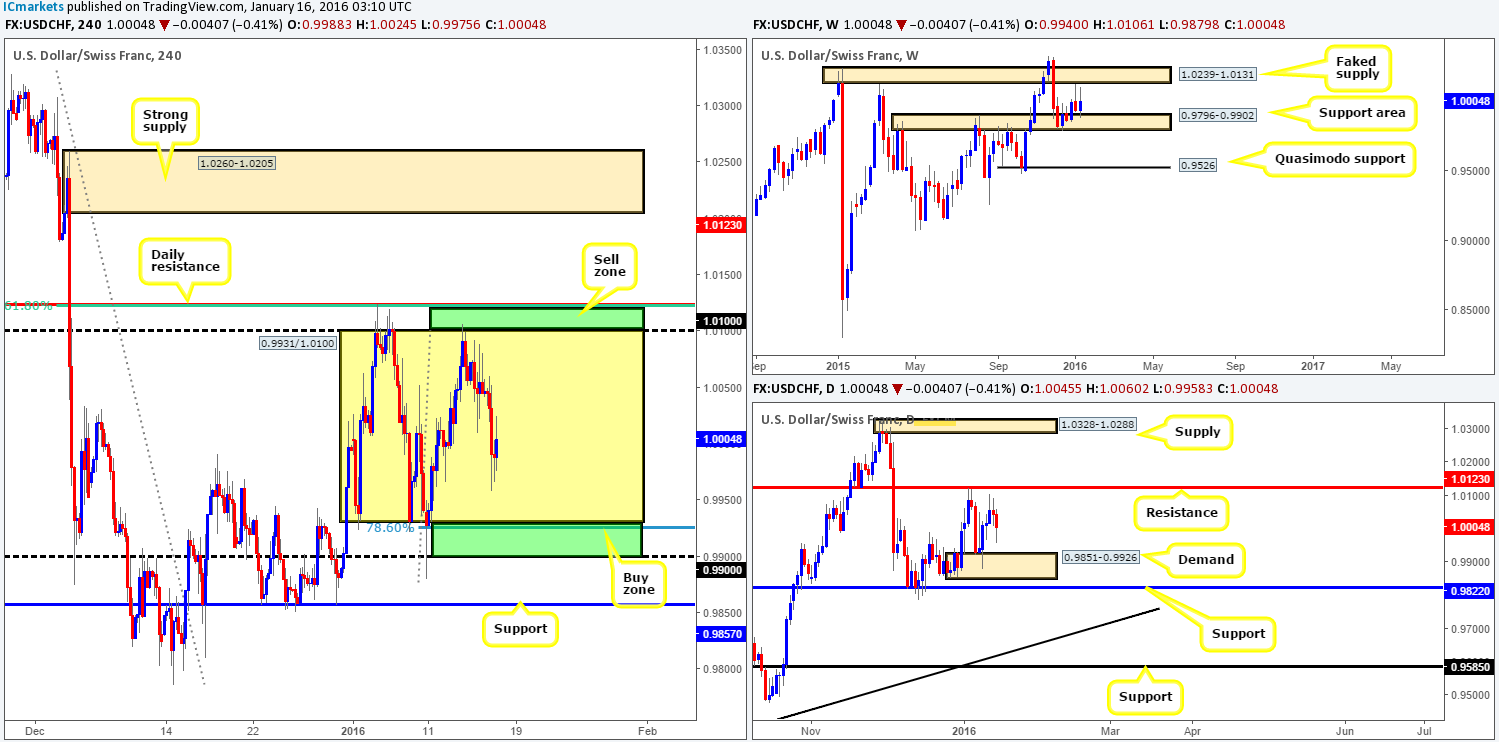
Beginning with a look at the weekly chart, price action shows that although two back-to-back selling wicks printed just below a faked supply at 1.0239-1.0131 last week, there were still active bids residing at the support area seen at 0.9796-0.9902. This saw the USD/CHF close the week sixty pips in the green. With price now effectively capped between these two aforementioned zones at the moment, both areas will need to be on your radar this week…
Branching lower to the daily chart, demand at 0.9851-0.9926, as you can see, provided a floor for this market to bounce north from on Monday, reaching highs of 1.0106 by Wednesday (a few pips below the resistance level seen at 1.0123). At this point, we see little takeaway from this chart other than to keep a close eye on both of these areas this week, since one or both will likely come into play.
Stepping down one more level to the H4, we can see that this pair has entered into a phase of consolidation between 0.9931/1.0100. All this means now, at least for us, is any level within this range is considered to be mid-range as we always target the extremes.
That being the case, here is what our team is looking at going into this week:
For buys:
- Between 0.9931 and psychological support 0.9900. Not only is this the extreme of the current range, but it also converges with a Fibonacci 78.6 retracement at 0.9925 and molds together with both the weekly and daily support structures mentioned above (0.9796-0.9902/0.9851-0.9926).
For sells:
- Between psychological resistance 1.0100 and daily resistance at 1.0123 (boasts a 61.8% Fibonacci retracement at 1.0122).
Levels to watch/live orders:
- Buys: 0.9900/0.9931 region [Tentative – confirmation preferred] (Stop loss: dependent on where one confirms this area).
- Sells: 1.0100/1.0123 region [Tentative – confirmation preferred] (Stop loss: dependent on where one confirms this area).
DOW 30:
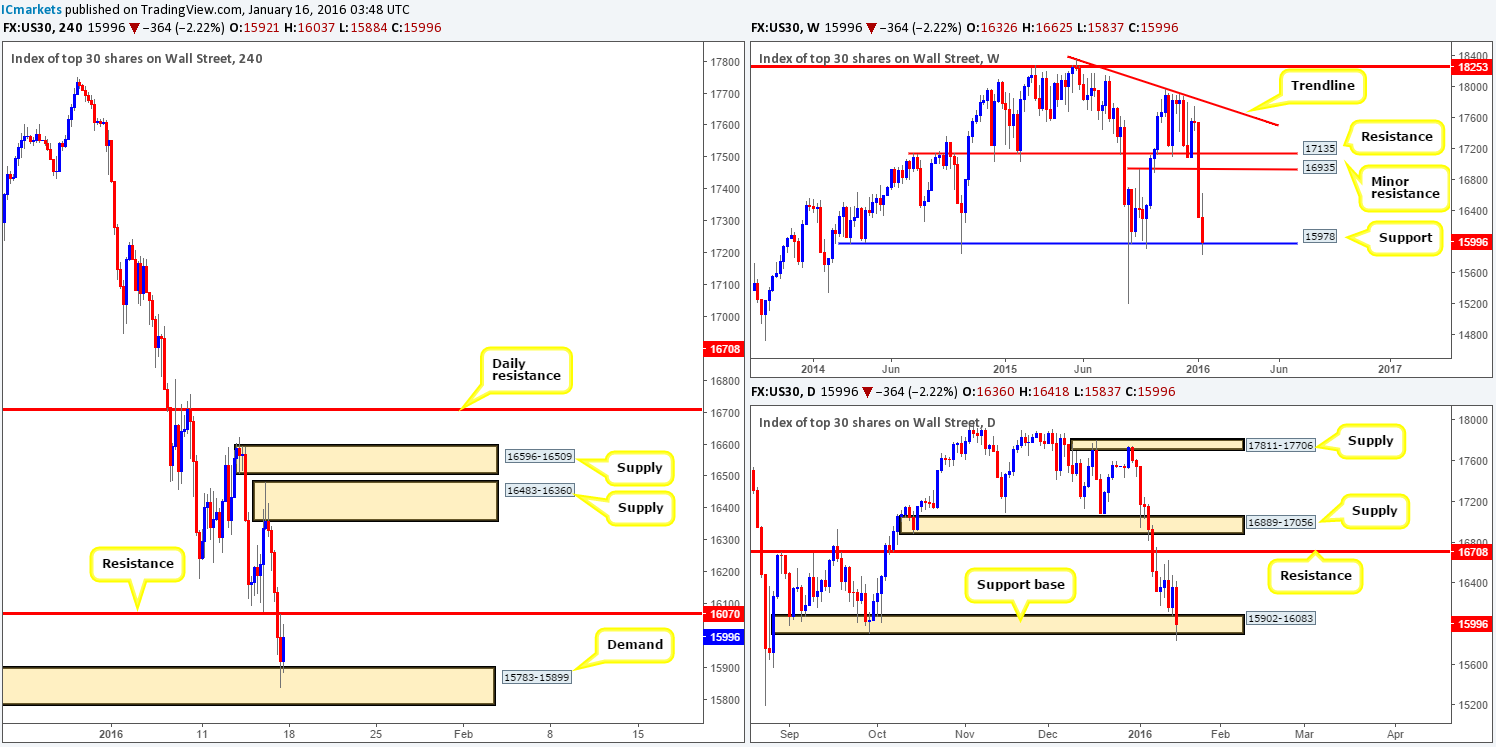
As expected, weekly action continued to depreciate last week, consequently losing 330 points and driving itself into significant support (which has capped downside in this market since early 2014) visible at 15978 by the close 15996. In the event that the buyers are able to defend this number this week, the upside potential from here is huge – the closest resistance being seen at 16935!
Winding down to the daily chart, we can see that late into last week the support base drawn from 15902-16083 suffered a small whipsaw, which has likely triggered a truck-load of stops. However, given where price is located on the weekly chart right now (see above), this is more than likely a fakeout to collect stops for a bounce higher, rather than a continuation move. Topside targets from this base to keep an eye on this week fall in around resistance at 16708, followed closely by supply at 16889-17056.
Friday’s sell-off saw H4 movement absolutely obliterate support (now resistance) at 16070, before ending the week nudging into demand at 15783-15899. Risk/reward considerations would argue against buying at the moment due to offers likely residing around the above said resistance. With that being the case, our team has come to a general consensus that this market will have to prove to us that it wants higher prices before we commit to any trades. It can do this one of two ways:
- Close above 16070 and immediately retrace back to demand for a market long entry.
- Close above 16070 and retest this number as support. Should this occur, we would require lower timeframe confirmation to be seen following the retest, due to the possibility of a deep fakeout.
Levels to watch/live orders:
- Buys: Watch for offers to be consumed around 16070 and look to trade any retest seen thereafter (lower timeframe confirmation required). Alternatively, watch for price to close above 16070 and immediately retrace back to demand for a market long entry (Stop loss: 15755).
- Sells: Flat (Stop loss: N/A).
XAU/USD: (Gold)
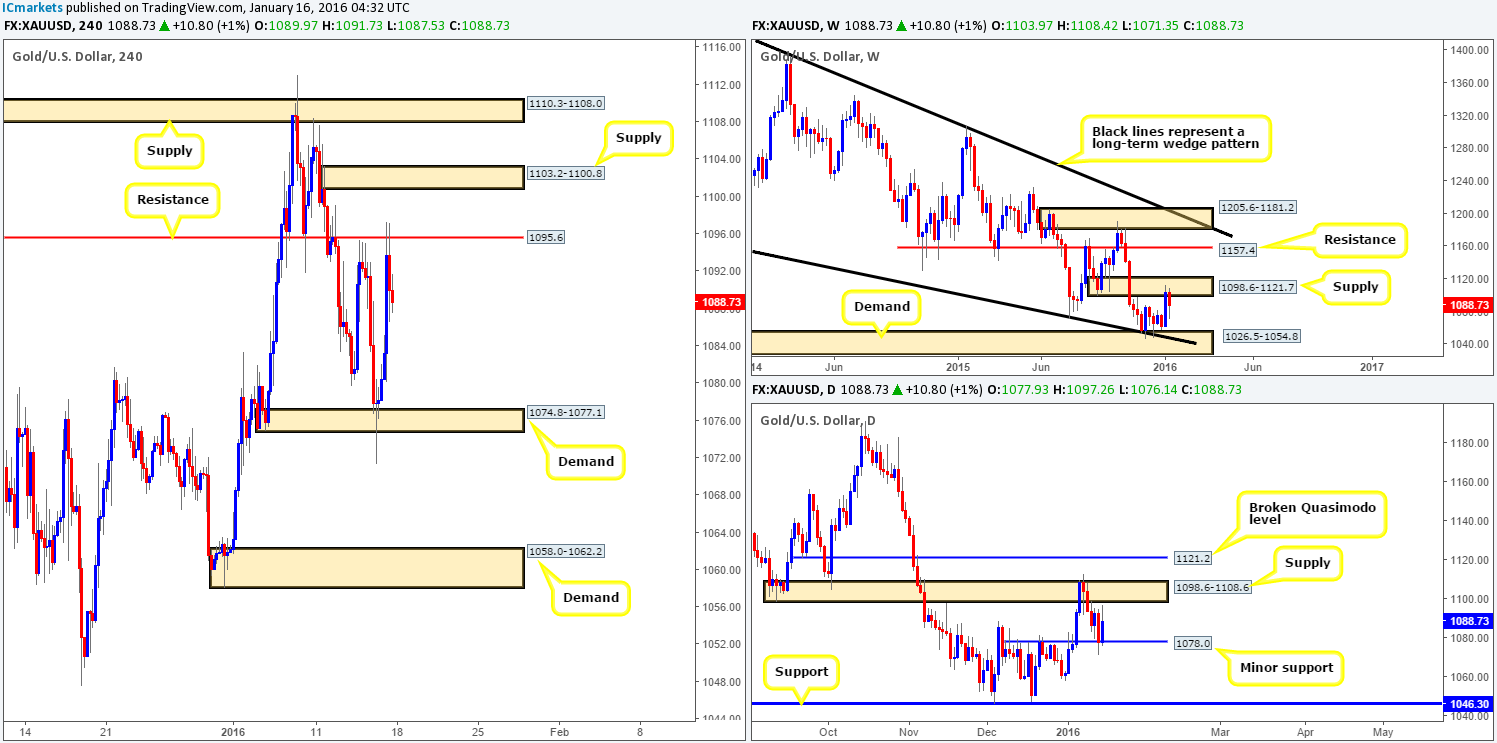
2016 initially saw the yellow metal rally over $40, but as you can see, this advance came to screeching halt when supply at 1098.6-1121.7 was offered last week. This saw the market erase over $15 in value which could have been more if it wasn’t for the minor daily support penciled in at 1078.0.
Turning our attention the H4 chart for the minute, we can see that Thursday’s whipsaw below demand at 1074.8-1077.1 was, alongside price trading at the above said minor daily support, enough to encourage buyers into this market on Friday. This rallied Gold up to resistance at 1095.6 which bounced prices lower by the week’s end.
So, in a nutshell, we have weekly trading from supply, the daily now capped by minor support and supply and the H4 floating in mid-air just below H4 resistance (see above for levels).
Taking into consideration the points made above, our team is favoring further downside today and possibly tomorrow back down to the recently faked H4 demand. That being said though, for us to be permitted a trade here we would require price to retrace either back up to the resistance at 1095.6, or the H4 supply just above it at 1103.2-1100.8 to begin looking for confirmed shorts into this market.
Levels to watch/live orders:
- Buys: Flat (Stop loss: N/A).
- Sells: 1095.6 [Tentative – confirmation required] (Stop loss: dependent on where one confirms this level). 1103.2-1100.8 [Tentative – confirmation required] (Stop loss: dependent on where one confirms this area).


