
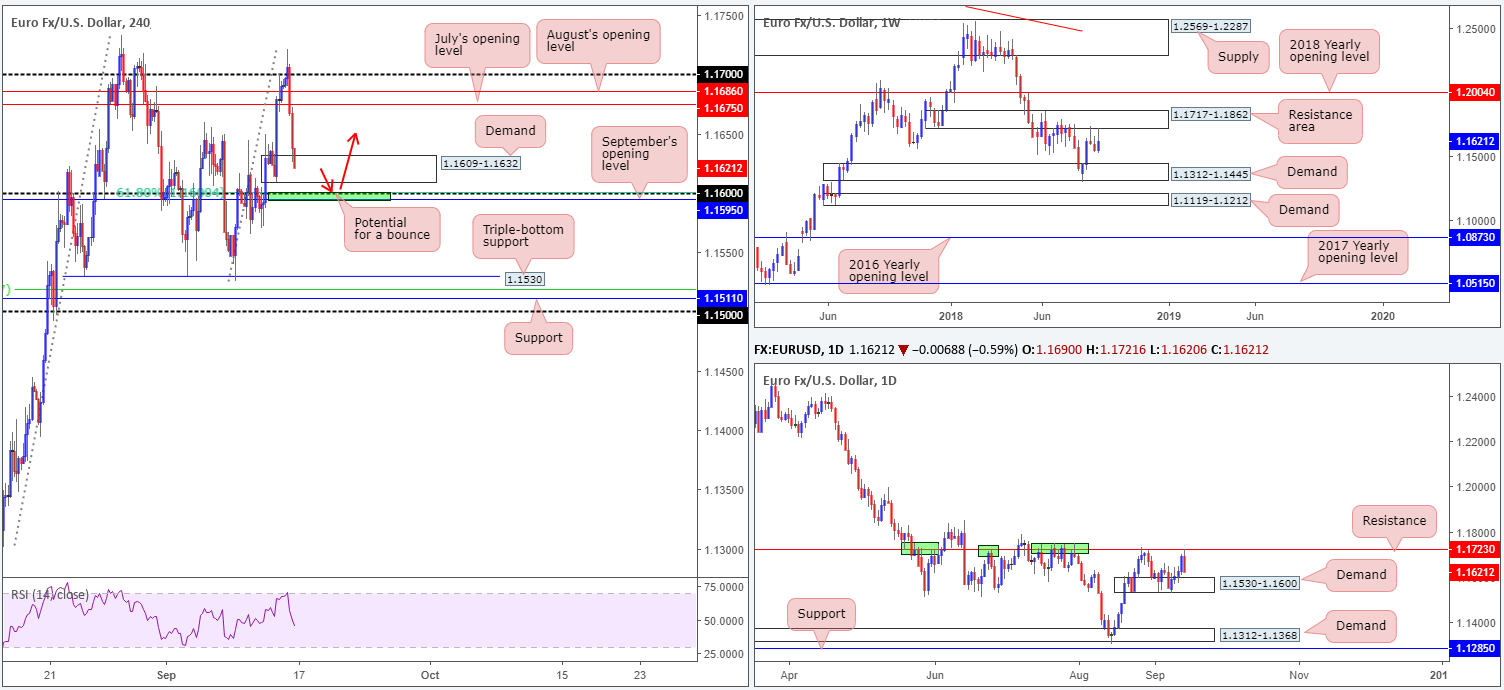
EUR/USD:
Weekly Gain/Loss: +0.61%
Weekly Close: 1.1621
Weekly perspective:
Although the EUR/USD squeezed out a gain last week, demand for the single currency diminished as the unit shook hands with the underside of a notable resistance area coming in at 1.1717-1.1862. Capping upside in the months of May, June and July of this year, this area certainly has potential! The next downside target on this scale falls in around demand drawn from 1.1312-1.1445.
Daily perspective:
From this side of the spectrum, traders witnessed a sharp downside correction just south of a prominent resistance level at 1.1723 on Friday. Not only did this move engulf Thursday’s gains, it positioned the couple back within striking distance of demand printed at 1.1530-1.1600. Whether this demand has any juice left is difficult to judge, as it was violated by a couple of pips at the beginning of last week.
H4 perspective:
A quick recap of Friday’s movement on the H4 scale shows the pair whipsawed through 1.17 to highs of 1.1721, and aggressively turned lower. The catalyst behind the move south appears to be at the hands of US President Trump who reportedly stated he wants $200bln in China tariffs, despite on-going trade talks.
The day ended penciling in a full-bodied bearish candle within the walls of a demand seen at 1.1609-1.1632. While this area is considered the ‘decision point’ to break above 1.17, and, therefore, relatively strong from a technical standpoint, the market may want to bring in 1.16. Aside from this number being watched by many, it is shadowed closely by September’s opening level at 1.1595, a 61.8% Fib support at 1.1599 and also represents the top edge of the daily demand mentioned above at 1.1530-1.1600.
Areas of consideration:
Longer term, there’s a chance the pair could eventually stretch as far south as weekly demand highlighted above at 1.1312-1.1445.
Intraday/medium term, however, we see the 1.16 handle on the H4 timeframe, along with the connecting daily demand zone at 1.1530-1.1600, possibly hindering downside this week. 1.16, in fact, is particularly interesting for a bounce higher today, in view of its local confluence. In addition to this, the stop-loss orders from those long from the current H4 demand and those looking to sell the breakout of this area will likely provide liquidity for pro money to buy (stops from buyers are sell orders).
Therefore, keep eyes on 1.16 today for signs of bullish intent. A nice-looking candlestick formation produced from this neighborhood is likely to deliver some upside, targeting July’s opening at 1.1675 as the initial port of call. Remember, though, never forget where we are coming from on the weekly timeframe – constant monitoring of any long trade is recommended.
Today’s data points: EUR final CPI y/y; US empire state manufacturing index.
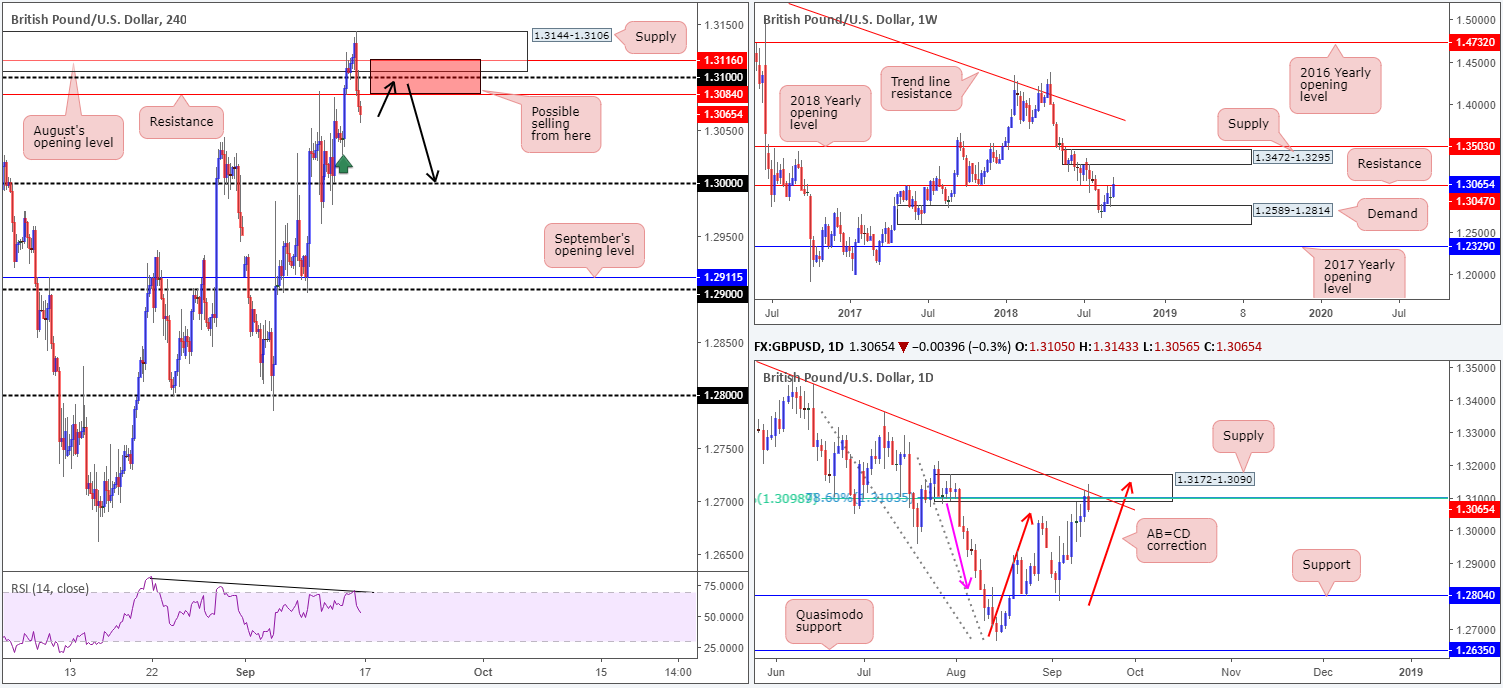
GBP/USD:
Weekly Gain/Loss: +1.18%
Weekly Close: 1.3065
Weekly perspective:
Over the course of last week’s sessions, weekly price attacked higher ground above resistance at 1.3047, reaching highs of 1.3143. At this point, it’s difficult to judge whether the current resistance has been consumed or not, given the lackluster close. Assuming further upside is observed this week, though, the next destination is likely to be a supply zone seen printed at 1.3472-1.3295.
Daily perspective:
Contrary to weekly positioning, daily price is seen checking in with a supply zone marked at 1.3172-1.3090. Besides this supply emphasizing a strong base (check out the downside momentum – pink arrow), the area fuses with a nearby trend line resistance (taken from the high 1.3472), an AB=CD correction (red arrows) point at 1.3150ish and two Fibonacci ratios (61.8%/78.6% – around the 1.31ish area).
H4 perspective:
A modest pickup in USD demand prompted some GBP long covering on Friday, as the unit entered into deep supply territory around 1.3144-1.3106. As is evident from the H4 timeframe, this move brought the candles back beneath its 1.31 handle, and also placed eyes back on resistance at 1.3084. There is demand seen nearby at 1.3026-1.3049 (green arrow), though despite this we feel the key figure 1.30 may be a more realistic downside target on this scale right now.
Areas of consideration:
With such attractive confluence emanating from the daily timeframe at the moment, and weekly price effectively undecided around its current resistance level at 1.3047, selling this market could be the path to explore. With that being the case, selling any retest around the red zone on the H4 scale at 1.3116/1.3084 (comprised of August’s opening level at 1.3116, the 1.31 handle, a H4 resistance level at 1.3084 and also the lower range of the H4 supply at 1.3144-1.3106) could be an option (black arrows), targeting 1.30 as the initial take-profit zone. Conservative traders may opt to wait and see if H4 action prints a bearish candlestick formation before pulling the trigger – this will help determine stop-loss placement and show seller intent.
Today’s data points: US empire state manufacturing index.
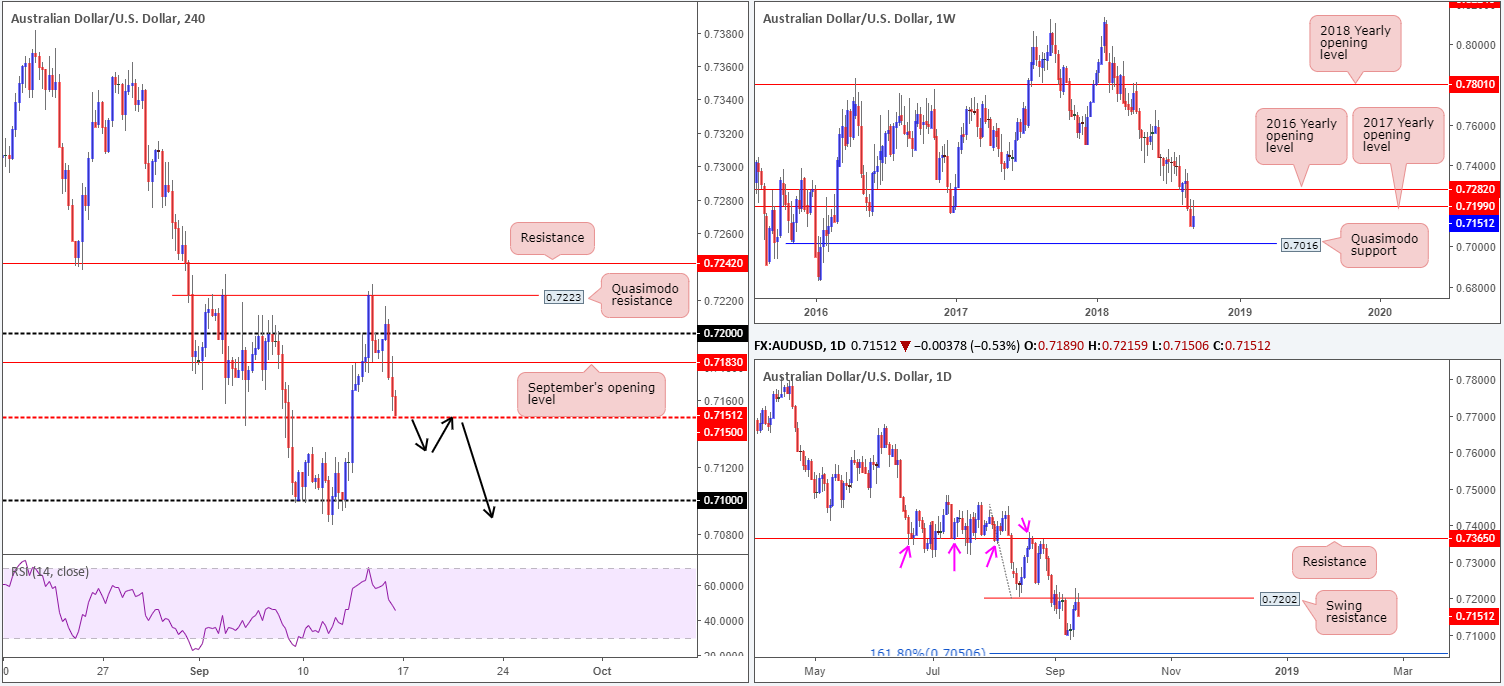
AUD/USD:
Weekly Gain/Loss: +0.69%
Weekly Close: 0.7151
Weekly perspective:
Despite an earnest attempt to recover recently lost ground, the commodity currency remains languishing beneath its 2017 yearly opening level at 0.7199. On that premise, further selling could be in store this week, targeting a Quasimodo support level seen at 0.7016.
Daily perspective:
In conjunction with weekly structure, swing resistance on the daily timeframe at 0.7202 did a superb job in capping upside last week. The next downside target on this scale can be seen around the September 11 low at 0.7085, followed closely by a 161.8% Fib ext. point at 0.7050 (taken from the high 0.7453).
H4 perspective:
Intraday action failed to build on recent upside on Friday, as the buck broke a four-day bearish phase and ended the day printing strong gains. September’s opening level at 0.7183, as you can see, held ground in early Asia, though failed to sustain gains beyond the 0.72 handle, leaving the pair free to connect with mid-level support at 0.7150 into the close.
Areas of consideration:
Having seen limited support visible on the higher timeframes until reaching the 0.7085 point, entering long from 0.7150 on the H4 scale may not be the path to take. An alternative approach is to wait for H4 price to engulf 0.7150 and trade its retest (assuming one takes place). A retest in the shape of a bearish candlestick formation would, according to the overall picture presented here, be enough evidence to suggest we’re at least heading towards 0.7085.
Today’s data points: US empire state manufacturing index.
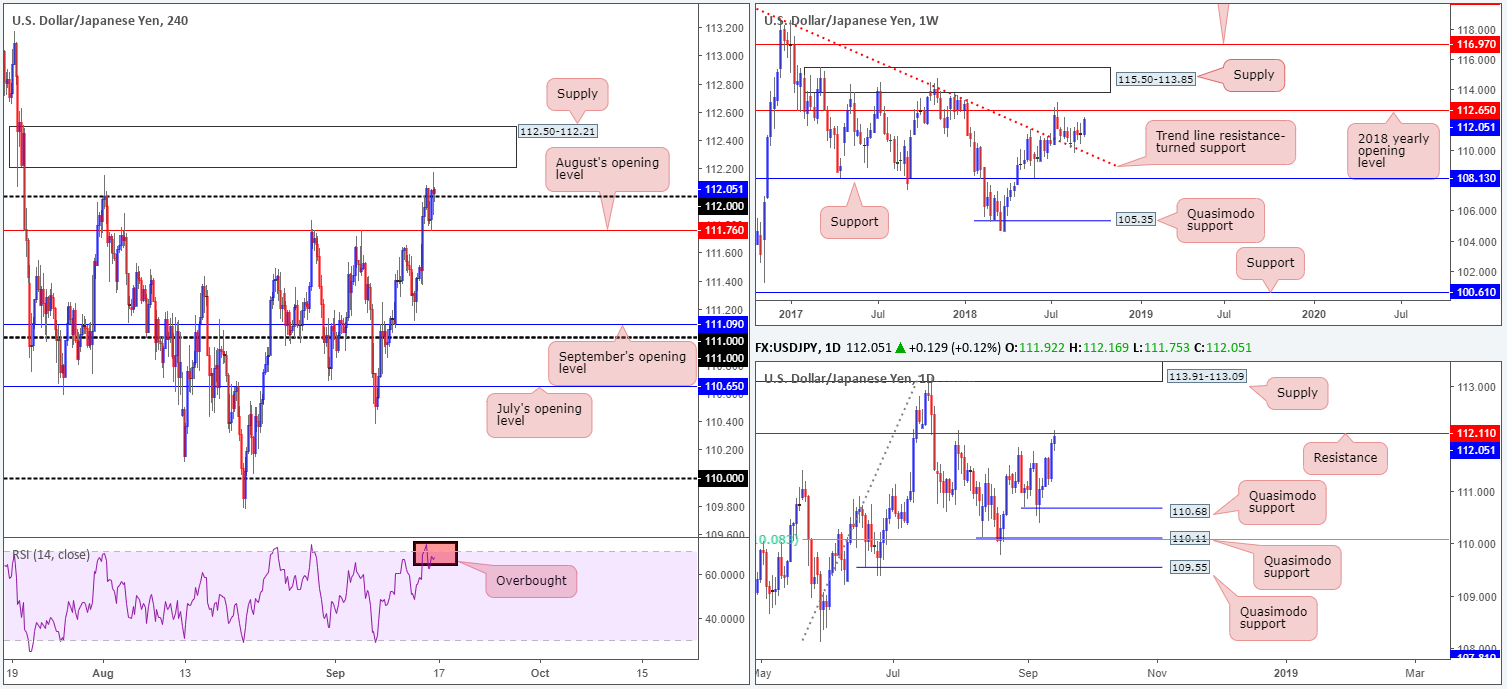
USD/JPY:
Weekly Gain/Loss: +0.91%
Weekly Close: 112.05
Weekly perspective:
The USD/JPY enjoyed a relatively successful week, up nearly 1.00%. Following a strong retest off a trend line resistance-turned support (taken from the high 123.57) a few weeks back, the pair is currently poised to challenge the 2018 yearly opening level at 112.65. This level already held price lower in July, so it’ll be interesting to see if history will repeat itself!
Daily perspective:
Before weekly buyers can bring price action to 112.65, however, daily resistance at 112.11 may prove a problematic barrier to overcome, given its notable history dating back as far as February 2017. Nevertheless, traders should pencil in the supply zone seen above at 113.91-113.09, in the event further upside takes place. If a rejection off 112.11 is observed, on the other hand, a number of Quasimodo supports lurk just below. The closest barrier can be seen at 110.68.
H4 perspective:
After rallying to highs of 112.17, and breaking the August 1st high at 112.15, the unit mildly pared gains on Friday amid headlines US President Trump reportedly stated he wants $200bln in China tariffs, despite on-going trade talks. As of the close, price remains buoyant above 112.
While the close above 112 will likely draw in buyers looking to play the retest this morning, directly above is a nice-looking supply zone seen at 112.50-112.21. And let’s also not forget we have daily resistance in play at 112.11! It might also be worth noting the RSI indicator is trading nearby its overbought value.
Areas of consideration:
On one side of the coin we have weekly price suggesting further buying is on the cards, while on the other side both H4 and daily structure emphasize caution on the upside.
Irrespective of the direction one selects here, opposing structure is clearly seen. Therefore, neither a long nor short appears attractive at current price.
Today’s data points: US empire state manufacturing index; Japanese banks are closed in observance of Respect-for-the-Aged Day.
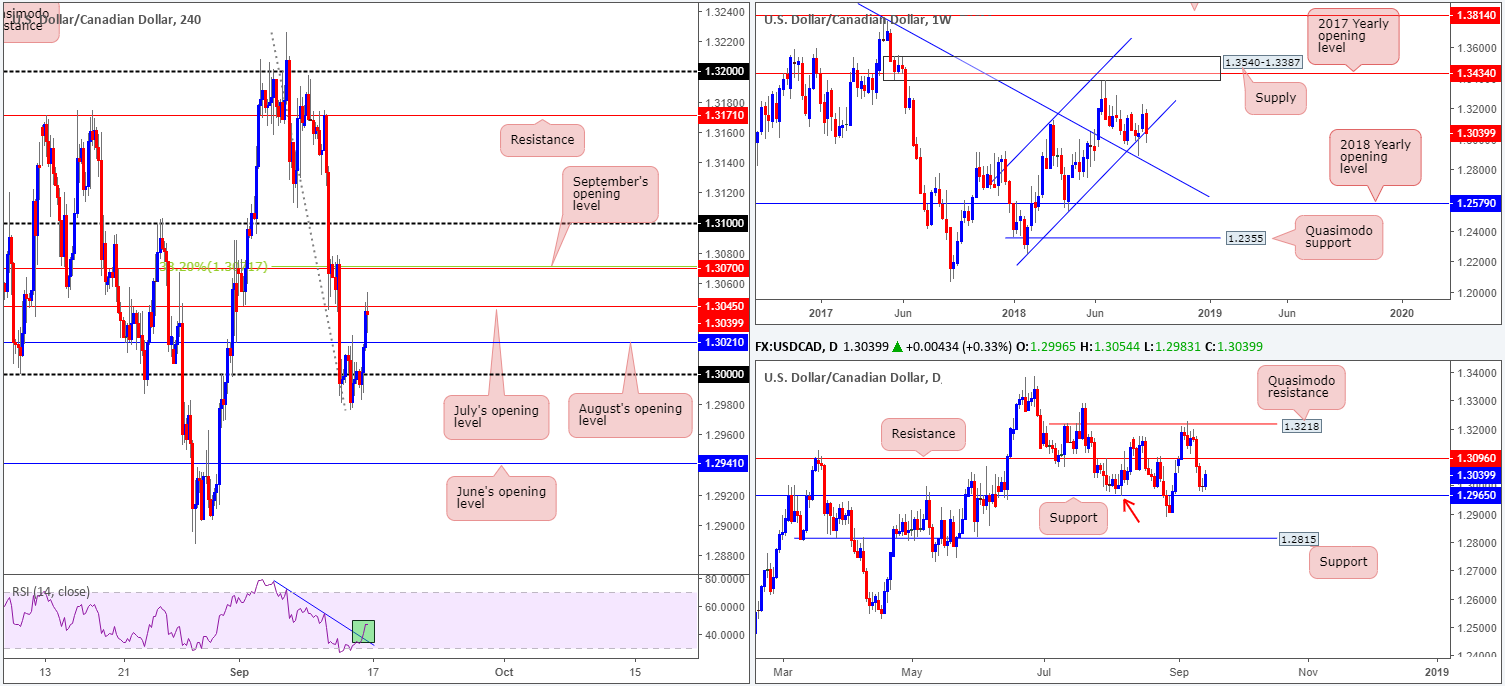
USD/CAD:
Weekly Gain/Loss: -0.96%
Weekly Close: 1.3039
Weekly perspective:
Since the beginning of the year, the USD/CAD has been compressing within an ascending channel formation (1.2247/1.3098). Of late, however, the market observed a mild bearish close around the lower edge of this channel. Providing the sellers remain defensive here, traders could witness a run south this week towards a nearby trend line resistance-turned support (etched from the high 1.4689).
Daily perspective:
In terms of where we stand on the daily timeframe, structure is somewhat restricted at the moment. To the upside, resistance at 1.3096 is seen, while lower on the curve there’s support positioned at 1.2965 (happens to also represent a Quasimodo left shoulder support – red arrow). A breakout of this range has Quasimodo resistance at 1.3218 overhead and support coming in at 1.2815 to the downside.
H4 perspective:
Following Thursday’s consolidation around the key figure 1.30, the pair put in a strong performance on Friday. Healthy USD demand and NAFTA concerns saw price take out August’s opening level at 1.3021, and strike July’s opening level at 1.3045, wrapping up the day closing in the shape of an indecision candle. What’s also notable from a technical perspective is the RSI recently broke above a trend line resistance.
Directly above July’s opening level at 1.3045, we see September’s opening base at 1.3070 that’s fuses with a 38.2% Fib resistance value at 1.3071. Beyond this area, the 1.31 handle is in sight, which unites with daily resistance mentioned above at 1.3096. As you can see, upside is limited for the time being, though so is the downside picture. Support rests around August’s opening level at 1.3021, followed by 1.30.
Areas of consideration:
With intraday movement limited by nearby structure, and longer-term areas not providing much in terms of potential direction right now, taking only the best trades is the path to take!
At current price, the 1.31 handle for shorts is a stand out level, given it fuses with daily resistance. As for supports, there not really much to the downside to shout about, seeing as the next daily support does not come into view until we cross below 1.30.
Today’s data points: US empire state manufacturing index; CAD foreign securities purchases.
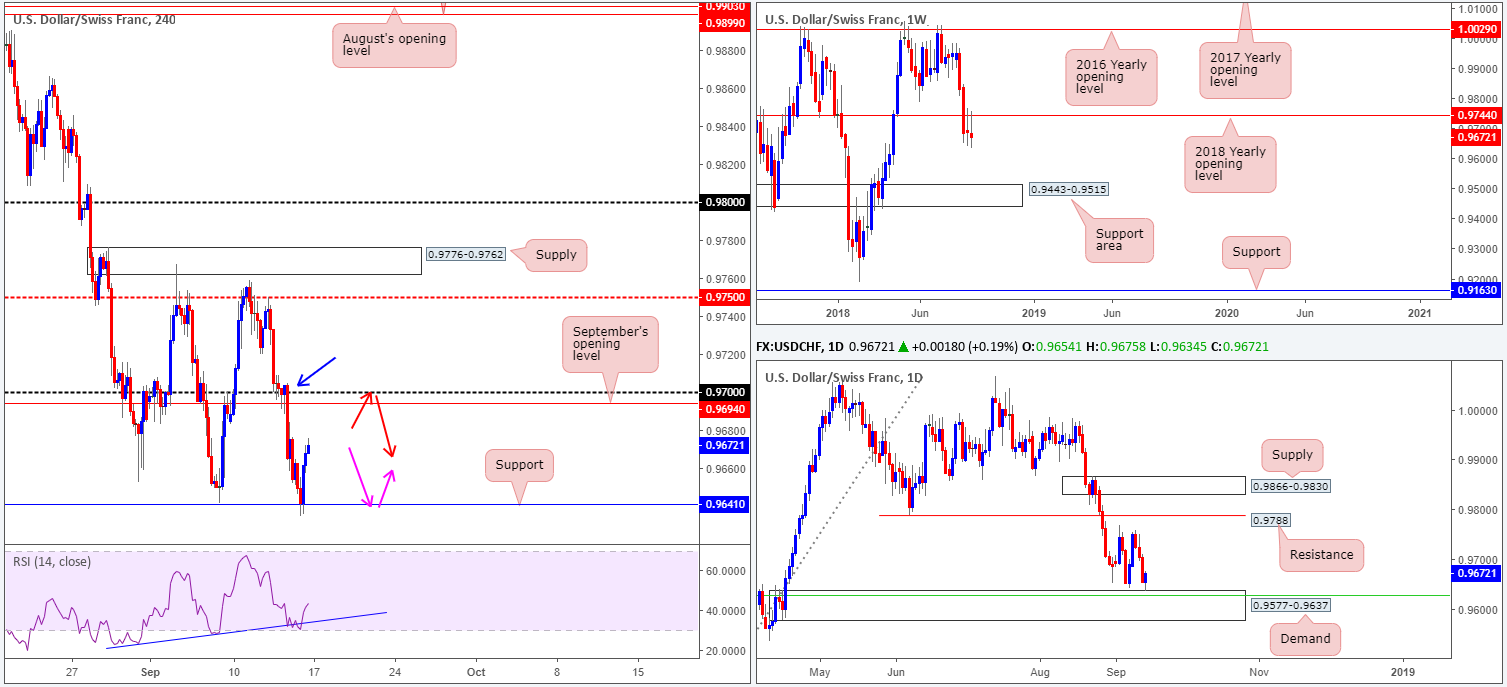
USD/CHF:
Weekly Gain/Loss: -0.17%
Weekly Close: 0.9672
Weekly perspective:
Over the course of last week’s sessions, the market observed an additional retest to the underside of the 2018 yearly opening level at 0.9744. With limited support seen on this scale until reaching the 0.9443-0.9515 area, further downside could still be in store!
Daily perspective:
Focusing the spotlight on the daily timeframe, the pair took out the September 7th low at 0.9641 in the later stages of last week and tested nearby demand at 0.9577-0.9637 (fuses with a 50.0% support value at 0.9627 [green line]). The next upside targets from current price fall in around the September 11th high at 0.9758, shadowed closely by a swing resistance at 0.9788.
H4 perspective:
Broad-based USD buying on Friday prompted a round of short covering from support at 0.9641, which, as you can probably see, is positioned a few pips north of the daily demand base mentioned above at 0.9577-0.9637. Well done to any of our readers who took advantage of this move, as 0.9641 was a noted level to watch for longs in Friday’s briefing. From current price, the next upside targets on the H4 scale fall in at September’s opening level drawn from 0.9694, followed closely by the 0.97 handle. Another key thing to note is the supply area surrounding 0.97 marked with a blue arrow at 0.9704-0.9688.
Areas of consideration:
Although weekly activity is eyeing lower prices, H4 action is likely to reach 0.97. We say this simply because of where we’re coming from on the daily timeframe: demand. However, eyebrows will likely raise should we close above 0.9750, due to this level being bolstered by the current weekly resistance: 0.9744 and also the September 11th high at 0.9758 mentioned on the daily timeframe.
Shorts from 0.97 are an option this week, in view of local confluence. However, waiting for additional candlestick confirmation is practical. Not only will this highlight seller intent, it’ll provide traders a position to place stops.
In the event the market observes a second retest off H4 support at 0.9641 that’s bolstered by additional candlestick confirmation, longs from this region are also tasty, knowing we’re coming from daily demand.
Today’s data points: US empire state manufacturing index.
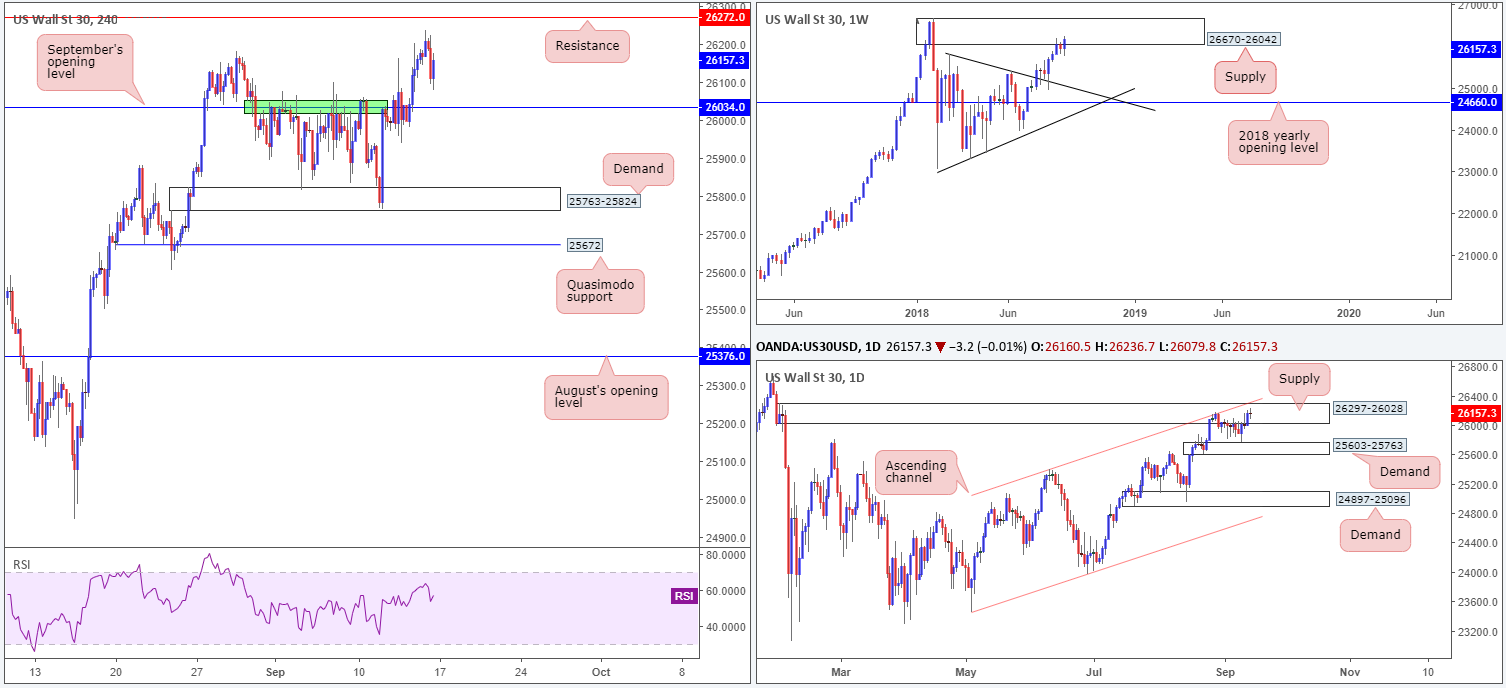
Dow Jones Industrial Average:
Weekly Gain/Loss: +0.82%
Weekly Close: 26157
Weekly perspective:
US equities ended the week in strong fashion, chalking up a nice-looking bullish engulfing formation. Despite this, the index remains toying with the lower range of a supply seen at 26670-26042, following a strong retest off a trend line resistance-turned support (etched from the high 25807) a few weeks back.
Daily perspective:
In terms of the daily timeframe, strong supply at 26297-26028 remains in the fold. What gives this area credibility comes down to the following:
- Downside momentum drawn from the base is incredibly strong.
- The zone intersects with a nearby daily channel resistance (taken from the high 25399).
- Glued to the underside of the aforesaid weekly supply area.
H4 perspective:
In spite of a firm start to the day on Friday, risk appetite diminished amid concerns over Trumps trade policies. As we headed into London hours, the piece began topping just south of a resistance level coming in at 26272, and eventually came within striking distance of testing nearby support molded from September’s opening level at 26034 (note this level offered impressive resistance in early September).
Areas of consideration:
On account of the above reading, two possible trade scenarios are seen going forward:
- Fade H4 resistance at 26272 on the back of a bearish candlestick formation. Why wait for additional candlestick confirmation when both weekly and daily price are trading from supply? The trend in this market is strong, so although there is structure supporting a short on the higher timeframes, the trend has to be taken into consideration as well.
- Attempt to fade September’s opening level mentioned above at 26034. Having noted the strong underlying trend in this market, along with the level holding price lower in the early stages of this month, a long from here is an option. Again, though, waiting for a bullish candlestick confirming pattern to present itself is advised, since from here you are effectively buying into higher-timeframe structure.
Today’s data points: US empire state manufacturing index.
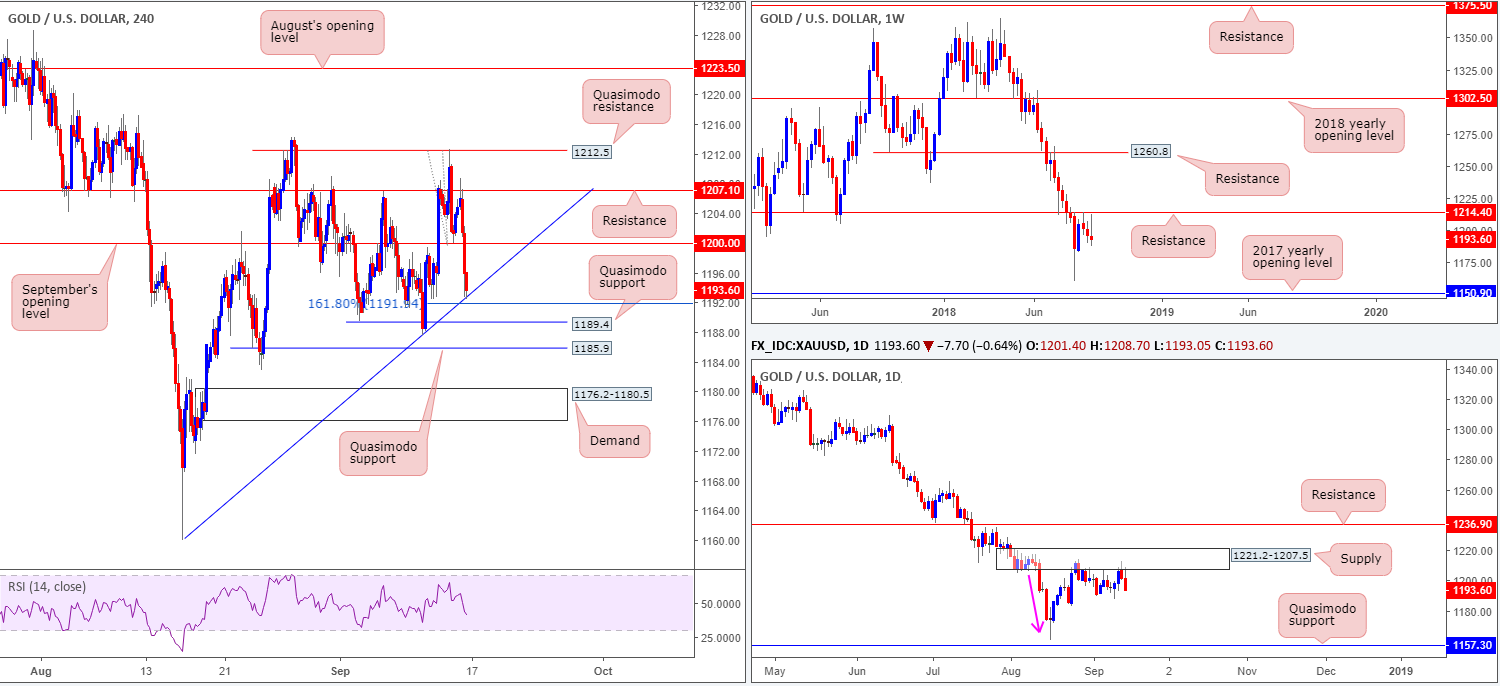
XAU/USD (Gold)
Weekly Gain/Loss: -0.23%
Weekly Close: 1193.6
Weekly perspective:
Registering its third consecutive weekly loss, the yellow metal remains languishing beneath resistance marked at 1214.4. Further downside from this point could eventually stretch as far south as the 2017 yearly opening level at 1150.9.
Daily perspective:
In conjunction with weekly flow, daily movement is seen checking in with a nice-looking supply zone at 1221.2-1207.5. Aside from this zone displaying attractive downside momentum from its base (see pink arrow), it could also be considered the ‘decision point’ to print 2018 yearly lows of 1160.3. Couple this with the fact we are also coming off weekly resistance, we still potentially have ourselves some strong sellers in the mix.
H4 perspective:
As the US Dollar Index found support underneath 94.50 on Friday, traders witnessed bullion selloff from resistance plotted at 1207.1 (converges nearby the underside of daily supply at 1207.5). In the shape of three dominant H4 bearish candles, September’s opening level at 1200.0 was engulfed, leaving the unit free to cross swords with a trend line support (etched from the low 1160.0). Traders may have also noticed this trend line support fuses closely with a 161.8% Fib ext. point at 1191.9 and a nearby Quasimodo support at 1189.4.
Areas of consideration:
Longer term, the daily Quasimodo support at 1157.3 is a logical downside target, followed closely by the 2017 yearly opening level at 1150.9 on the weekly timeframe.
Intraday (H4), on the other hand, displays a number of supportive structures in view right now. The question is, are these areas worthy of long positions knowing where we are coming from on the bigger picture? Probably not. The most we expect from the H4 supports is a bounce at best. With that being the case, shorts from September’s opening level at 1200.0 could be an option today. Entering on the back of a bearish candlestick formation is likely the safer route, as this will provide traders with seller intent and a location to position stops. Using the aforementioned H4 supports as a way to manage the trade is something traders should also consider.
The use of the site is agreement that the site is for informational and educational purposes only and does not constitute advice in any form in the furtherance of any trade or trading decisions.
The accuracy, completeness and timeliness of the information contained on this site cannot be guaranteed. IC Markets does not warranty, guarantee or make any representations, or assume any liability with regard to financial results based on the use of the information in the site.
News, views, opinions, recommendations and other information obtained from sources outside of www.icmarkets.com.au, used in this site are believed to be reliable, but we cannot guarantee their accuracy or completeness. All such information is subject to change at any time without notice. IC Markets assumes no responsibility for the content of any linked site. The fact that such links may exist does not indicate approval or endorsement of any material contained on any linked site.
IC Markets is not liable for any harm caused by the transmission, through accessing the services or information on this site, of a computer virus, or other computer code or programming device that might be used to access, delete, damage, disable, disrupt or otherwise impede in any manner, the operation of the site or of any user’s software, hardware, data or property


