EUR/USD:
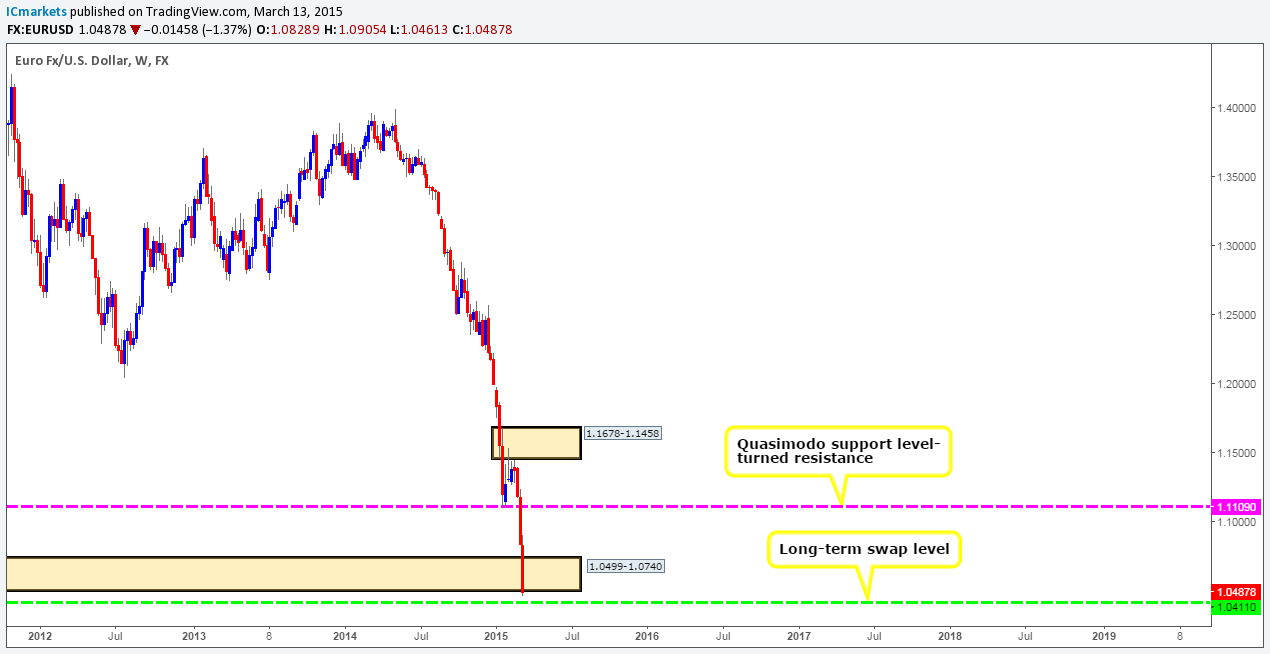
Weekly Timeframe: Last week shows that the Euro depreciated for the third consecutive week losing over 340 pips into the close (1.0487). This move completely wiped out the weekly demand area seen coming in at 1.0499-1.0740, and at the same time, likely opened the doors to further downside towards 1.0411 – a long-term weekly swap level that can be seen stretching as far back as 1997!

Daily Timeframe: (Similar to the weekly analysis) From the daily timeframe we can see that the Euro saw a daily close below 1.0499, a daily swap level, which, if you remember from the weekly timeframe, is the low of the aforementioned weekly demand. This break lower has, like we just mentioned above, likely opened the gates for prices to challenge the aforementioned long-term weekly swap level.

4hr Timeframe: Friday saw the Euro take out the 1.0600 handle, and continue south to engulf the daily swap level mentioned above at 1.0499. This move has very likely consumed any sell stops below this zone, and potentially triggered in any breakout sellers’ orders, thus opening up the possibility that a further decline in value could very well be seen this week down to the 1.0400 region.
Taking all of the above into account, our team’s main focus for today, and possibly into the week,Monday 16th March: Weekly technical outlook and review. will be looking for shorting opportunities. With that, we see two possible entry points:
- Wait to see if price retests the 1.0499 daily swap level as resistance. For us to consider entering short here, we’d need lower timeframe confirming action to be seen, since there is nothing to say that price will not ignore this level and continue on north, which brings us on to the second option…
- A break above 1.0499 would likely force the market northbound towards a 4hr decision-point supply area seen at 1.0633-1.0582. This area looks in a good position to repel the market further south and offers fantastic reward to your risk. That being the case, we have set a pending short order just below at 1.0577 with a stop just above at 1.0641.

Current buy/sell orders:
- Buy orders: Flat (Predicative stop-loss orders seen at: N/A).
- Sell orders: 1.0499 [Tentative – confirmation required] (Predicative stop-loss orders seen at: dependent on where one confirms this level) 1.0577 (Predicative stop-loss orders seen at: 1.0641).
GBP/USD:
Weekly Timeframe: The weekly picture shows that cable declined over 300 pips into the close (1.4725) last week. This move consequently took out both the weekly Quasimodo support level at 1.5007, and a major weekly swap level seen at 1.4832, which, as you can probably see, leaves the weekly demand area seen below at 1.4225-1.4482 clearly in the limelight for the time being.

Daily Timeframe: Friday saw the GBP close below a daily swap level coming in at 1.4774, which likely cleared the path down to a minor daily swap level seen at 1.4652. This level, as far as we can see, remains a key obstacle to a move towards the daily demand area positioned below at 1.4343-1.4465 (located within the aforementioned weekly demand area).

4hr Timeframe: Given that both the weekly and daily timeframes are indicating room for a further decline this week (see above); our team has reported that short trades will be our main focus for the time being.
The recent decent on the 4hr timeframe saw price take out the 1.4800 number, and consequently force price down towards 1.4700, which, as you can see, supported buying into the close. This, on its own, could attract further buying today and push price up to the daily swap level seen marked in red at 1.4774 to be retested as resistance. It would be here that we’d begin watching the lower timeframes for selling confirmation around the 1.4770 mark. However, considering that the 1.4800 number is lingering just above here like a big rain cloud, traders should be prepared for a fake higher before any selling is seen. First-take-profit target for this trade, should a sell signal be seen, comes in at 1.4700.

Current buy/sell orders:
- Buy orders: Flat (Predicative stop-loss orders are seen at: N/A).
- Sell orders: 1.4770 [Tentative – confirmation required] (Predicative stop-loss orders are seen at: dependent on where one confirms this level).
AUD/USD:
Weekly Timeframe: The weekly timeframe shows that the Aussie saw a further decline in value last week, consequently closing (0.7625) deeper within weekly demand at 0.7449-0.7678, and, as you can probably see, below a long-term weekly trendline support as well (0.4775).

Daily Timeframe: From the daily timeframe picture, we can see that although price is located within daily demand at 0.7449-0.7598 (located deep within the aforementioned weekly demand), the buyers failed to clear immediate resistance seen above at 0.7691.

4hr Timeframe: The latest coming in from the 4hr timeframe shows that price sold off beautifully from the 4hr supply area seen at 0.7738-0.7714, consequently forcing the Aussie to hit a 4hr demand area coming in at 0.7572-0.7614.
Given that the higher timeframes are not really showing much in the way of bullish strength at the moment (even though price is located within and around higher-timeframe demand [see above]), buying from this 4hr demand area is something our team is wary of. This is not to say that we would not enter long from here, all it means is that there would have to be very attractive lower timeframe buying confirmation present here for us to risk money trading this zone. In the event that we do find an entry long here, however, we’d look to take partial profits at the small 4hr supply seen above at 0.7692-0.7666, and move our stop to breakeven to allow the rest of our position to run.
Conversely, a break below this 4hr demand zone could confirm further weakness on this pair and likely signal further downside going into the week.

Current buy/sell orders:
- Buy orders: watching for lower timeframe confirmation around 4hr demand at 0.7572-0.7614 (Predicative stop-loss orders seen at: 0.7568).
- Sell orders: Flat (Predicative stop-loss orders seen at: N/A).
USD/JPY:
Weekly Timeframe: The weekly timeframe shows that the USD/JPY pair pierced above December’s high 121.83 last week. This move has, in our opinion, opened the trapdoor for prices to now challenge the weekly Quasimodo resistance level seen just above it at 122.18.

Daily Timeframe: Since Tuesday last week, the buyers and sellers have been seen battling for position around the underside of a daily supply area coming in at 122.61-121.54 (encapsulates the aforementioned weekly Quasimodo resistance level). Assuming that further selling is seen from here this week, price will very likely visit the daily swap level positioned below at 120.45.

4hr Timeframe: Technically, there was not much price movement seen on Friday, therefore, most of our previous analysis still holds.
From looking at the 4hr timeframe, we believe that the 4hr supply seen at 122.01-121.67 could very well be a fake. What do we mean by fake? Well, price reacted nicely to this area once already, thus giving traders the confidence to short here again. However, lurking just above this level, as you can see in green, is the aforementioned weekly Quasimodo resistance level which is just begging to be hit. Therefore, this 4hr supply may have been planted here by pro money to attract millions of traders to place shorts here, and set their buy stops where? You got it! Right above the zone, which will provide a handsome pocket of liquidity i.e. buy stops for well- funded traders to sell into from the weekly level. With this in mind, we have decided to set a pending sell order at 122.16 to try and catch this potential fakeout.
Conversely, if price does not do the above, and continues to trade south, a close below 121.00 is what we’ll be looking for this week, since this will likely open the trapdoor down towards the daily swap level at 120.45. The reason we believe price would drop this far is simply because demand to the left has already likely been consumed – take note of the two obvious demand consumption tails seen marked with blue arrows at 120.83/120.62.

Current buy/sell orders:
- Buy orders: Flat (Predicative stop-loss orders seen at: N/A).
- Sell orders: 122.16 (Predicative stop-loss orders seen at: 122.55).
USD/CAD:
Weekly Timeframe: The current situation on the weekly timeframe shows that the USD/CAD pair closed (1.2766) above the weekly Quasimodo resistance level at 1.2765 by a pip last week! Whether this was enough to clear out the remaining selling opposition here is anybody’s guess. Let’s take a peek at the lower timeframes to see what we can find…

Daily Timeframe: From looking at the daily timeframe, it seems that price is currently being held lower by January’s high 1.2797 at the moment. Although price has broken above this hurdle, we are yet to see a daily close, which is what we’d need to confirm that bullish strength is entering the market around the aforementioned weekly Quasimodo resistance level.

4hr Timeframe: The 4hr timeframe shows that price closed above the aforementioned weekly Quasimodo resistance level late on Friday and attacked the 1.2800 barrier, which, as you can see, was clearly too strong for the buyers to overcome. This consequently forced the market to retest the weekly level into the close.
Taking all of the above into account, our team has come to a general consensus that no buy trades shall be initiated in this market until we see price firmly close above the 1.2800 handle.
However, should price decline in value today, we’ll be looking for supportive pressure to come into the market at a small 4hr decision-point demand area seen at 1.2698-1.2725. In the event that this area is breached, we’ll then shift our attention to begin looking for shorting opportunities.

Current buy/sell orders:
- Buy orders: Flat (Predicative stop-loss orders seen at: N/A).
- Sell orders: Flat (Predicative stop-loss orders seen at: N/A).
USD/CHF:
Weekly Timeframe: Further upside was seen on the USD/CHF last week causing the pair to rally over 170 pips into the close (1.0044). This move consequently forced the market to pierce a weekly Quasimodo resistance level at 1.0065, and hit a weekly supply area seen just above it at 1.0239-1.0131, which, as you can probably see, was the area at where the SNB fiasco began.

Daily Timeframe: Since Wednesday last week, price has been seen consolidating just below the weekly supply area mentioned above at 1.0239-1.0131. Should a selloff be seen from here, price will likely visit a small daily decision-point demand area coming in at 0.9823-0.9873.

4hr Timeframe: At the time of writing, price is seen capped between the 1.0100 handle and a small, yet clearly resilient 4hr decision-point demand area seen at 0.9968-0.9998.
A break above 1.0100 could potentially open the doors to further upside towards a small 4hr supply area coming in at 1.0219-1.0187, which is, give or take a few pips, the point at where the humongous sell off begun on that dark day of January 15th. For anyone who is considering buying if a breakout north is seen, please remain aware that you would very likely be buying from higher-timeframe weekly sellers (see above) at that point.
Conversely, should price close below the aforementioned 4hr decision-point demand area sometime this week, this would, in effect, be our cue to begin watching for price to retest this area as supply, since the path south would then likely be clear down to at least 0.9900.

Current buy/sell orders:
- Buy orders: Flat (Predicative stop-loss orders seen at: N/A).
- Sell orders: Flat (Predicative stop-loss orders seen at: N/A).
DOW 30:
Weekly Timeframe: The weekly timeframe shows that DOW Jones index saw further downside last week. In the event that the sellers can continue with this intensity, we might, just might, see price retest the ignored weekly Quasimodo level at 17135 again.

Daily Timeframe: From the pits of the daily timeframe we can see that price is currently ranging between a daily demand area coming in at 17561-17655, and a daily decision-point supply area seen at 18029-17864.
A break lower here could very well force price to sell off down to a daily demand area coming in at 17032-17186 (encapsulates the aforementioned ignored weekly Quasimodo level).On the flip side, should a break higher be seen, price will likely to test immediate supply seen above at 18160-18080.

4hr Timeframe: For those who read our recent reports on the DOW, you may recall that we had a live buy order in the market from 17625, set just above 4hr demand at 17561-17617 (located deep within daily demand mentioned above at 17561-17655), which, as you can see, moved nicely into profit before aggressively selling off back down to where we initially bought. Fortunately, we closed the full position at the 4hr swap level seen at 17821.
Buying for a second time around this 4hr demand area is most certainly valid in our opinion. Nonetheless, we would not enter long here without confirmation from the lower timeframes since the first touch, the one we bought into, has likely consumed buying pressure and potentially weakened the upper limit of this zone. In the event that a close below this area is seen, however, we’ll then shift our attention to looking for shorts down to the fresh 4hr demand coming in at 17285-17350.
On the sell side of this market we see two areas of interest:
- The 4hr supply area seen at 17902-17868. This area is fresh and is located just within the daily decision-point supply area coming in at 18029-17864. This barrier will, if price reaches this high, likely see a nice bounce. However, trading this area with a pending order may not be the best path to take, simply because there is a far better-looking supply seen just above, so lower timeframe selling confirmation is advised here.
- The 4hr supply area seen at 18029-17971 is very attractive as it is not only fresh, but is also located VERY DEEP within the aforementioned daily decision-point supply area. Our team has deemed this area worthy of a pending sell order, which has been set at 17962 with a stop just above at 18036.

Current buy/sell orders:
- Buy orders: waiting for lower timeframe confirmation around the 4hr demand area at 17561-17617 (Predicative stop-loss orders seen at: 17553).
- Sell orders: 17902-17868 [Tentative – confirmation required] (Predicative stop-loss orders seen at: 17909) 17962 (Predicative stop-loss orders seen at: 18036).
XAU/USD (Gold):
Weekly Timeframe: The weekly timeframe shows that price closed below a weekly demand area at 1166.8-1195.0 last week. Assuming that the sellers can hold out below this zone, we feel there’s a good chance that further downside will be seen towards the weekly decision-point demand level coming in at 1136.3.

Daily Timeframe: Following the pin-bar retest of the daily Quasimodo support (now resistance) level at 1170.5 on Monday, Gold continued to sell off for the best part of last week. Quite frankly (as per the daily and weekly timeframes), we do not see it stopping this week until price hits the small daily demand area coming in at 1131.4-1141.5 (encapsulates the aforementioned weekly decision-point demand level). The reason for this is simply because we see very little active demand to the left of current price. It will be interesting to see what the 4hr timeframe makes of this…

4hr Timeframe: The 4hr timeframe on the other hand, shows that price is currently ranging between a 4hr demand area seen at 1142.6-1152.1 and a small 4hr supply area coming in at 1165.1-1161.2.
A break above this consolidation would likely attract further upside towards the daily Quasimodo level mentioned above at 1170.5, which, in our opinion, could be a number to keep an eye on for selling opportunities this week should price reach this high. A convincing close above 1170.5, however, would be our cue to begin watching for price to retest this level as support.
On the other hand, a break below this range would immediately see price test the daily demand area mentioned above at 1131.4-1141.5. It would be at this point that we’d start observing the lower timeframes for buying confirmation around the 1142.0 mark.

Current buy/sell orders:
- Buy orders: 1142.0 [Tentative – confirmation required] (Predicative stop-loss orders seen at: 1130.0).
- Sell orders: 1170.5 [Tentative – confirmation required] (Predicative stop-loss orders seen at: dependent on where one confirms this level).


