
A note on lower-timeframe confirming price action…
Waiting for lower timeframe confirmation is our main tool to confirm strength within higher timeframe zones, and has really been the key to our trading success. It takes a little time to understand the subtle nuances, however, as each trade is never the same, but once you master the rhythm so to speak, you will be saved from countless unnecessary losing trades. The following is a list of what we look for:
- A break/retest of supply or demand dependent on which way you’re trading.
- A trendline break/retest.
- Buying/selling tails/wicks – essentially we look for a cluster of very obvious spikes off of lower timeframe support and resistance levels within the higher timeframe zone.
- Candlestick patterns. We tend to stick with pin bars and engulfing bars as these have proven to be the most effective.
We typically search for lower-timeframe confirmation between the M15 and H1 timeframes, since most of our higher-timeframe areas begin with the H4. Stops are usually placed 3-5 pips beyond confirming structures.
EUR/USD:
Weekly gain/loss: + 49 pips
Weekly closing price: 1.0670
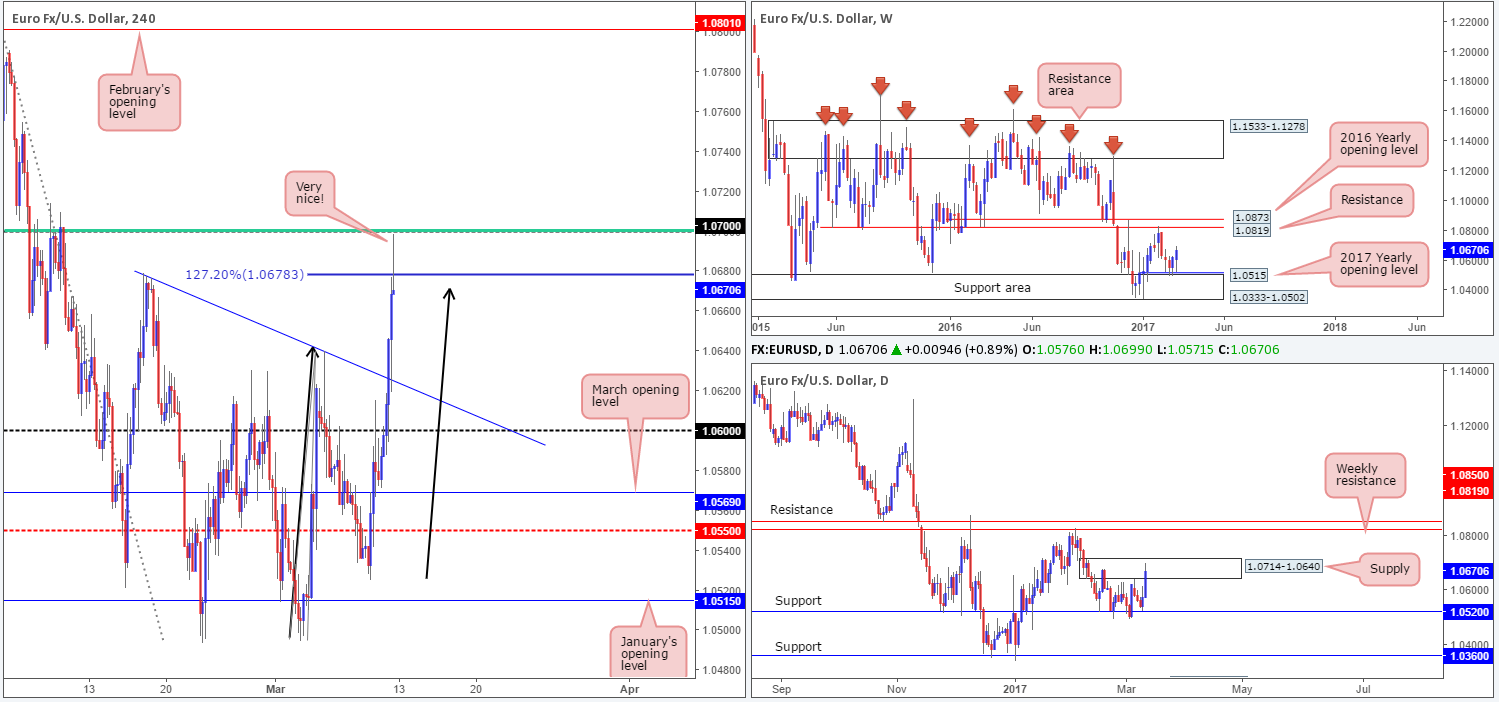
The EUR/USD market enjoyed another relatively successful week, increasing its value by a further 50pips into the closing bell. As you can see, the weekly support area at 1.0333-1.0502 and nearby 2017 yearly opening level at 1.0515 has so far held firm. Assuming that the bulls remain in the driving seat here, the next pit stop can be seen around a weekly resistance level at 1.0819, followed closely by the 2016 yearly opening level at 1.0873.
The story on the daily chart, however, shows that price is currently seen trading within the walls of a daily supply zone coming in at 1.0714-1.0640. This area has already capped upside once back on the 16th Feb and again on the 6th Mar, so there’s a chance we may see history repeat itself here. In the event that this area is taken out, as the weekly timeframe suggests, traders’ crosshairs will likely be planted on the above noted weekly resistance level.
The after-effects of Friday’s US employment report saw the EUR advance against its US counterpart, and end the day tapping a high of 1.0699.The US economy created 235k jobs in Feb, coming in above estimates at 196k. The unemployment rate came in as expected at 4.7% and hourly earnings came in slightly lower than expected at 0.2%.
Our suggestions: Besides taking out the H4 trendline resistance etched from the high 1.0679, Friday’s advance also happened to form a D-leg to a H4 Harmonic AB=CD bearish formation (black arrows), with the 127.2% H4 Fib ext. pegged at 1.0678. On top of this, we also have the following structures in view: a nearby psychological level at 1.07, a H4 61.8% Fib retracement taken from the high 1.0828, a H4 bearish selling wick printed into the close and let’s not forget that all of this is positioned within the aforementioned daily supply zone! Based on this H4 and daily confluence, a selloff could very well be seen today. How much of a selloff, nonetheless, is difficult to judge as let’s be mindful to the fact that the weekly candles do show room to gravitate higher this week.
With everything taken into consideration, our desk has come to a general consensus that a sell trade on the break of the current H4 bearish (selling wick) candle is valid, targeting the nearby H4 trendline support taken from the high 1.0679 as an initial take-profit target. The safest position for stops, in our opinion, would be above the top edge of the daily supply zone coming in at 1.0714.
Data points to consider: ECB President Draghi speaks at 1.30pm GMT.
Levels to watch/live orders:
- Buys: Flat (stop loss: N/A).
- Sells: Sell on the break of the current H4 bearish selling wick (stop loss: 1.0716).
GBP/USD:
Weekly gain/loss: – 130 pips
Weekly closing price: 1.2163
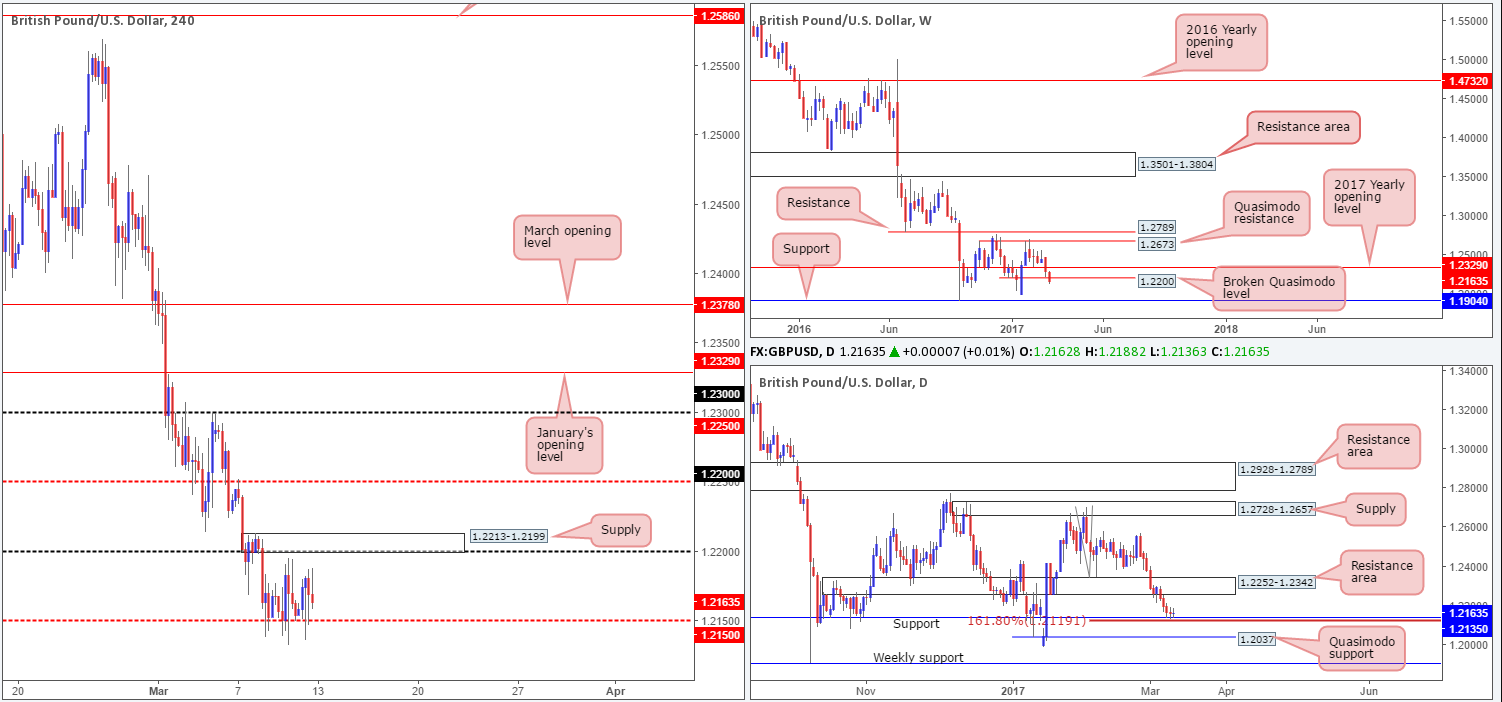
Over the last week, we can see that the weekly bears breached and eventually closed beyond the weekly Quasimodo support at 1.22 (now a potential resistance). On the condition that the pair remains bearish beyond this hurdle, then the next port of call on this scale can be seen around weekly support coming in at 1.1904.
Turning our attention to the daily chart, the unit recently formed two back-to-back indecision candles at daily support drawn from 1.2135, followed closely by the 161.8% Fib ext. at 1.2119 taken from the high 1.2706. A violation of these two supports may call for price to challenge the nearby daily Quasimodo support at 1.2037. Conversely, should the bulls remain on the offensive here, the next area of interest falls in at 1.2252-1.2342 (a resistance zone).
Although Friday’s US employment report triggered a wave of buying off the H4 mid-way support level at 1.2150, there was very little follow-through generated. As you can see, the H4 candles have been teasing the 1.2150 barrier since Wednesday and have made very little attempt to break above the nearby H4 supply zone seen overhead at 1.2213-1.2199 (encapsulates the 1.22 handle/weekly broken Quasimodo support line).
Our suggestions: As of this time, we do not see much to hang our hat on at the moment. Even with a H4 close above the current H4 supply zone, there is not a lot of room seen for this unit to advance given the H4 mid-way resistance at 1.2250. A decisive close below 1.2150 on the other hand likely clears the path south down to the H4 demand at 1.2017-1.2062, which happens to intersect nicely with the daily Quasimodo support at 1.2037. Therefore, one could look to short beyond this mid-level number (waiting for price to retest the underside of this barrier, which is preferably followed up with a H4 bear candle is advised) down to this H4 demand.
Data points to consider: There are no high-impacting events affecting either the GBP or the US dollar today.
Levels to watch/live orders:
- Buys: Flat (stop loss: N/A).
- Sells: Watch for price to engulf 1.2150 and then look to trade any retest seen thereafter ([wait for a reasonably sized H4 bearish close to form before looking to pull the trigger] stop loss: ideally beyond the trigger candle).
AUD/USD:
Weekly gain/loss: – 59 pips
Weekly closing price: 0.7534
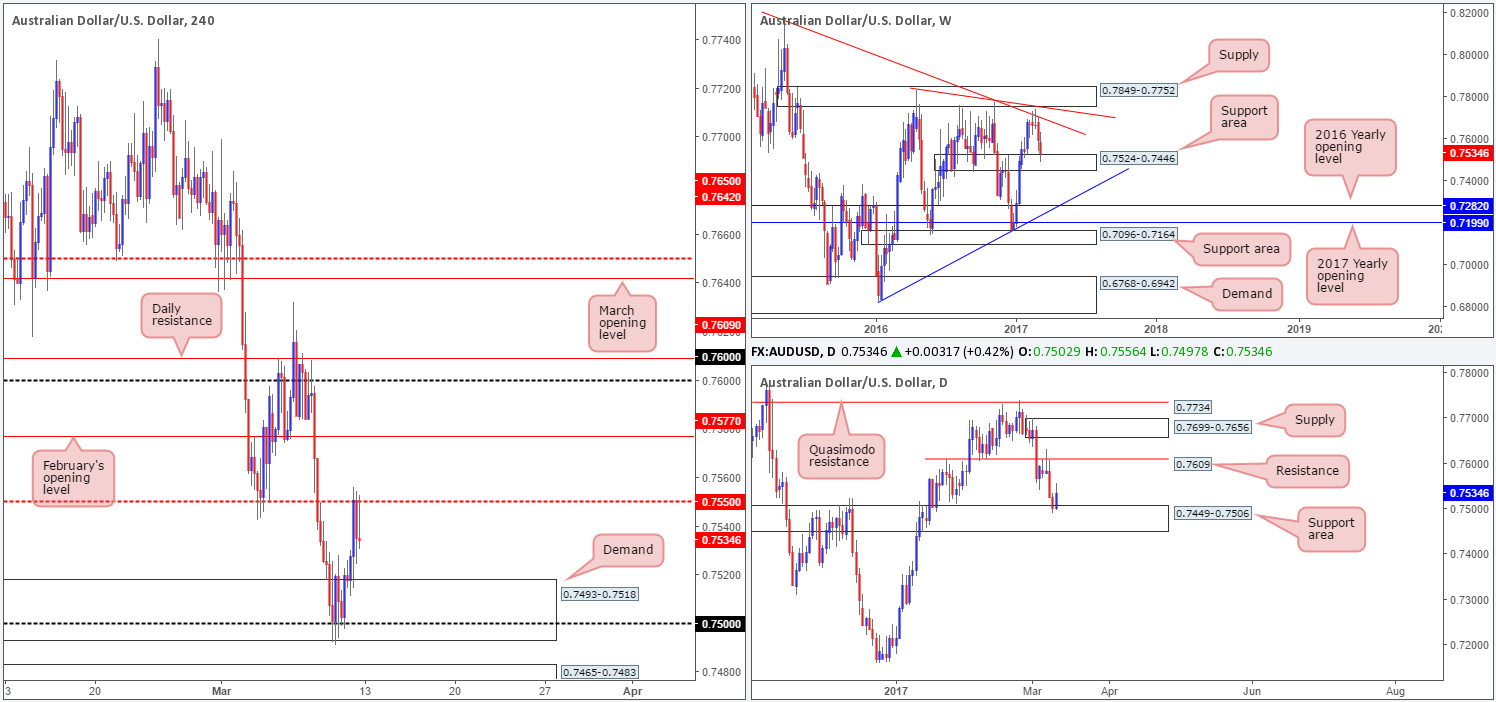
(Trade update: the long trade taken from 0.7520 on Thursday was cashed in at the 0.7550 barrier following the US job’s report on Friday).
The commodity currency sustained further losses last week, resulting in the unit crossing swords with a weekly support area formed from 0.7524-0.7446. In consequence to this, we could very well see the buyers make an appearance from here this week.
In a similar fashion to the weekly chart, the daily candles have also connected with the top edge of a daily support area drawn from 0.7449-0.7506. This area, as you can probably see, happens to be sited within the above noted weekly support area. This – coupled with Friday’s fairly strong-looking daily bullish rotation candle, could see the buyers potentially move into a higher gear here!
Stepping across to the H4 scale, the impact of the better-than-expected US non-farm payrolls data drove prices skyward on Friday. This brought the H4 mid-way resistance 0.7550 back into the picture which managed to hold firm into the close.
Our suggestions: In view of the higher-timeframe structure, we would typically be looking for longs above 0.7550. However, with February’s opening level at 0.7577 lurking just ahead, followed closely by the 0.76 handle and daily resistance at 0.7609, buying this market is challenging! As you can see, there is not much in the way of a tradable setup on the Aussie at present. Therefore, we’ll await further developments on the sidelines today.
Data points to consider: There are no high-impacting events affecting either the Australian dollar or the US dollar today.
Levels to watch/live orders:
- Buys: Flat (stop loss: N/A).
- Sells: Flat (stop loss: N/A).
USD/JPY:
Weekly gain/loss: – 75 pips
Weekly closing price: 114.77
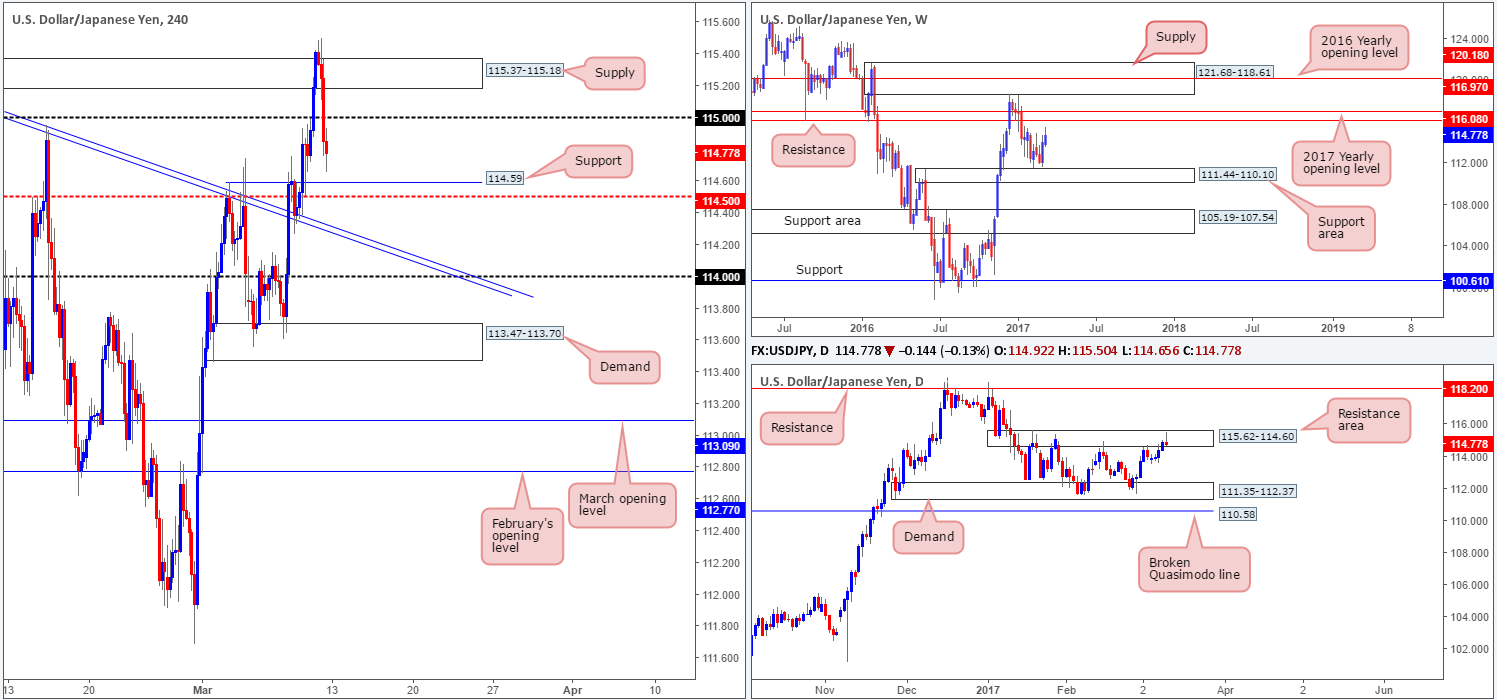
The USD/JPY closed marginally higher last week, managing to hit a high of 115.50. Although a minor end-of-week correction was seen, the pair still looks to be on course to connect with the nearby weekly resistance level at 116.08, followed closely by the 2017 yearly opening level at 116.97.
On the other side of the ledger, the daily candles remain trading within the walls of a daily resistance area coming in at 115.62-114.60. Also noteworthy here is Friday’s candle printed a nice-looking daily bearish selling wick which, to the majority of candlestick traders, is likely considered a sell signal.
A brief look at recent dealings on the H4 chart shows that there was little response seen from the candles following the release of Friday’s US job’s report. Nevertheless, the pair did end up selling off an hour or so later, taking out the 115 psychological level and closing the week just ahead of a H4 support registered at 114.59/H4 mid-way support at 114.50.
Our suggestions: While the weekly timeframe suggests that buying from the current H4 support region is valid, the daily timeframe indicates that further selling could be on the cards. A buy from here is a risky trade in our book, and not really something we would want to get involved in. Selling from 115 on any retest seen also has the same problem. Although you’d effectively be selling with daily flow, you would, at the same time, potentially be placing yourself against weekly opposition! In light of this, our team will humbly step aside during today’s trading and reassess going into Tuesday’s opening.
Data points to consider: There are no high-impacting events affecting either the US dollar or Japanese Yen today.
Levels to watch/live orders:
- Buys: Flat (stop loss: N/A).
- Sells: Flat (stop loss: N/A).
USD/CAD:
Weekly gain/loss: + 86 pips
Weekly closing price: 1.3461
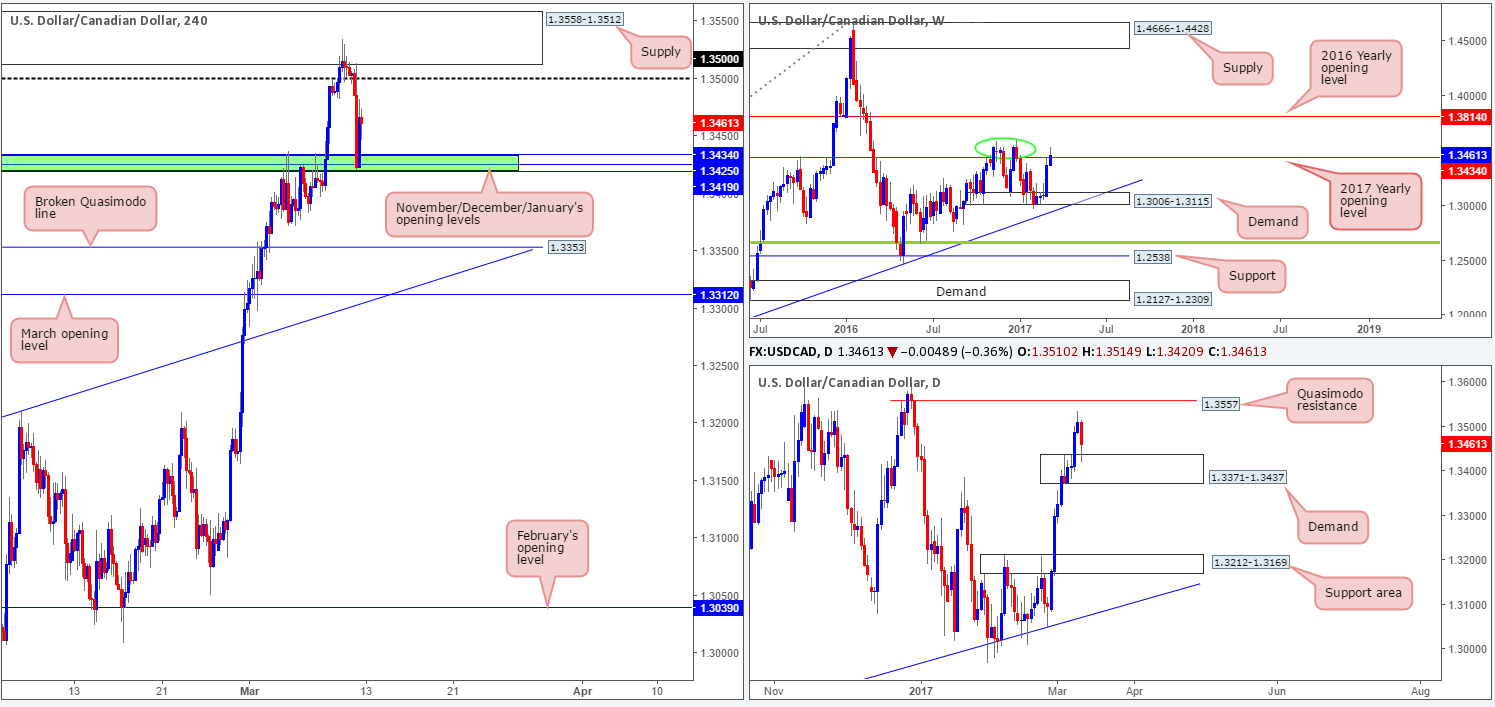
The USD/CAD continued to move north last week and managed to marginally close beyond the 2017 yearly opening level at 1.3434. Since the close above this line is relatively minor, and taking into account that there is a nearby weekly double-top formation seen around the 1.3588 region (green circle), we do not consider 1.3434 to be out of the picture as a resistance just yet!
Zooming in and looking at the daily picture, price came within striking distance of clipping a daily Quasimodo resistance level at 1.3557 before aggressively dropping down to test a daily demand coming in at 1.3371-1.3437. In order for the weekly bears to succeed in pressing lower this daily area would need to be engulfed. Beyond this zone, our team sees reasonable space for price to move lower with the next downside target not coming into the picture until the support area at 1.3212-1.3169.
After price shook hands with the H4 supply zone at 1.3558-1.3512, and closed back below the 1.35 handle we saw the piece drive down to the 1.3419/1.3434 region (November/December/January’s opening levels). As can be seen from the chart, the zone held beautifully and rebounded price into the closing bell. This downside move was fuelled by a round of upbeat Canadian labor market figures and a mixed dose of US employment data.
Our suggestions: In a nutshell, the structure of this pair can be boiled down to the following:
- Weekly action suggests that the bears could come into play.
- Daily price is trading from demand so this evidently favors the bulls.
- And H4 flow is currently seen capped between 1.3419/1.3434 and the 1.35 handle.
Ultimately, we will not be happy selling this market until the current daily demand is out of the picture. Despite this, a break below 1.3419/1.3434 may entice sellers down to the H4 broken Quasimodo support at 1.3353 since, other than the 1.34 barrier, we see very little active H4 demand to the left of price. In regards to buying this unit, we feel it would just be too much of a risk considering the weekly structure noted above.
Data points to consider: There are no high-impacting events affecting either the US dollar or Canadian dollar today.
Levels to watch/live orders:
- Buys: Flat (stop loss: N/A).
- Sells: Flat (stop loss: N/A).
USD/CHF:
Weekly gain/loss: + 30 pips
Weekly closing price: 1.0105
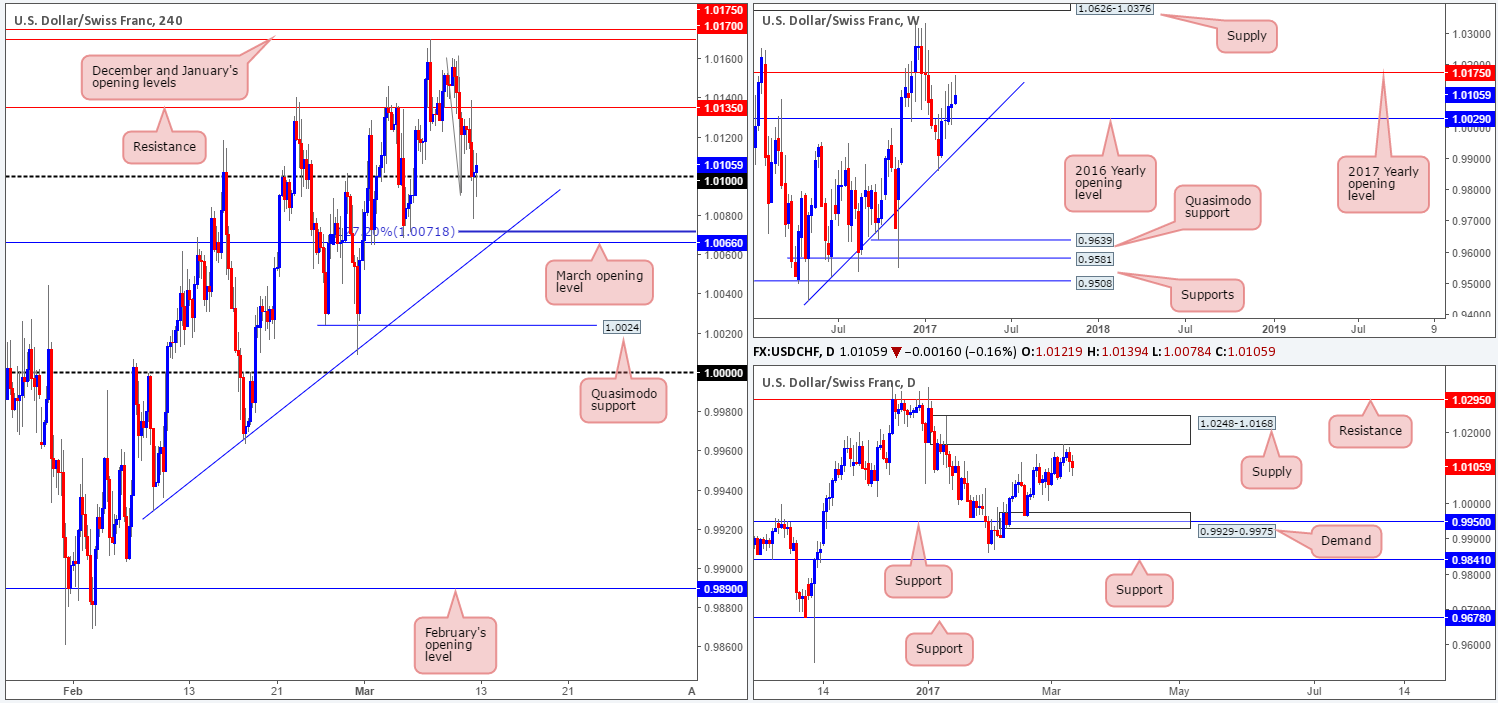
Despite back-to-back weekly selling wicks, the weekly candles continue to gravitate northbound. Last week, nonetheless, the unit came within striking distance of the 2017 yearly opening level at 1.0175, which could be enough to force weekly action lower this week.
Turning over a page to the daily timeframe, Tuesday saw price clip the underside of a daily supply coming in at 1.0248-1.0168 and climb lower. We do not see much active demand to the left of current price until the pair reaches the daily demand pegged at 0.9929-0.9975, which happens to intersect with a daily support level seen at 0.9950.
Analyzing Friday’s sessions on the H4 chart shows that price tagged H4 resistance at 1.0135 and sold off down to the 1.01 handle, following the US employment report. As of this point, 1.01 remains firm, but given the higher-timeframe structure and how deep price breached the psychological boundary, we may see the unit trade lower today.
Our suggestions: Despite the higher timeframes suggesting that a downside move is potentially at hand, we have an interesting number seen directly below on the H4 chart at 1.0066: March opening level. This number also boasts H4 trendline confluence from the low 0.9929 and a H4 127.2% Fib ext. at 1.0071. While this confluence is attractive and will likely bounce price, we will pass on buying from here. Entering long against the higher-timeframe technicals and also considering that we have little wiggle room from here until price connects back up with 1.01 is not really something we can get excited about. Given these factors, we may remain on the sidelines today.
Data points to consider: There are no high-impacting events affecting either the US dollar or Canadian dollar today.
Levels to watch/live orders:
- Buys: Flat (stop loss: N/A).
- Sells: Flat (stop loss: N/A).
DOW 30:
Weekly gain/loss: – 103 points
Weekly closing price: 20887
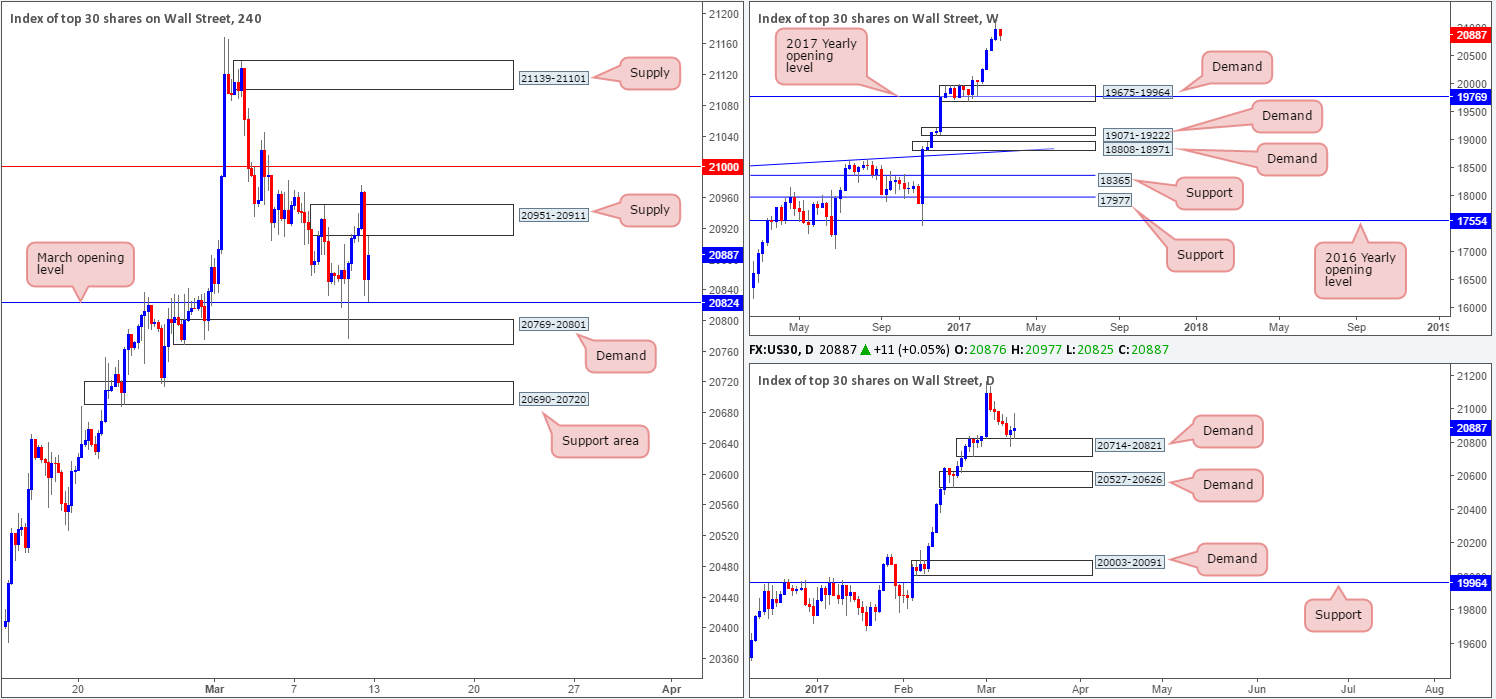
The US equity market printed its first losing week since early Feb last week. The bearish close is not something we would label significant, however, seeing as how price remained within the prior week’s range and sported a minor end-of-week bullish correction. With equities still seen trading nearby record highs, where do we go from here? Well, given that there is absolutely no weekly resistance levels in sight, the best we can do for the time being is continue looking to ‘buy the dips’. The closest higher-timeframe area can be seen at 20714-20821: a daily demand zone, which is currently in play as we write.
Looking over to the H4 chart, we can see that the H4 candles whipsawed above the H4 supply zone coming in at 20951-20911 shortly after the release of Friday’s US employment report. The knee-jerk reaction was a short-lived one, however, with the piece ending the week tapping the March opening level seen below at 20824.
Our suggestions: In essence, our team is still in favor of the index rallying higher. Be that as it may, the H4 supply at 20951-20911 and nearby 21000 line would need to be taken out beforehand. Therefore, until we see a H4 close print above these areas, we will not be considering positions in this market.
Data points to consider: There are no high-impacting events that should affect this market today.
Levels to watch/live orders:
- Buys: Watch for price to engulf 21000 and then look to trade any retest seen thereafter (waiting for a lower-timeframe confirming signal to form [see the top of this report] following the retest is advised] stop loss: dependent on where one confirms the level).
- Sells: Flat (stop loss: N/A).
GOLD:
Weekly gain/loss: – $30
Weekly closing price: 1204.3
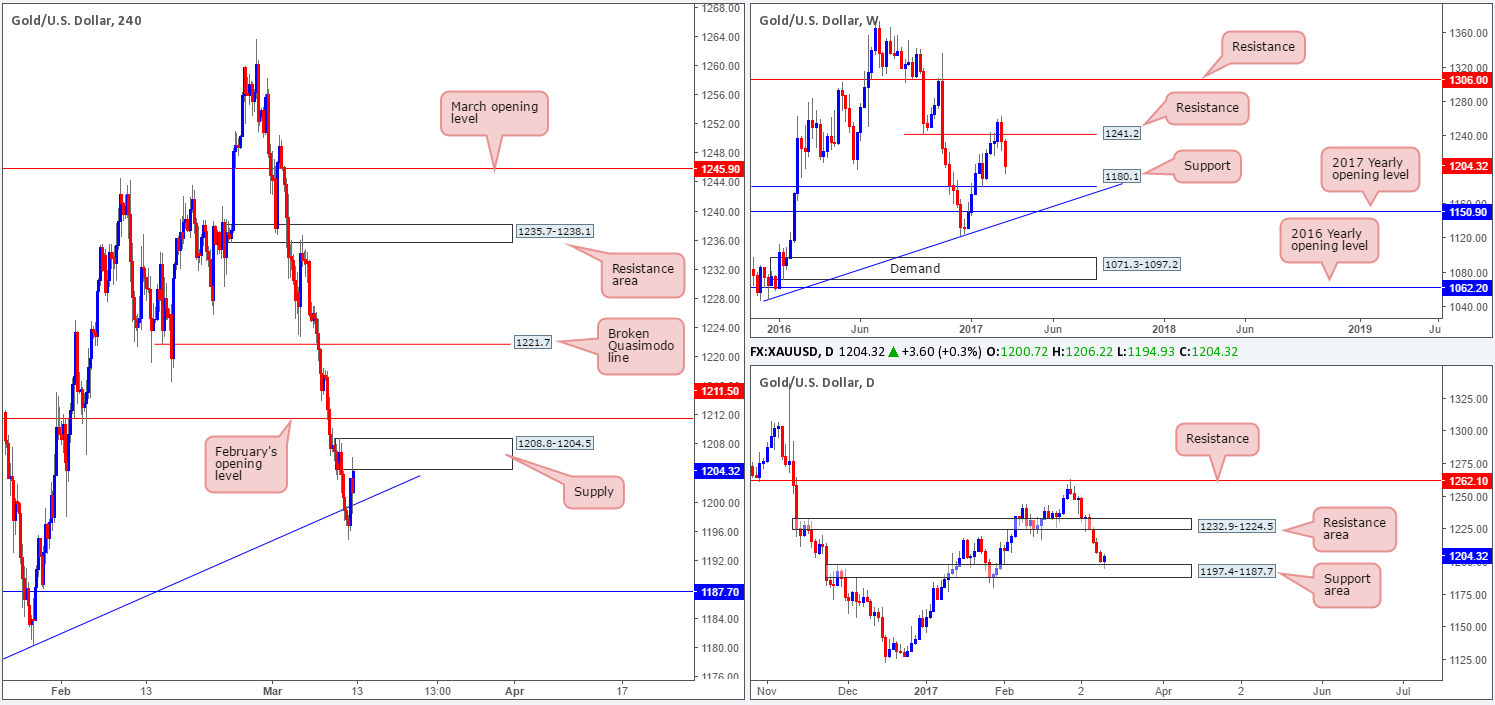
The gold market was really hit hard last week, losing around $30 in value! And, according to the weekly structure, price could potentially continue driving lower until we reach the weekly support level drawn from 1180.1. Despite this, there is also a chance that the yellow metal may recover some of its recent losses this week as daily action recently tested the top edge of a daily support area drawn in at 1197.4-1187.7.
Swinging over to the H4 chart, bullion was pulled higher on the back of Friday’s US employment report. This, as you can see, brought the unit back up into the jaws of a H4 supply zone seen at 1208.8-1204.5, which right now, is seen holding ground.
Our suggestions: Given the conflicting signals seen from the weekly and daily timeframes, this remains a difficult market to read. For all intents and purposes, neither a long nor short seems attractive at this time. Personally, we may just hang fire for the moment and look to reassess structure going into tomorrow’s opening.
Levels to watch/live orders:
- Buys: Flat (stop loss: N/A).
- Sells: Flat (stop loss: N/A).


