
A note on lower timeframe confirming price action…
Waiting for lower timeframe confirmation is our main tool to confirm strength within higher timeframe zones, and has really been the key to our trading success. It takes a little time to understand the subtle nuances, however, as each trade is never the same, but once you master the rhythm so to speak, you will be saved from countless unnecessary losing trades. The following is a list of what we look for:
- A break/retest of supply or demand dependent on which way you’re trading.
- A trendline break/retest.
- Buying/selling tails/wicks – essentially we look for a cluster of very obvious spikes off of lower timeframe support and resistance levels within the higher timeframe zone.
- Candlestick patterns. We tend to only stick with pin bars and engulfing bars as these have proven to be the most effective.
We search for lower timeframe confirmation between the M15 the H1 timeframes, since most of our higher-timeframe areas begin with the H4. Stops are usually placed 5-10 pips beyond confirming structures.
EUR/USD:
Weekly gain/loss: – 115 pips
Weekly closing price: 1.1246
Weekly opening price: 1.1246
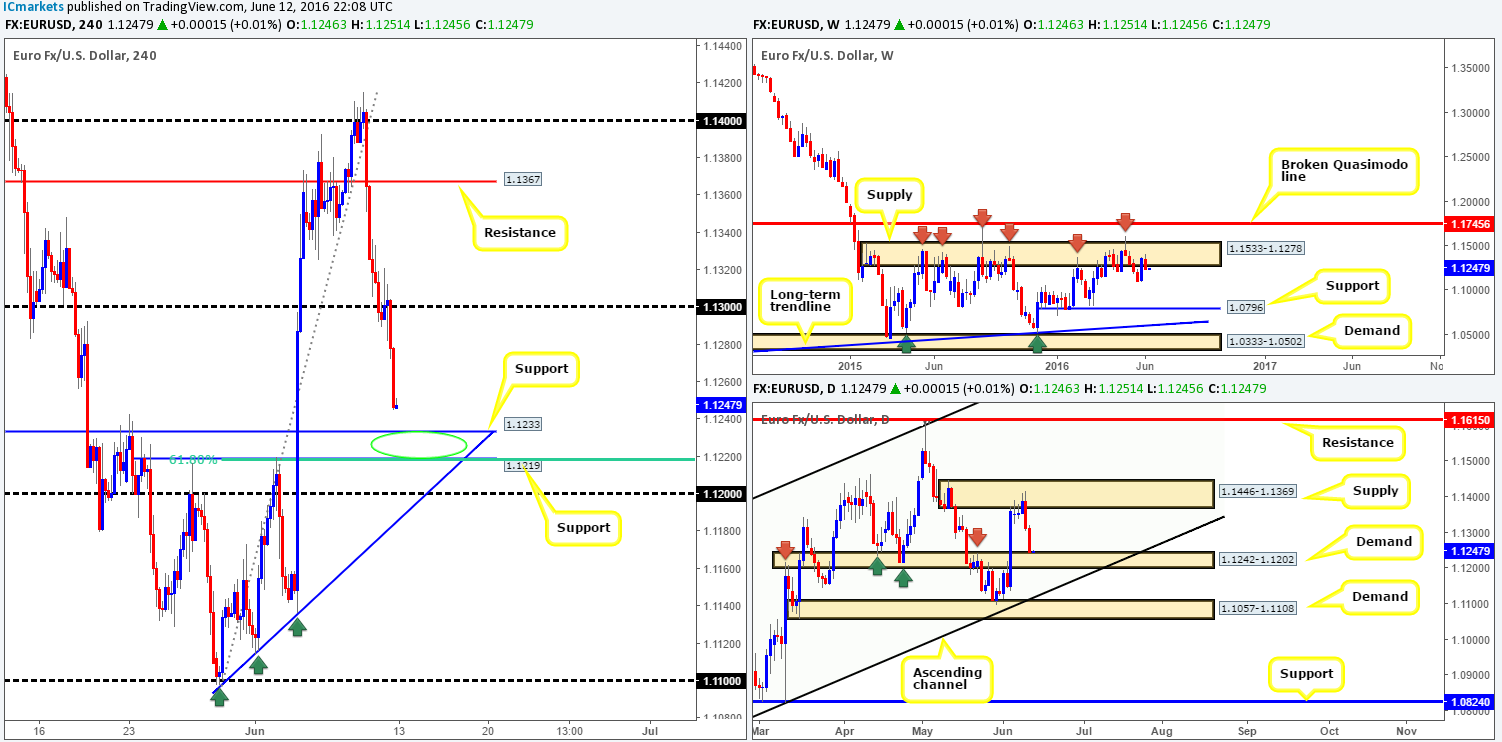
Weekly view: As we can all see from the weekly chart this morning, the EUR/USD remains trading from supply seen at 1.1533-1.1278. Due to this area capping upside since May 2015 (see red arrows), we feel that the shared currency will eventually touch base with support penciled in at 1.0796 in the near future.
Daily view: Before price can head lower, however, we can see that daily action is now flirting with the top-side of a demand area logged in at 1.1242-1.1202. This area has proved a relatively significant zone over the past three months, so a reaction from here is possible despite the location of weekly price (see above). The next upside target to keep a tab on from here can be seen at supply drawn from 1.1446-1.1369.
H4 view: Over on the H4 chart the EUR continued to slide lower on Friday, following a rather aggressive retest of the 1.13 handle. This resulted in price closing the day on its lows at 1.1246, just ahead of support at 1.1233. With little change seen going into this morning’s open, what’s likely in store for this market today/this week?
Well, for a bounce we like the look of 1.1219/1.1233, which is composed of two supports, a converging 61.8% Fib support (green circle) and is also bolstered by the above said daily demand. Ultimate targets from this zone, at least for us, would be the 1.13 handle. The reason for not targeting higher than this line simply comes down to the weekly picture. With such a large weekly supply zone (see above) looming over this pair, it is very difficult to be bullish long-term unless of course the area is consumed!
For those considering entering long from our H4 buy zone (the green circle) this week, we would strongly advise only doing so with the backing of lower timeframe confirmation. This could be in the form of an engulf of supply followed by a retest, a trendline break/retest or simply a collection of buying tails around support. Stops are usually placed 5-10 pips beyond confirming structures to give the trade room to breathe.
Levels to watch/live orders:
- Buys: 1.1219/1.1233 [Tentative – confirmation required] (Stop loss: dependent on where one confirms this area).
- Sells: Flat (Stop loss: N/A).
GBP/USD:
Weekly gain/loss: – 261 pips
Weekly closing price: 1.4250
Weekly opening price: 1.4266
Weekly view: Last week’s sharp run to the downside pushed cable into further losses, stripping 260 pips off its value. As a result, price is now seen nibbling at the top-side of a demand area formed from 1.4005-1.4219, which fuses with a broken Quasimodo line at 1.4051. Therefore, given this structure, we feel this market may reverse tracks this week and trade higher…
Daily view: From this viewpoint, last week’s selling saw bids removed from demand at 1.4297-1.4393 (now acting supply), allowing price to jab into fresh bids around demand coming in at 1.4090-1.4195 by the week’s end. Despite the small end-of-week correction seen from here, there is a chance we may see price whipsaw through this demand to touch ground with a Quasimodo support at 1.4052 that aligns almost perfectly with the above said weekly broken Quasimodo line.
H4 view: With 55% of Brits favoring a ‘Brexit’ according to latest polls on Friday, the pound continued to lose ground. This ended with the struggling currency jabbing into the 1.42 handle, which, as you can see, is bolstered by a minor Fib cluster (61.8% Fib level taken from the low 1.3835 and also a 78.6% Fib taken from the low 1.4005).
Following this, GBP saw a sixteen-pip gap north this morning which was quickly filled as the bears continue to pressure this market. However, with the weekly, daily and H4 charts showing price trading from structure right now (see above in bold), buying from the 1.42 level could be an option today. However, in that this is a rather sensitive market due to the upcoming EU referendum, we would only take long positions based on sound lower timeframe confirming price action (see the top of this report for confirming techniques).

Levels to watch/live orders:
- Buys: 1.42 region [Tentative – confirmation required] (Stop loss: dependent on where one confirms this area).
- Sells: Flat (Stop loss: N/A).
AUD/USD:
Weekly gain/loss: + 10 pips
Weekly closing price: 0.7371
Weekly opening price: 0.7373
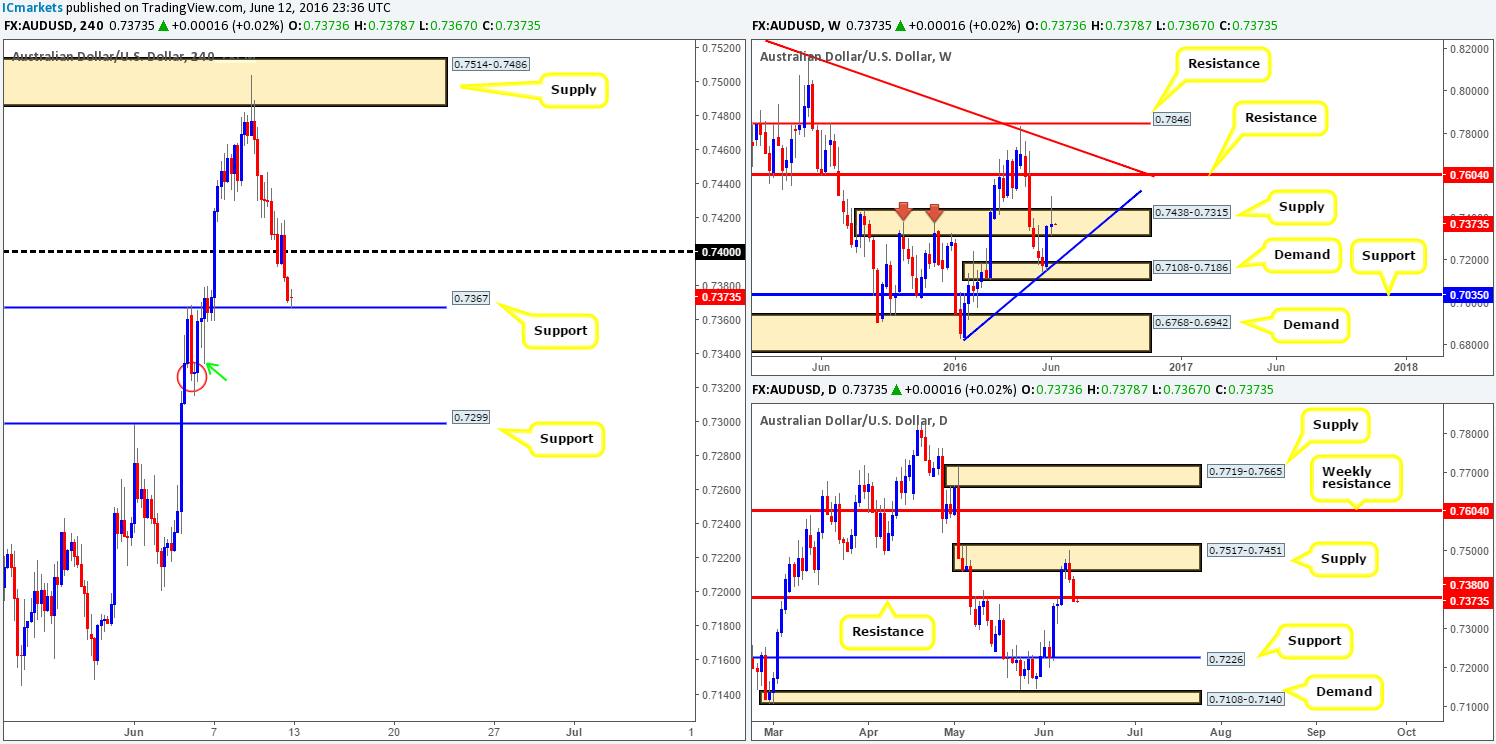
Weekly view: The past week saw the commodity currency aggressively whipsaw through a supply fixed at 0.7438-0.7315, and close within ten pips of the prior week’s close. With selling interest clearly present within this zone, there is a possibility that we may see the Aussie drive lower this week to touch base with trendline support extended from the low 0.6827.
Daily view: Moving down to the daily chart, we can see that price responded beautifully from supply chalked up at 0.7517-0.7451 last week. This ended with the unit closing a few pips beyond support at 0.7380 (now acting resistance). In the event that the bears defend this barrier, the path south appears clear for a push lower down to at least support painted at 0.7226.
H4 view: With price demolishing the 0.74 handle on Friday, thanks to the downward pressure seen from the higher timeframe zones (see above), the pair is currently testing support at 0.7367. To our way of seeing things, we believe this H4 support to be on shaky ground and will likely be taken out sometime today.
Our suggestions: Watch for price to break below and retest 0.7367. This would, assuming we managed to pin down a lower timeframe sell setup (see the top of this report for confirming techniques), be enough for us to enter short this market, targeting support coming in at 0.7299.
The tail seen marked with a green arrow at 0.7334 has likely consumed the majority of bids from demand (red circle) at 0.7324-0.7368, hence our target being set below at 0.7299.
Levels to watch/live orders:
- Buys: Flat (Stop loss: N/A).
- Sells: Watch for price to consume 0.7367 and look to trade any retest seen thereafter (lower timeframe confirmation required).
USD/JPY:
Weekly gain/loss: + 38 pips
Weekly closing price: 106.91
Weekly opening price: 106.80
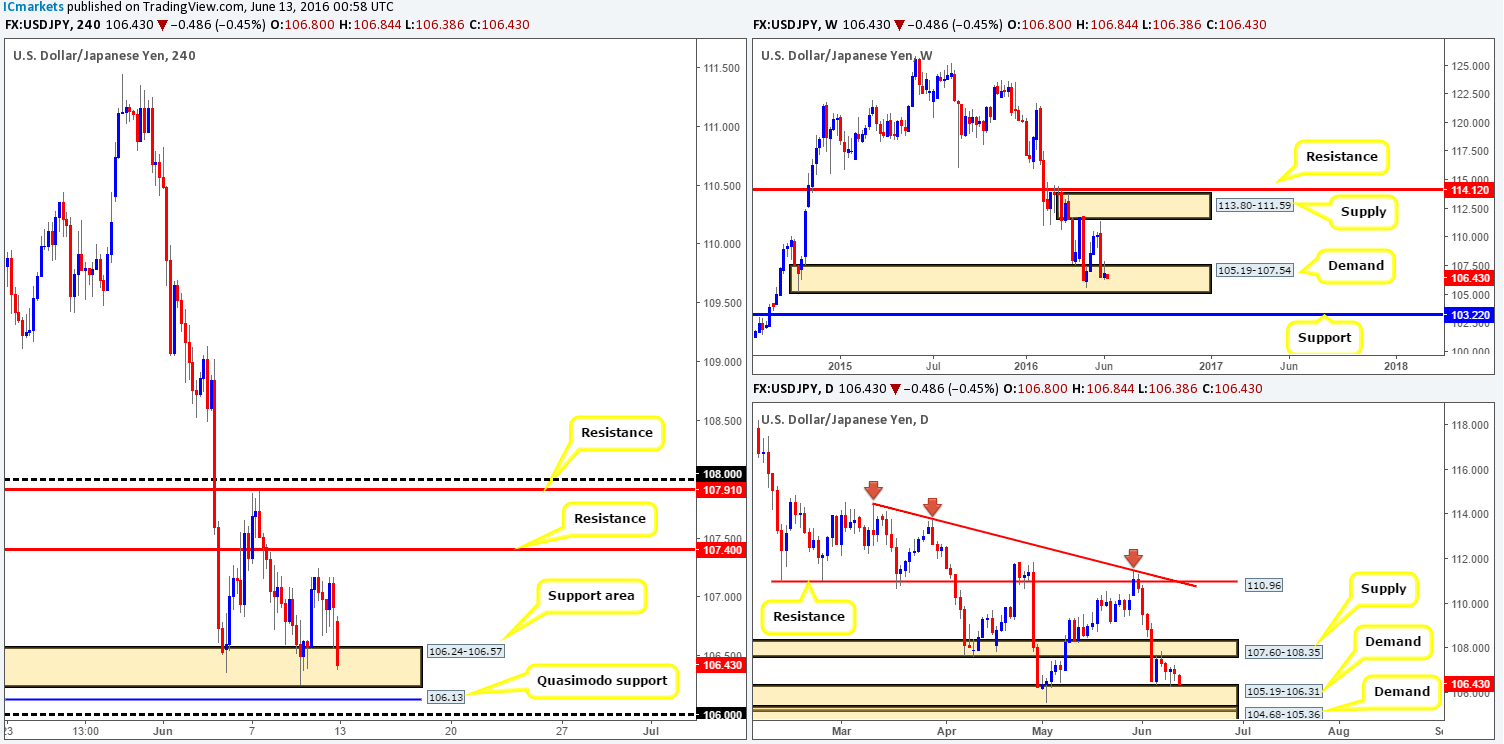
Weekly view: Following the pair touching base with demand seen at 105.19-107.54, price was unable to gain much ground last week. This, as you can see, formed an inverted pin bar which to candlestick traders would likely be considered a bullish signal. The next upside target from here falls in at supply drawn from 113.80-111.59, whilst a break lower could encourage further selling down to support at 103.22.
Daily view: Despite price forming a buying tail off the back of demand at 105.19-106.31 on Thursday (positioned within the extremes of the aforementioned weekly demand), the sellers still seem to have the upper hand here. This could, assuming the bid-side of this market remains weak, force the currency to test the demand at 104.68-105.36, which, if you look back in history, you’ll actually see that this zone supports the current daily demand area.
H4 view: A quick recap of Friday’s sessions shows that price remained trading above the support area seen at 106.24-106.57. However, seeing as the USD/JPY gapped around ten pips lower this morning and has continued to sell-off, the aforementioned support area is once again under pressure.
Despite weakness being seen from the bid-side of this market at the moment, our team is still favors a bullish move. We would not consider a long position from the current support area, however, due to the amount of times this zone has been visited. Levels we are interested in are the Quasimodo support at 106.13 and the 106 round number.
Our suggestions: In light of the above points, we feel this week may see the bulls make an appearance. Therefore, our attention is now firmly focused on the 106.00/106.13 region for potential long trades. Although this buy zone is set within both the aforementioned weekly and daily demand zones (see above), we would still require lower timeframe (see the top of this report for confirmation techniques) confirmation since there is little to stop price faking lower to connect with the top-side of daily demand mentioned above at 104.68-105.36.
Levels to watch/live orders:
- Buys: 106.00/106.13 [Tentative – confirmation required] (Stop loss: dependent on where one confirms this area).
- Sells: Flat (Stop loss: N/A).
USD/CAD:
Weekly gain/loss: – 158 pips
Weekly closing price: 1.2771
Weekly opening price: 1.2791
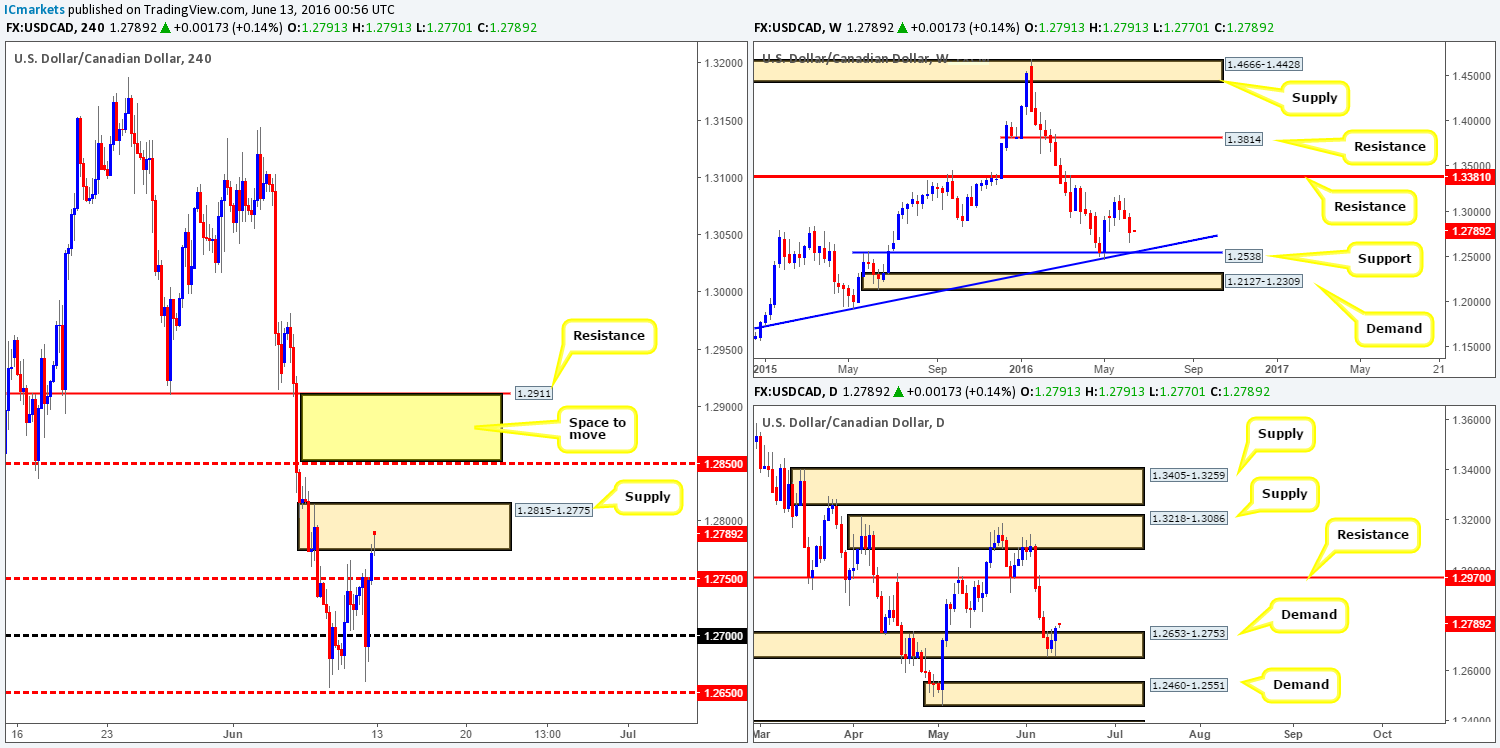
Weekly view: The USD/CAD has been trading south for three weeks, down from its peak of 1.3188. Consequent to this, the pair is now seen trading ahead of a support level seen at 1.2538, which intersects beautifully with trendline support extended from the high 1.1278. Therefore, do keep a close eye on these converging lines as this area could come into play sometime this week.
Daily view: Before the sellers can offer this market lower, nevertheless, demand at 1.2653-1.2753 will need to be taken out. This would, as far as we see things, likely open the trapdoor for a move down to demand at 1.2460-1.2551, which merges with the weekly support mentioned above at 1.2538.
H4 view: Following Friday’s advance, the mid-way resistance 1.2750 was taken out, allowing price to shake hands with supply coming in at 1.2815-1.2775. Although the Loonie opened markedly higher this morning, the gap was quickly filled, and as such price remains lurking within the aforementioned supply. Selling from here is tricky considering that daily buying is being seen from daily demand at 1.2653-1.2753. Unfortunately, buying is just as tricky! Should one enter long, they not only run the risk of trading with H4 sellers, but let’s also no forget that weekly sellers have room to stamp prices lower down to the 1.2538 support!
Our suggestions: The only neighborhood we’d consider trading is between 1.2850/1.2911. If we saw a break above and retest of 1.2850, there is space for price to move above this line until 1.2911 – H4 resistance.
Levels to watch/live orders:
- Buys: Watch for price to consume 1.2850 and look to trade any retest seen thereafter (lower timeframe confirmation required).
- Sells: Flat (Stop loss: N/A).
USD/CHF:
Weekly gain/loss: -111 pips
Weekly closing price: 0.9639
Weekly opening price: 0.9632
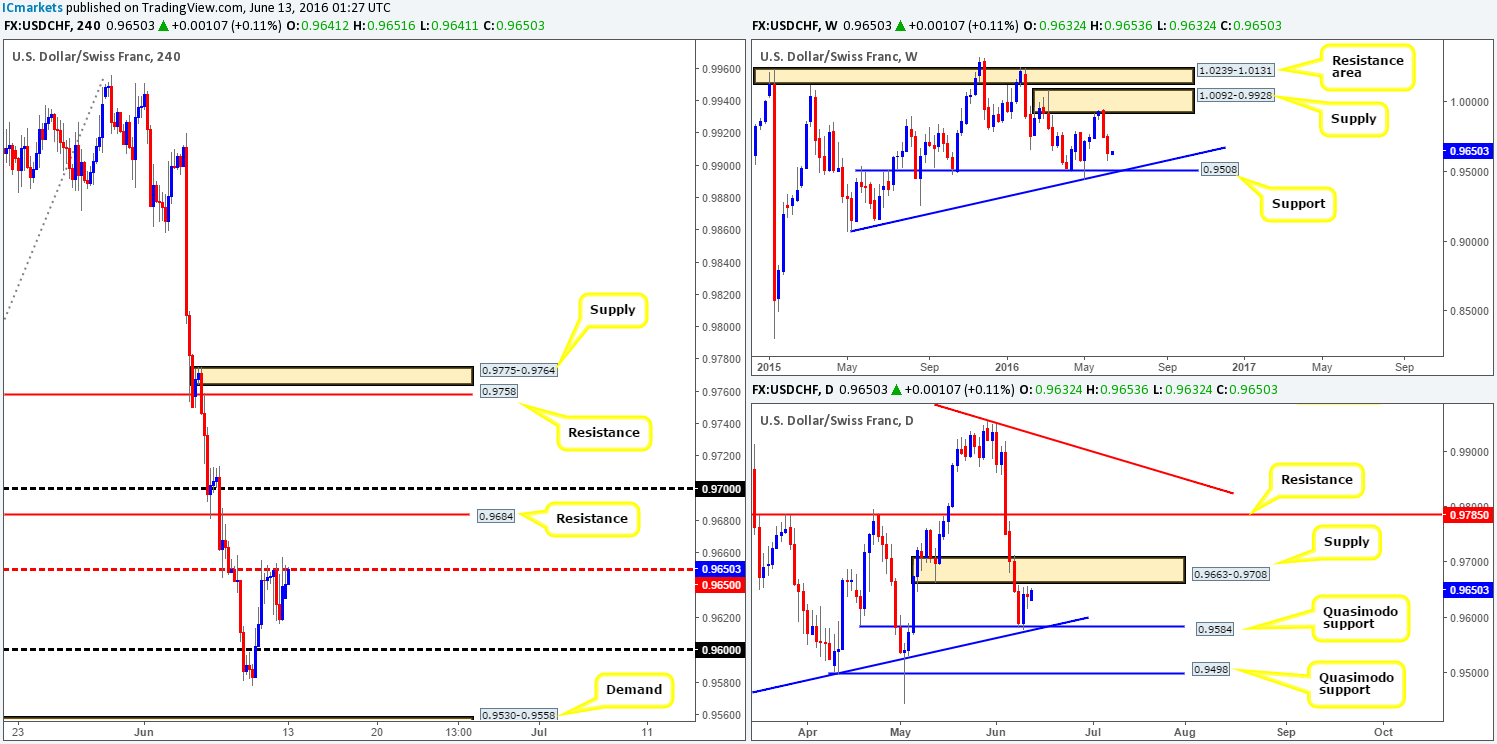
Weekly view: Recent action shows that the USD/CHF extended its decline from supply at 1.0092-0.9928 last week, bringing price to lows of 0.9578. Quite frankly, we see very little support in this market to stop the Swissy from continuing to push lower this week down to support drawn from 0.9508, which coincides nicely with trendline confluence taken from the low 0.9078.
Daily view: While weekly action continues to paint red candles, daily price responded wonderfully to a Quasimodo support line seen at 0.9584 (trendline confluence taken from the low 0.9078) on Thursday. The push from this level placed the pair trade within shouting distance of supply given at 0.9663-0.9708 going into the week’s close. This – coupled with the weekly picture (see above) should, in our opinion, deter most from looking to buy this week.
H4 view: Looking at Friday’s activity, it’s clear to see that a pocket of offers were hit around the mid-way resistance at 0.9650. However, the sell-off from here was short lived as price ended the week retesting the 0.9650 line into the day’s close.
Our suggestions: Look for lower timeframe sell trades off the 0.9650 line today, targeting the 0.96 handle as your immediate take-profit area. Be prepared for price to fakeout above this level before sellers step in, nevertheless, due to the possibility that candle action may want to tag in offers around daily supply at 0.9663-0.9708. This is the main reason for requiring a lower timeframe sell setup to form before entering short (see the top of this report for ideas on how to spot selling strength).
Levels to watch/live orders:
- Buys: Flat (Stop loss: N/A).
- Sells: 0.9650 region [Tentative – confirmation required] (Stop loss: dependent on where one confirms this area).
DOW 30:
Weekly gain/loss: +62 points
Weekly closing price: 17872
Weekly opening price: 17872
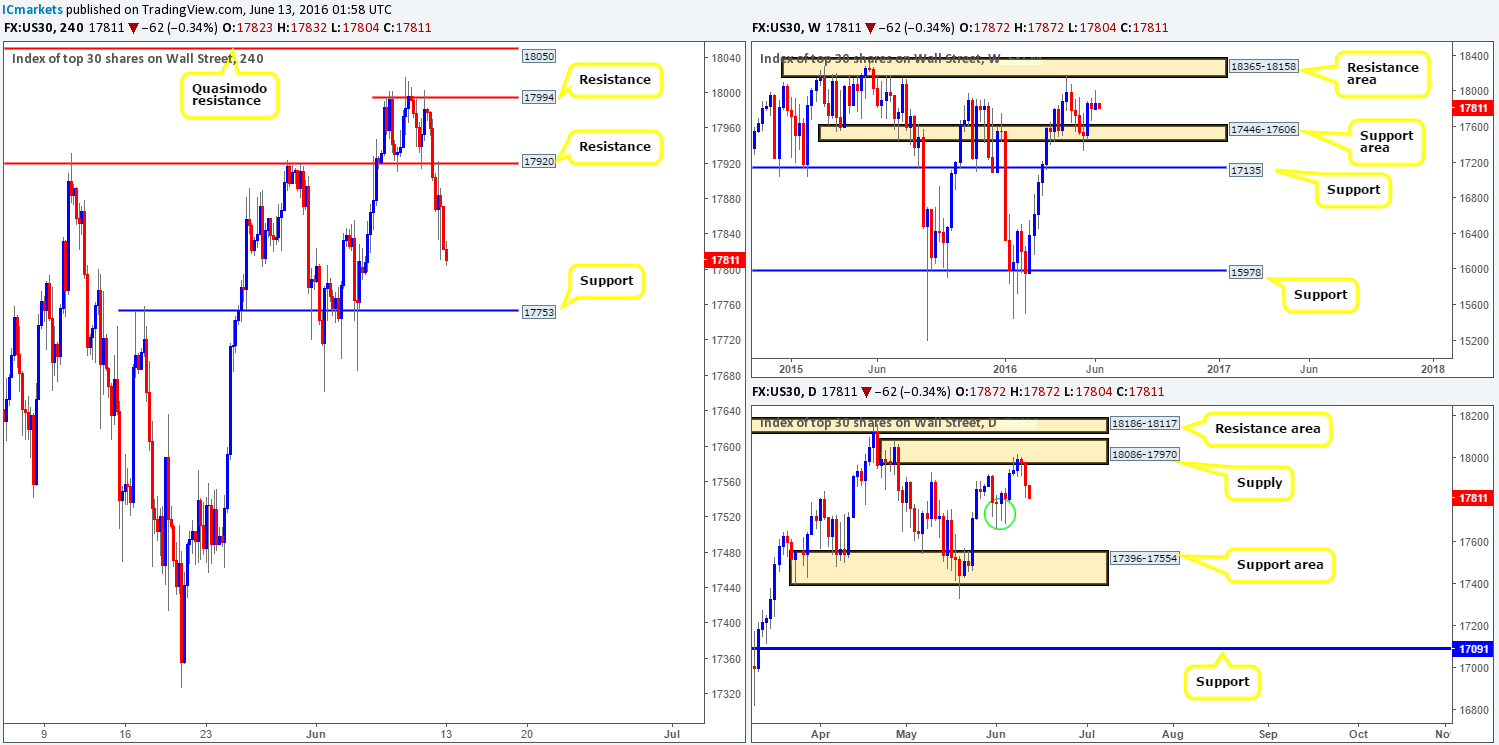
Weekly view: From the weekly viewpoint, we unfortunately do not see much direction being shown at the moment. Upside is currently capped by a resistance area drawn from 18365-18158, whilst downside is capped by a support area coming in at 17446-17606. Both zones, in our book, are of equal standing. Therefore, each barrier will be watched closely as either area could play a significant role during trading this week!
Daily view: Daily action on the other hand shows price recently fell sharply from supply at 18086-17970. The week before last there was a collection of buying tails chalked up seen marked with a green circle, which could potentially bounce price this week since there is likely some unfilled buy orders still lurking within this region. Beyond this zone, however, the path south looks clear for price to shake hands with a support area carved from 17396-17554.
H4 view: Over on the H4 chart, this morning saw the market open unchanged at 17872, following Friday’s sell-off from resistance at 17920. To the downside there is little support until price connects with 17753 – a support which sits within the crowd of buying tails seen on the daily chart (see above).
Our suggestions: Keep an eyeball on the H4 support at 17753 for a trade today. Pulling the trigger without any supporting lower timeframe confirmation here, nevertheless, is not something we’d be comfortable with, due to the possibility that price could whipsaw aggressively through our buy level before price is bid (see the top of this report for ideas on confirming price action). In the event that price closes below 17753, however, we’ll then be looking to short on any retest seen at this line, targeting 17554 – the top-side of the daily support area.
Levels to watch/live orders:
- Buys: 17753 region [Tentative – confirmation required] (Stop loss: dependent on where one confirms this area).
- Sells: Watch for price to consume 17753 and look to trade any retest seen thereafter (lower timeframe confirmation required).
GOLD:
Weekly gain/loss: – $29.6
Weekly closing price: 1273.7
Weekly opening price: 1273.7
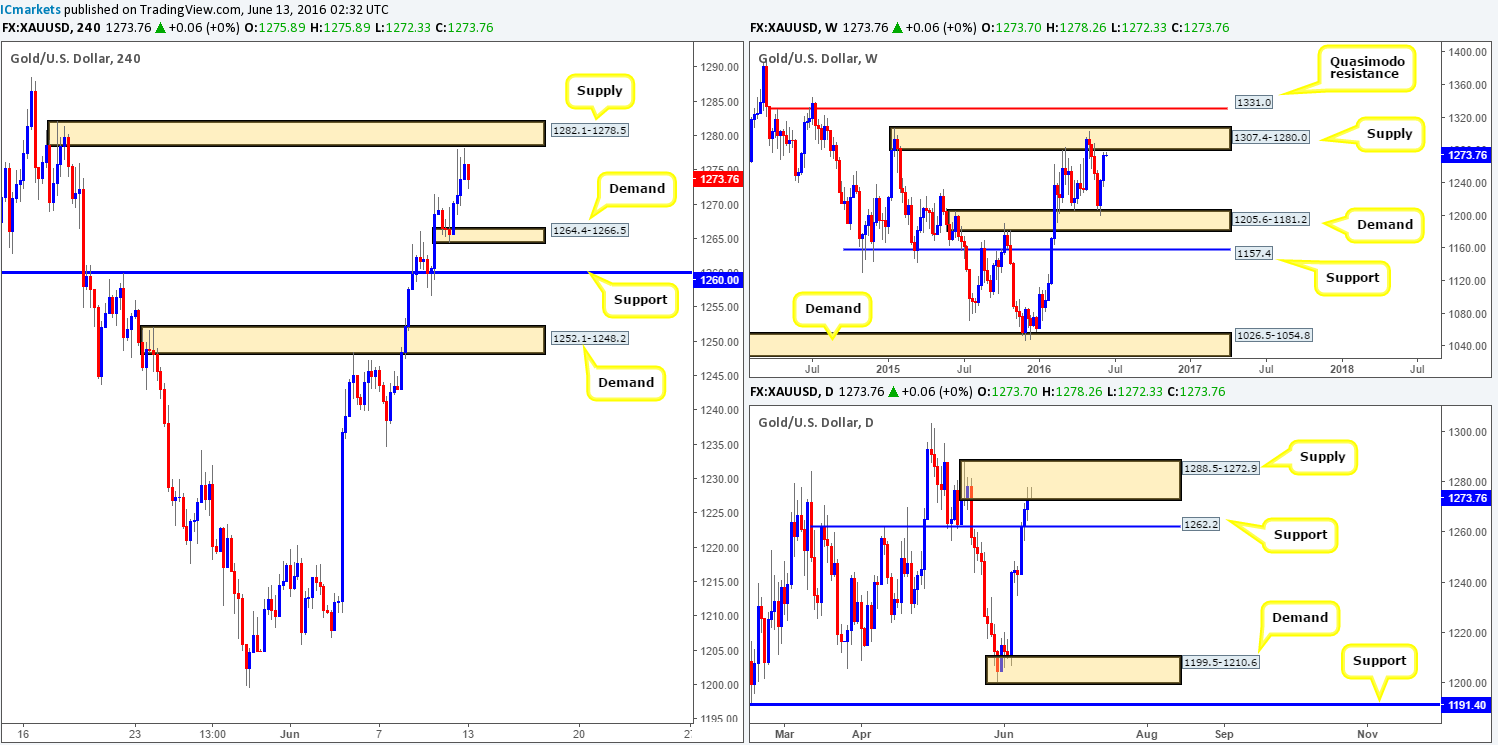
Weekly view: The gold market enjoyed another successful rally north last week, gaining close to $30 in value! In consequence, the yellow metal is now trading within shouting distance of a supply zone drawn from 1307.4-1280.0. This area has been visited twice already and each time has responded with relatively aggressive selling.
Daily view: In-line with weekly movement, the metal is seen trading from supply given at 1288.5-1272.9, which could potentially force this unit to retest 1262.2 sometime this week. In the event that gold breaks above the current supply, however, the next FRESH line is not seen until 1333.4 – a Quasimodo resistance which sits just above a weekly Quasimodo resistance at 1331.0.
H4 view: With stocks dropping lower on Friday the shiny metal was clearly favored among investors, consequently pushing prices up to within touching distance of supply at 1282.1-1278.5. Given that this supply is lodged within both weekly and daily supply zones (see above), it is an absolutely fantastic zone to be looking to sell!
Our suggestions: For those who read Friday’s report (see link below) you may recall our team mentioning that we placed a pending sell order at 1277.9 (just below the current H4 supply) with set stop above at 1283.0. As can be seen from the chart, our order was triggered late Friday and is still running as we write. Ultimately, we’re looking to hold this position until at least H4 demand at 1264.4-1266.5, where we will likely liquidate 50% of our position and reduce risk to breakeven.
Levels to watch/live orders:
- Buys: Flat (Stop loss: N/A).
- Sells: 1277.9 [Live] (Stop loss: 1283.0).


