
EUR/USD:
Weekly Gain/Loss: -0.46%
Weekly Close: 1.1335
Weekly perspective:
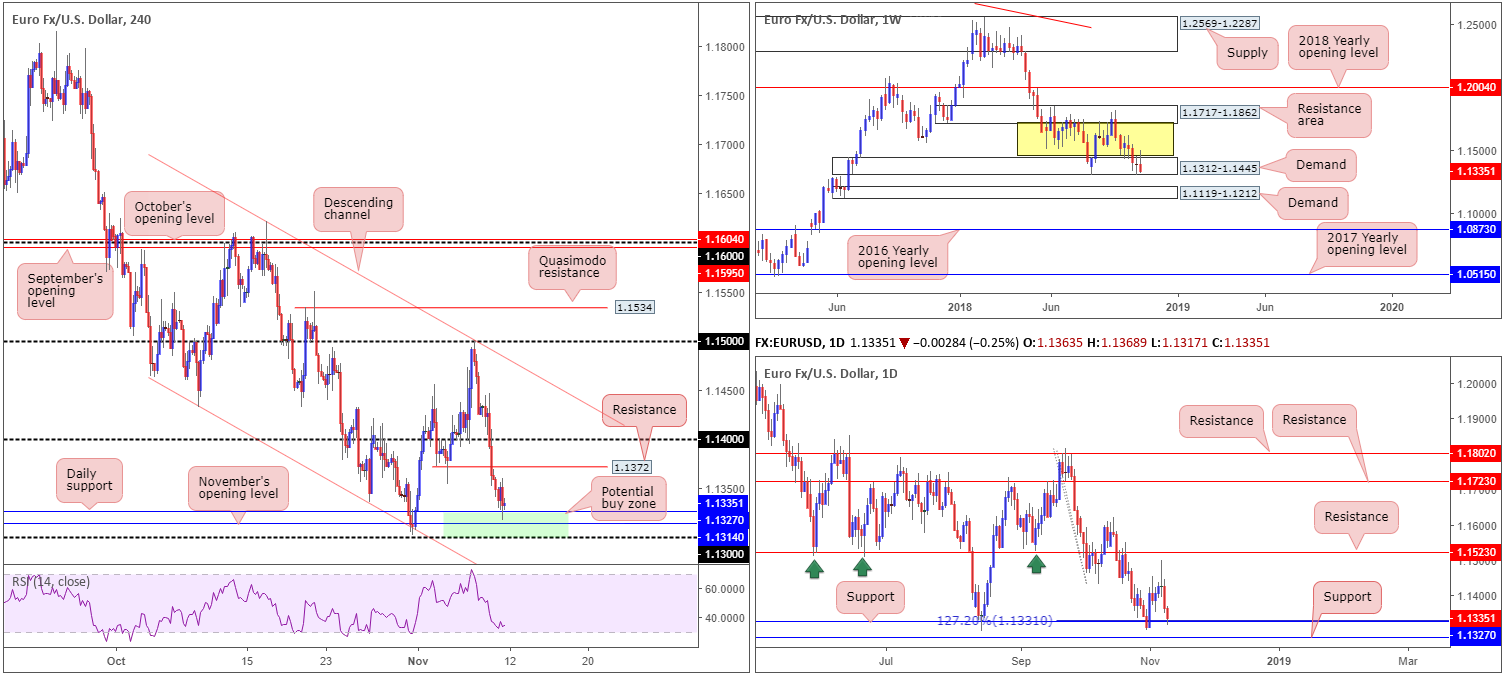
Over the course of last week’s session the single currency continued to spiral south. By way of a bearish pin-bar formation, the pair recorded its fourth consecutive losing week and placed a question mark on the demand area drawn from 1.1312-1.1445. In the event the unit pushes for lower ground this week, traders are urged to keep demand at 1.1119-1.1212 in sight.
Daily perspective:
In the shape of two back-to-back near-full bodied bearish candles, both Thursday and Friday’s sessions notched up weighty losses last week, pulling price action towards the 1.1327 neighbourhood: a support level that fuses closely with a 127.2% Fib ext. point at 1.1331. With weekly demand mentioned above at 1.1312-1.1445 appearing somewhat fragile at the moment, 1.1327 offers a last line of defense for buyers. In the event 1.1327 gives way, however, all eyes will likely be on nearby support at 1.1285.
H4 perspective:
Bolstered on the back of a well-bid USD, the H4 candlesticks concluded Friday shaking hands with a particularly interesting area (green) of support marked between 1.13/1.1327. Comprised of the current daily support at 1.1327, November’s opening level at 1.1314 and the round number 1.13, there’s a chance the market may observe a correction from this base today/early week.
Areas of consideration:
As a fakeout may occur beyond 1.13 (common viewing around psychological numbers), waiting for additional candlestick confirmation to form before pulling the trigger out of 1.13/1.1327 is an option (entry/stop parameters can be defined by the candlestick structure). As for an initial upside target, 1.1372 is likely to hold active sellers. Therefore, reducing risk to breakeven at this point and taking some profit off the table is something to consider. Beyond 1.1372, the 1.14 handle is in place as the next take-profit target.
Today’s data points: FOMC member Daly speaks; US banks are closed in observance of Veterans Day.
GBP/USD:
Weekly Gain/Loss: +0.08%
Weekly Close: 1.2972
Weekly perspective:
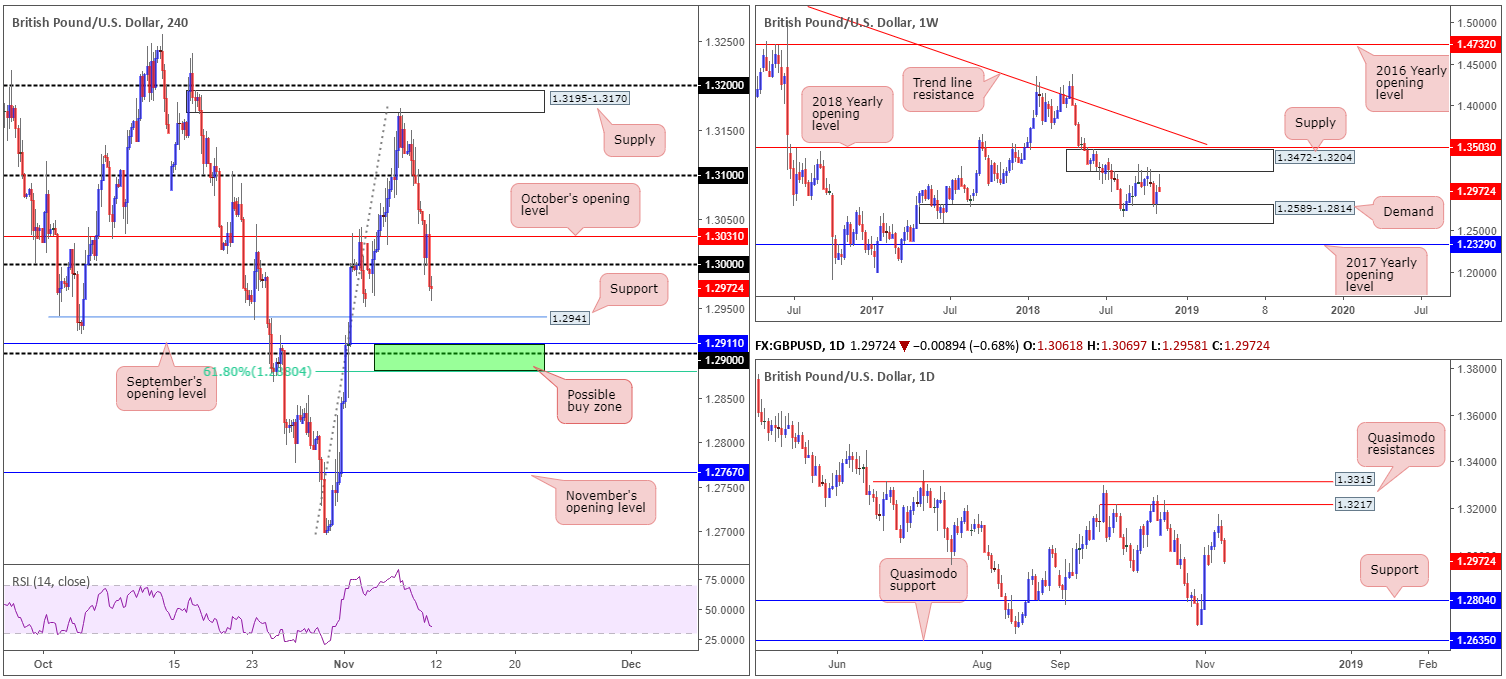
Although ending the week in the form of a strong bearish pin-bar pattern, the pair remains confined to a consolidation sculpted between demand at 1.2589-1.2814 and a supply drawn from 1.3472-1.3204. As a result, either area could play a significant role during trade this week.
Daily perspective:
Leaving the Quasimodo resistance at 1.3217 (positioned within the noted weekly supply zone) unchallenged Wednesday, the British pound fell sharply against its US counterpart, ending the week chalking up a near-full-bodied bearish candle. In terms of nearby structure, the next support target enters the field at 1.2804 (sited within the limits of the current weekly demand).
H4 perspective:
Mixed UK macroeconomic data and Brexit headers weighed on the GBP Friday. Latest news report UK Junior Transport Minister Jo Johnson resigned from the position over PM May’s proposed plan, with sources reporting that more government resignations could follow from this. Combined, this was sufficient enough to drag the pair under its key figure 1.30.
Nearby support rests at 1.2941, shadowed closely by an interesting area of support at 1.2880/1.2911. Comprised of a 61.8% Fib support at 1.2880, the 1.29 handle and September’s opening level at 1.2911, this is a base worthy of attention today/early week, despite limited higher-timeframe convergence.
Areas of consideration:
Should the market witness a test of 1.2880/1.2911, a bounce is likely according to our technical studies. The difficulty is, however, deciphering whether price will simply test the underside of 1.2941 and continue pressing lower, or look to retest 1.30.
Aggressive traders may look to enter long at 1.2911 and place stops beneath 1.2880. For conservative traders, waiting for additional candle confirmation (H4 or lower) is an alternative (entry/stop parameters can be defined by the selected candlestick structure).
Today’s data points: FOMC member Daly speaks; US banks are closed in observance of Veterans Day.
AUD/USD:
Weekly Gain/Loss: +0.39%
Weekly Close: 0.7225
Weekly perspective:
Despite price overthrowing its 2017 yearly opening level at 0.7199, hefty resistance entered the fray last week off the 2016 yearly opening level at 0.7282. Printing a rather attractive bearish pin-bar pattern from here, this may be sufficient enough to reclaim 0.7199 this week and eventually make a run towards Quasimodo support at 0.7016.
Daily perspective:
Mid-week trade witnessed the commodity currency come within a few pips of testing a Quasimodo resistance at 0.7304, which, as you can see, forced the Aussie dollar to lower ground. Based on local structure, further selling could be on the cards this week, with support not expected to enter the market until around 0.7151.
H4 perspective:
The AUD/USD derived little impetus from the RBA early Friday, despite a mildly upbeat tone in terms of economic assessments. The pair ceded further ground and eventually reclaimed October’s opening level at 0.7229, potentially unlocking the gate for a test of 0.72 today/early week.
For those who read previous reports, the spotlight was drawn towards 0.7304/0.7282 as a possible sell zone: an area shaded green on the H4 timeframe. Besides the H4 structure (the round number 0.73 and Quasimodo resistance at 0.7283), having the 2016 yearly opening level at 0.7282 positioned nearby (weekly timeframe), and a daily Quasimodo resistance sited directly above 0.73 at 0.7304, added considerable weight, according to our technical reading.
Well done to any of our readers who remain short this market. In terms of take-profit targets, the second objective was recently met at October’s opening level 0.7229. With this barrier out of the picture, the final take-profit target at 0.72 may be achieved (merges with the next downside target on the weekly scale: the 2017 yearly opening level at 0.7199).
Areas of consideration:
For folks who missed the setup to sell 0.7304/0.7282, intraday selling opportunities may emerge beneath 0.72 this week. A H4 close under this number that’s followed up with a retest in the shape of a H4 bearish candlestick formation (entry/stop parameters can be defined by the selected candlestick structure) is likely enough to draw in sellers towards daily support mentioned above at 0.7151/H4 support at 0.7145.
Today’s data points: FOMC member Daly speaks; US banks are closed in observance of Veterans Day.

USD/JPY:
Weekly Gain/Loss: +0.53%
Weekly Close: 113.79
Weekly perspective:
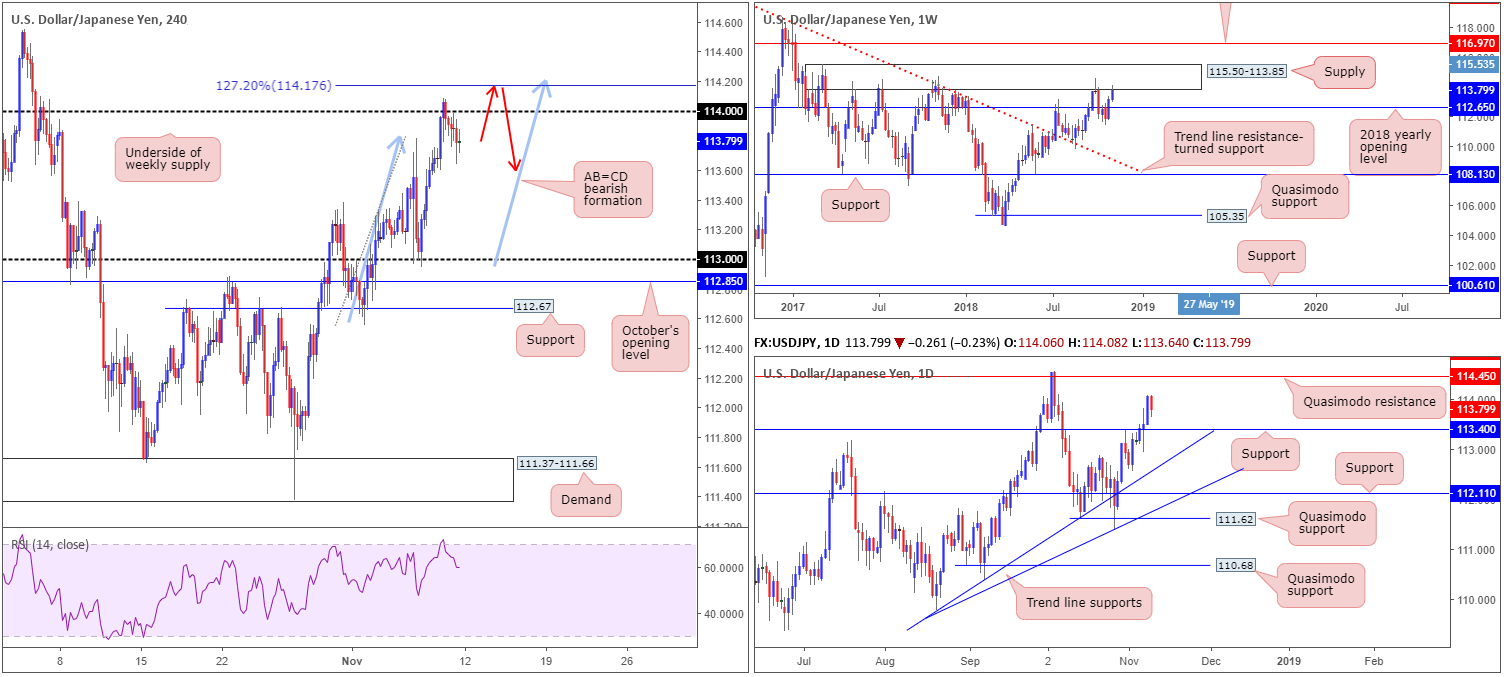
The US dollar made strong gains vs. its Japanese counterpart last week, lifting the pair into supply territory at 115.50-113.85. Note this supply has incredibly strong history dating as far back as May 2017. For that reason, traders may feel the need to pencil in the possibility of a pullback forming this week towards the 2018 yearly opening level at 112.65.
Daily perspective:
Before weekly price can reach 112.65, however, daily action highlights potential support residing around the 113.40 region. Failure to hold 113.40 will likely draw the limelight towards trend line support (etched from the low 109.77).
In addition to this, there’s a possibility the unit could still climb north towards Quasimodo resistance at 114.45 (sited within the aforementioned weekly supply).
H4 perspective:
A quick recap of Friday’s movement on the H4 timeframe shows price action failed to overcome its 114 handle, despite broad-based USD buying. Safe-haven flows favoured the Japanese yen as US equities probed for lower ground. While further selling is a possibility in the USD/JPY market, traders are reminded to include the AB=CD (blue arrows) bearish pattern that terminates around the 114.17ish region (127.2% Fib ext. point) this week.
Areas of consideration:
Keeping things simple, the technicals still show possible shorting opportunities around the 114.17 neighbourhood (red arrows): the H4 AB=CD completion point, in spite of the recent move lower from 114.
As there’s a risk of price overthrowing 114.17 for a move towards the daily Quasimodo resistance mentioned above at 114.45, traders are urged to consider waiting for additional bearish candlestick confirmation before pulling the trigger (entry/stop parameters can be defined by the candlestick structure). A H4 close back beneath 114 is also important. Ultimately the first take-profit target from here is seen at daily support drawn from 113.40.
Today’s data points: FOMC member Daly speaks; US banks are closed in observance of Veterans Day.
USD/CAD:
Weekly Gain/Loss: +0.83%
Weekly Close: 1.3207
Weekly perspective:
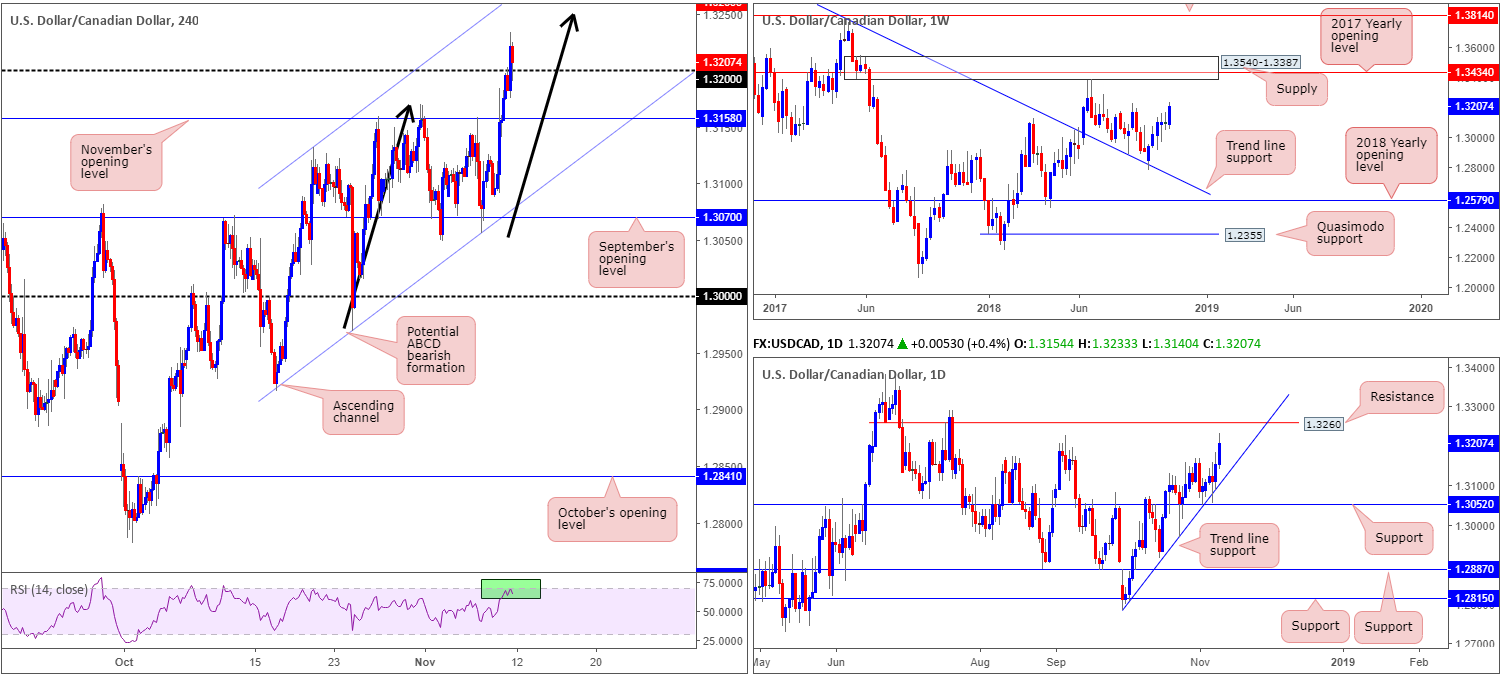
Broad-based USD bidding, along with sliding oil prices, propelled the USD/CAD market north last week. This comes after a spell of indecisiveness in the shape of two back-to-back indecision candles. According to local structure on this timeframe, our technical reading shows limited resistance in this market until supply at 1.3540-1.3387, which happens to house the 2017 yearly opening level within at 1.3434.
Daily perspective:
While weekly action portends further buying this week, traders are urged to pencil in potential resistance forming from the 1.3226 Sep 8 high, followed by daily resistance at 1.3260. A break of this barrier likely places the 1.3386 June 27 high in sight, which skirts the lower edge of the weekly supply zone mentioned above at 1.3540-1.3387.
H4 perspective:
After taking out November’s opening level at 1.3158, price action conquered the 1.32 handle Friday, despite an attempt to hold the level. The break of 1.32 has limited resistance overhead until reaching the symmetrical completion point of a bearish ABCD formation (black arrows) around the 1.3250ish region, shadowed closely by 1.3260: a H4 Quasimodo resistance level (not seen on the screen) which happens to also represent daily resistance highlighted above. Recent buying has also positioned the RSI indicator in overbought territory.
Areas of consideration:
All three timeframes point to a push higher today/early week. Therefore, should the H4 candles retest 1.32 prior to challenging 1.3250, a long opportunity is worth exploring. To help avoid being whipsawed out of a trade on a fakeout beneath 1.32, traders should consider waiting for additional candlestick confirmation (entry/stop parameters can be defined by the candlestick structure), before pressing the buy button. The first upside target, as already mentioned, is 1.3250, followed by 1.3260. It’s also worth bearing in mind, further moves north beyond 1.3260 is possible, according to the weekly timeframe.
Today’s data points: FOMC member Daly speaks; US banks are closed in observance of Veterans Day; Canadian banks are closed in observance of Remembrance Day.
USD/CHF:
Weekly Gain/Loss: +0.20%
Weekly Close: 1.0053
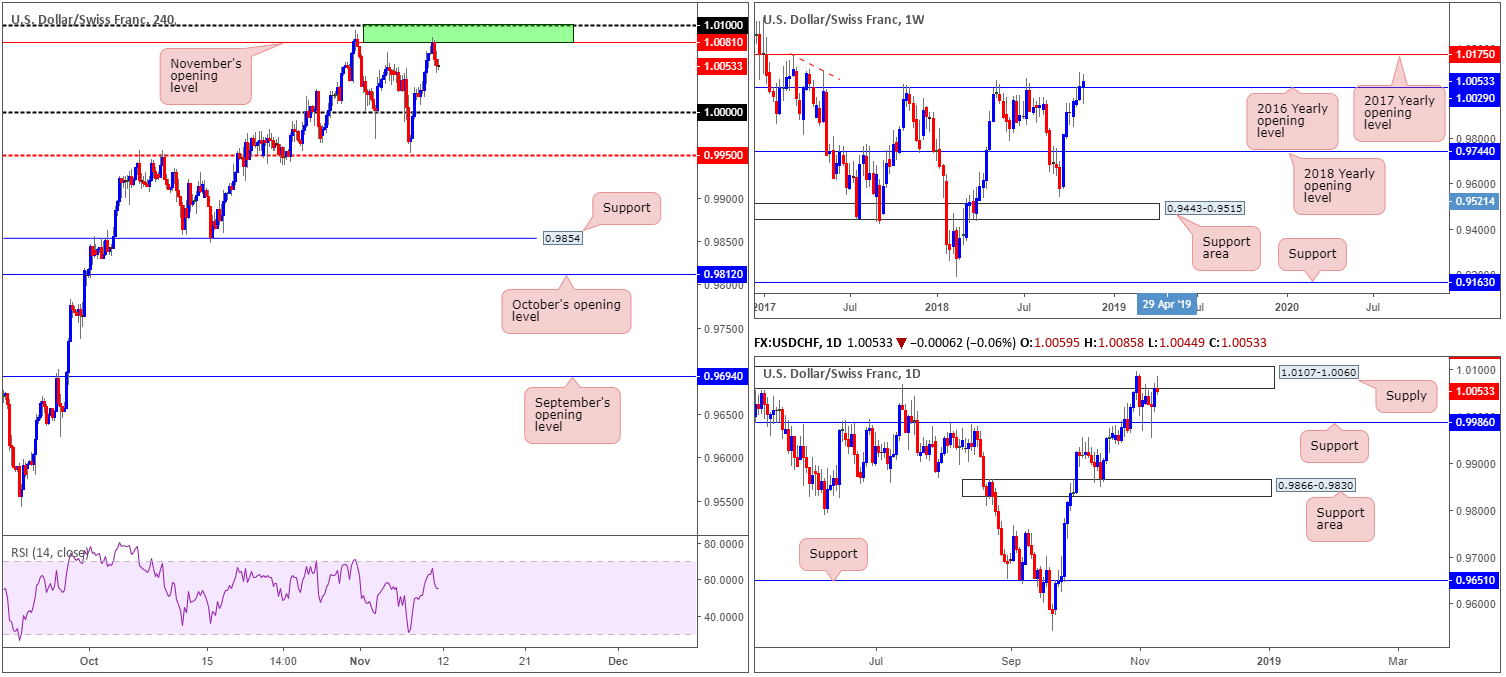
Weekly perspective:
Since price action bottomed just north of a support area coming in at 0.9443-0.9515, the US dollar has offered little respite to the sinking Swiss franc. Of late, the pair conquered its 2016 yearly opening level at 1.0029, possibly opening up the pathway north towards the 2017 yearly opening level at 1.0175. This also coincides with the EUR/USD weekly chart emphasizing weakness within its current demand base at 1.1312-1.1445.
Daily perspective:
Daily flow, as of Friday’s close, is seen challenging the underside of supply at 1.0107-1.0060 in the form of a bearish pin-bar pattern. It will take a break of this area, according to our technical studies, to confirm upside beyond the 2016 open level.
H4 perspective:
A brief look at recent dealings on the H4 scale, show the unit shook hands with November’s opening level at 1.0081 and turned lower. With daily supply at 1.0107-1.0060 in the picture, Friday’s briefing underlined possible selling from 1.01/1.0081 as an option (round number 1.01/November’s opening level – green). Well done to any of our readers who managed to jump aboard this train!
Areas of consideration:
For traders short the market, the 2016 yearly opening level mentioned above at 1.0029 looks a reasonable downside target, shadowed closely by parity (1.0000) and then daily support at 0.9986.
Today’s data points: FOMC member Daly speaks; US banks are closed in observance of Veterans Day.
Dow Jones Industrial Average:
Weekly Gain/Loss: +2.96%
Weekly Close: 25949
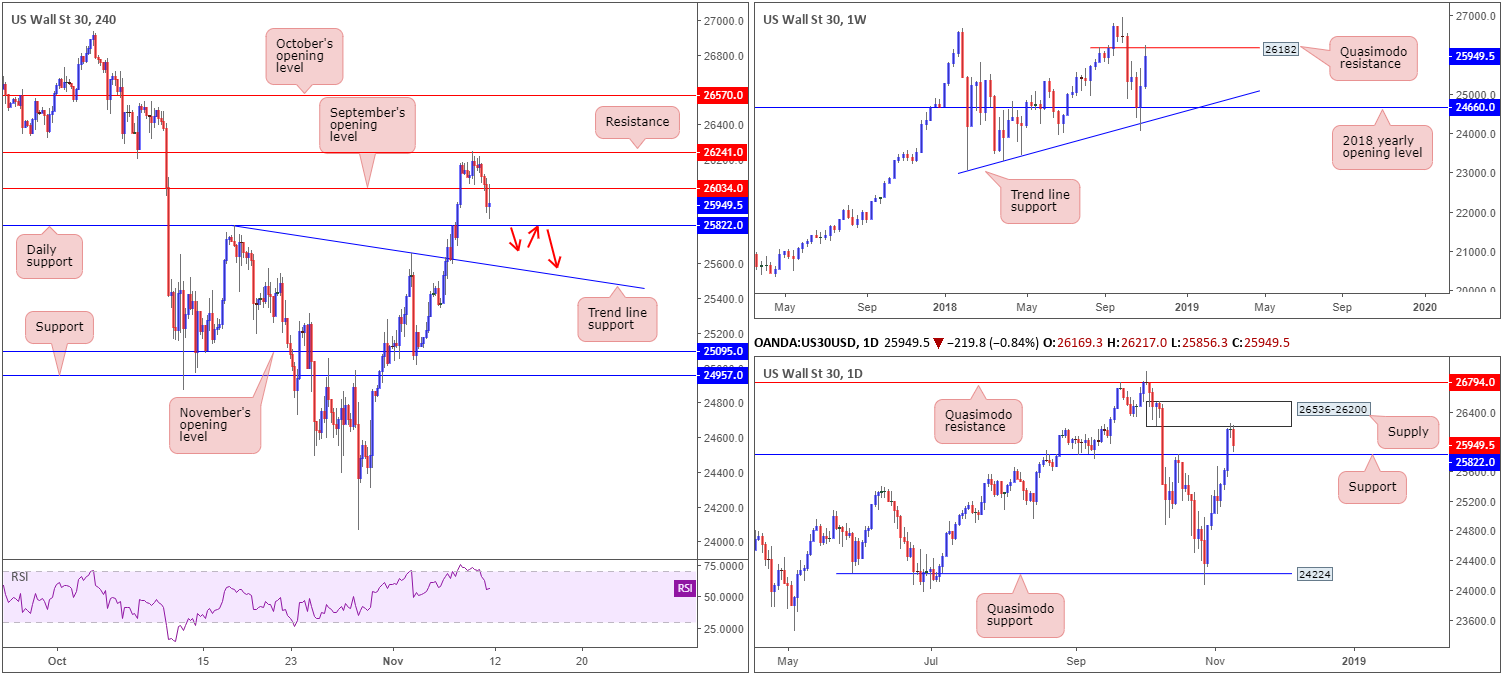
Weekly perspective:
Following an impressive recovery off the 2018 yearly opening level at 24660 (along with trend line support surfacing just beneath it taken from the low 23055), the index explored higher ground over the course of last week, touching gloves with Quasimodo resistance at 26182. Overthrowing this barrier could eventually lead to fresh record highs being seen.
Daily perspective:
A closer look at price action on the daily timeframe has supply at 26536-26200 in view, which, as you can see, held firm in the later stages of last week. A break of this area has a Quasimodo resistance at 26794 in sight, whereas the next downside target in view falls in at nearby support taken from 25822.
H4 perspective:
Wall Street shed nearly 1.00% Friday as risk-off returns, despite recording record gains on the week. September’s opening level at 26034 was taken out and later retested as resistance during US hours. Although this has placed daily support mentioned above at 25822 back in the spotlight, beneath this level traders are urged to pencil in trend line support (extended from the high 25822) in case we push for lower ground.
Areas of consideration:
Entering into a long position off daily support is daunting, owing to the market’s position on the weekly timeframe. In order to confirm bearish strength from the weekly resistance level, a daily close beneath 25822 is needed. Should this occur without testing the H4 trend line support, selling on any retest seen at 25822 is an option (red arrows). Given the distance between 25822 and the H4 trend line support is reasonably tight, entering on the back of candlestick confirmation might be difficult.
Today’s data points: FOMC member Daly speaks; US banks are closed in observance of Veterans Day.
XAU/USD (Gold):
Weekly Gain/Loss: -1.87%
Weekly Close: 1209.5
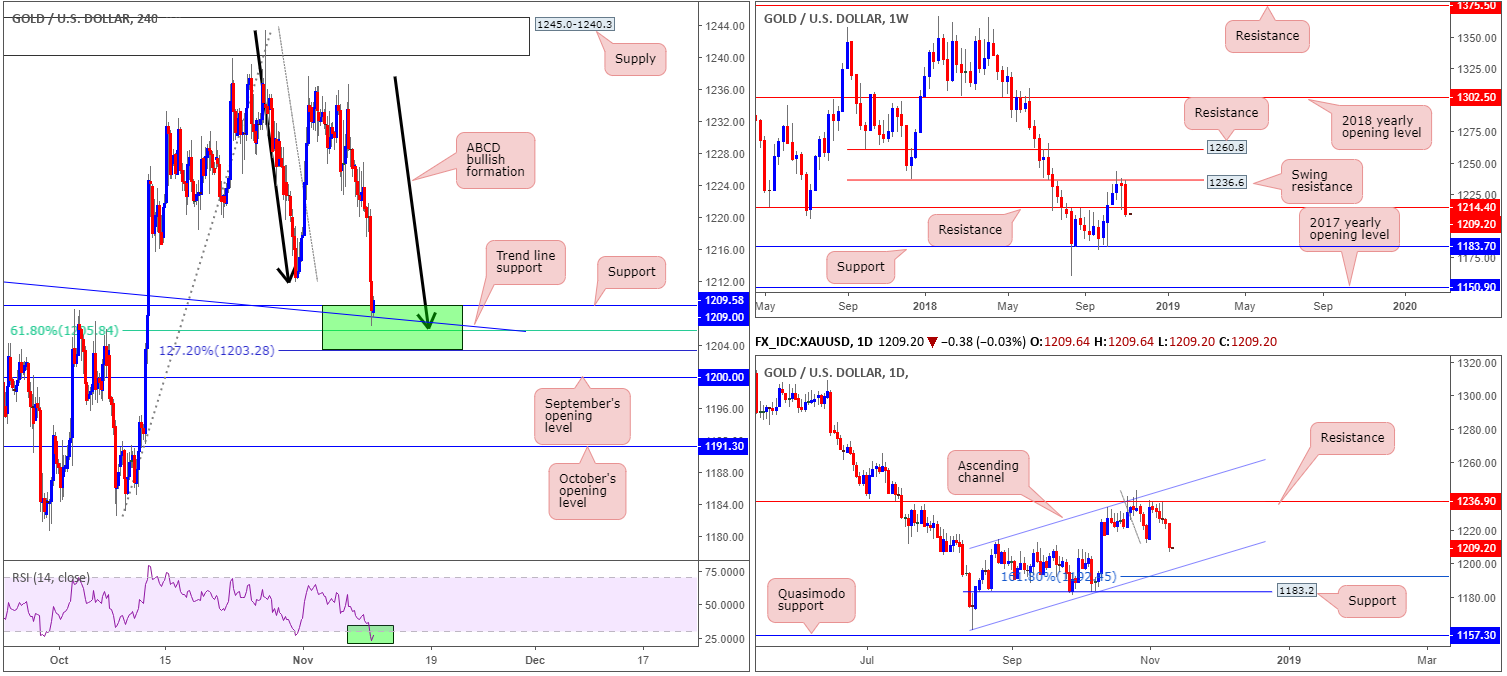
Weekly perspective:
Having seen the US dollar advance against the majority of its peers, the price of gold went back to playing on the defensive last week. Marginally crunching beneath support at 1214.4 (now acting resistance), this has possibly set the stage for further selling this week in the direction of support coming in at 1183.7.
Daily perspective:
Zooming in for a closer look on the daily scale, price action is currently confined to an ascending channel formation (1160.3/1214.3). In view of the recent selling, this has placed the lower edge of this channel on the radar this week, followed closely by a 161.8% Fib ext. point at 1192.4 and then support carved from 1183.2.
H4 perspective:
Although both weekly and daily structure shows room to press lower, the H4 candles ended Friday’s segment testing a particularly interesting area of support at 1203.2/1209.0 (green zone). Comprised of a support level at 1209.0, a 61.8% Fib support at 1205.8, a trend line support (taken from the high 1214.3) and an ABCD (black arrows) 127.2% Fib ext. support at 1203.2, this region could possibly hold price higher today/early week. It might also be worth noting the RSI indicator is seen treading water within oversold terrain.
Areas of consideration:
On account of the H4 confluence merging between 1203.2/1209.0, entering on a H4 bullish candlestick signal could be of interest to many swing traders today. Despite this, though, bullion may find it challenging to overcome weekly resistance at 1214.4.
Considering the above, this will likely leave many traders on the sidelines for the time being.
The use of the site is agreement that the site is for informational and educational purposes only and does not constitute advice in any form in the furtherance of any trade or trading decisions.
The accuracy, completeness and timeliness of the information contained on this site cannot be guaranteed. IC Markets does not warranty, guarantee or make any representations, or assume any liability with regard to financial results based on the use of the information in the site.
News, views, opinions, recommendations and other information obtained from sources outside of www.icmarkets.com.au, used in this site are believed to be reliable, but we cannot guarantee their accuracy or completeness. All such information is subject to change at any time without notice. IC Markets assumes no responsibility for the content of any linked site. The fact that such links may exist does not indicate approval or endorsement of any material contained on any linked site.
IC Markets is not liable for any harm caused by the transmission, through accessing the services or information on this site, of a computer virus, or other computer code or programming device that might be used to access, delete, damage, disable, disrupt or otherwise impede in any manner, the operation of the site or of any user’s software, hardware, data or property.


