
A note on lower timeframe confirming price action…
Waiting for lower timeframe confirmation is our main tool to confirm strength within higher timeframe zones, and has really been the key to our trading success. It takes a little time to understand the subtle nuances, however, as each trade is never the same, but once you master the rhythm so to speak, you will be saved from countless unnecessary losing trades. The following is a list of what we look for:
- A break/retest of supply or demand dependent on which way you’re trading.
- A trendline break/retest.
- Buying/selling tails/wicks – essentially we look for a cluster of very obvious spikes off of lower timeframe support and resistance levels within the higher timeframe zone.
- Candlestick patterns. We tend to stick with pin bars and engulfing bars as these have proven to be the most effective.
We search for lower timeframe confirmation between the M15 and H1 timeframes, since most of our higher-timeframe areas begin with the H4. Stops are usually placed 5-10 pips beyond confirming structures.
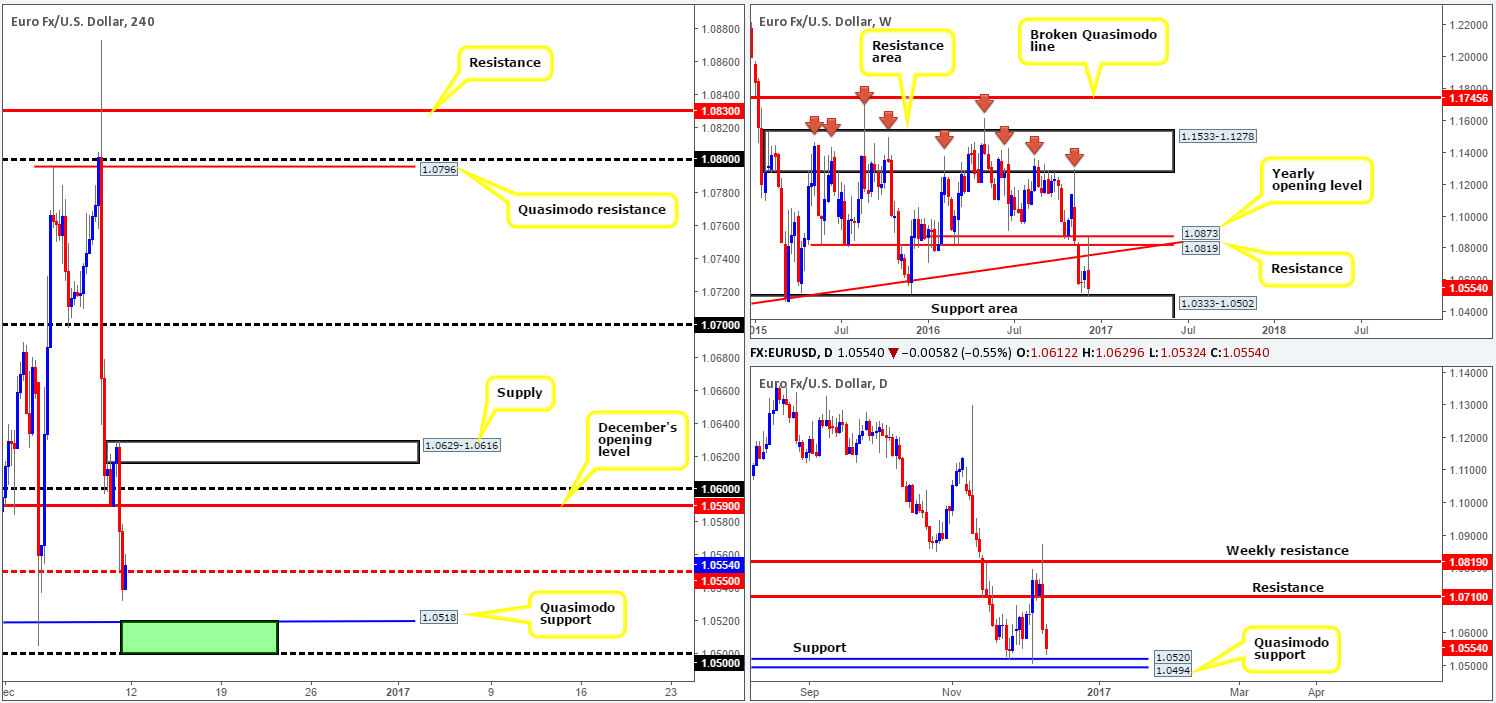
EUR/USD:
Weekly gain/loss: – 104 pips
Weekly closing price: 1.0554
Weekly view: The past week saw the shared currency range over 350 pips. Amid this volatility, the candle whipsawed through a long-term trendline resistance extended from the low 0.8231, a resistance at 1.0819 and ultimately struck the 2016 yearly opening level at 1.0873 to the pip. This barrier, with the help of the ECB extending its program (although at a slower pace), rotated price to the downside and closed the week just ahead of a support area coming in at 1.0333-1.0502, which can be seen stretching as far back as 1997!
Daily view: In conjunction with weekly price, the EUR is also seen trading just ahead of a support level at 1.0520 (extends as far back as Apr 2015) and a neighboring Quasimodo support drawn from 1.0494. Given both the weekly and daily support structures in sight, we feel selling interest could diminish in the days ahead.
H4 view: Summing up Friday’s trade on the H4 shows price sold off mid-way through the London morning segment, consequently breaking through both the 1.06 handle and December’s opening level at 1.0590, as well as eventually (bolstered by a stronger-than-expected US consumer data) the H4 mid-way support at 1.0550. The week, as you can see, ended with the H4 pulling back and edging just slightly back above the 1.0550 point.
Direction for the week: As mentioned in the daily section, we feel selling interest could diminish in the days ahead. Our expectation, therefore, is to see a rebound take shape from the 1.05 region this week.
Direction for today: Positioned below the H4 mid-way support 1.0550 is a H4 Quasimodo support coming in at 1.0518, followed closely by the 1.05 handle. It is in between this area (green zone) we feel price will be drawn to today and likely bounce from.
Our suggestions: Buying from the above noted H4 buy zone is certainly something traders may want to have noted in their watchlists today. However, let’s bear in mind that there’s a daily Quasimodo support at 1.0494 running just beneath this area, hence a fakeout could be on the cards. For that reason, we would recommend waiting for at least a H4 bull candle to form this section before taking the plunge and buying.
In the event that the bulls manage to find a foothold above 1.0550, however, buying from here is not something we would feel comfortable participating in. This is simply due to the fact that the higher-timeframe structures show room for the major to decline in value down to at least the 1.0520 mark: the daily support level.
Data points to consider: There are no high-impacting news events on the docket today relating to these two markets.
Levels to watch/live orders:
- Buys: 1.05/1.0518 ([reasonably sized H4 bullish close required prior to pulling the trigger] stop loss: ideally beyond the trigger candle).
- Sells: Flat (stop loss: N/A).
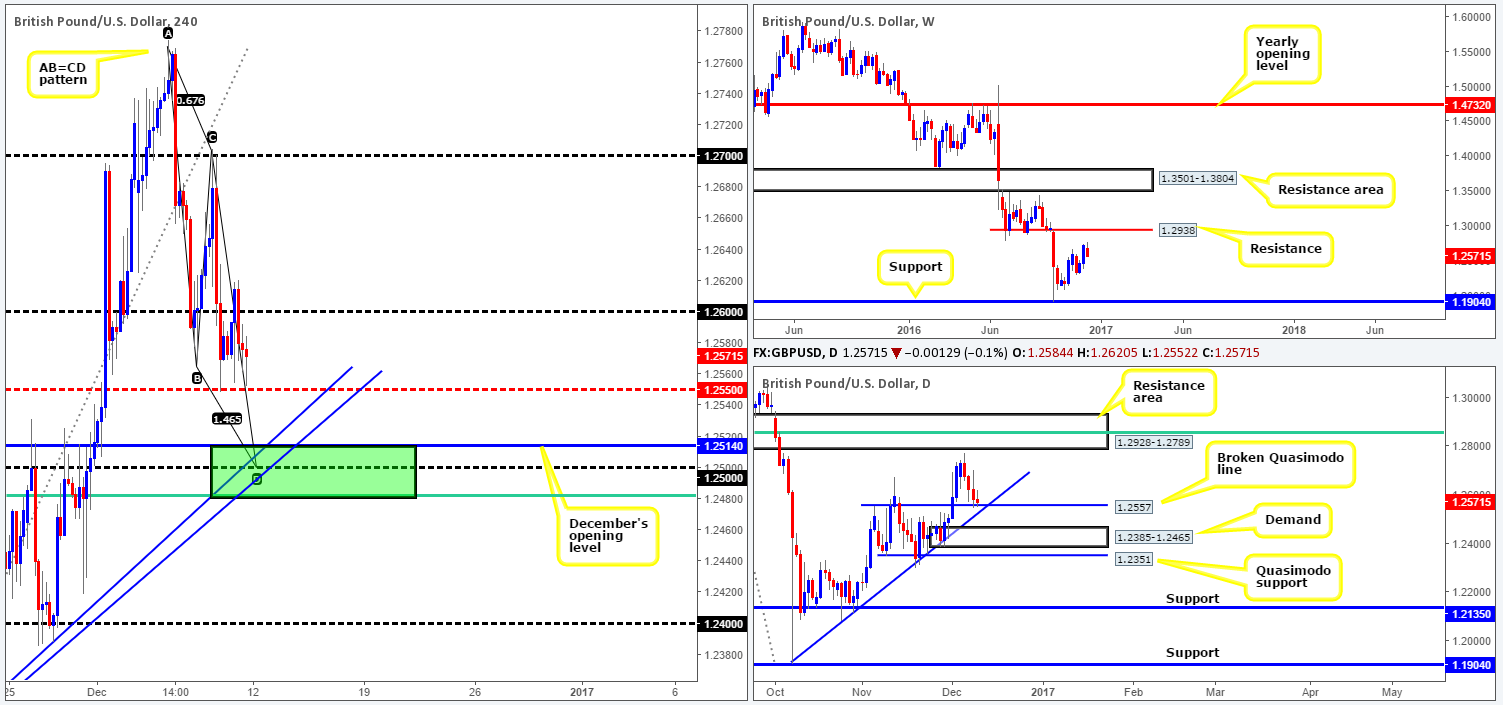
GBP/USD:
Weekly gain/loss: – 150 pips
Weekly closing price: 1.2571
Weekly view: The move north seen from support at 1.1904 is, at least in our view, seen as a correctional one so far rather than a trend change. The next upside objective can be seen at 1.2938: a resistance level, which is where we ultimately expect the bears to make their presence known.
Daily view: Following a near-touch of the resistance area seen at 1.2928-1.2789 (holds the Fib 61.8% resistance within at 1.2853) on Tuesday, the GBP slipped down to the broken Quasimodo support line at 1.2557. For the time being this barrier is seen holding ground, but we cannot rule out the possibility of a fakeout through this level down to the nearby trendline support drawn from the low 1.1904.
H4 view: A quick recap of Friday’s action on the H4 chart shows that the pair gained further traction above the mid-way support at 1.2550 in the early hours of London. Strengthened by a better-than-expected UK goods trade balance reading, price closed above the 1.26 psychological level. However, as can be seen from the chart, the candles failed to sustain gains beyond this hurdle and quickly reversed tracks, with the market closing marginally lower on the day.
Direction for the week: As there is room seen to move north on the weekly chart, along with daily price currently kissing a broken Quasimodo support level (albeit yet to register any noteworthy move), the instrument could potentially trade higher this week.
Direction for today: Despite the current H4 mid-way point at 1.2550 linking nicely with the aforementioned daily broken Quasimodo line, we are looking a little lower on the curve today. Between the H4 61.8% Fib support at 1.2481 (green line) taken from the low 1.2301 and December’s opening level at 1.2514 (green zone) is, in our opinion, a far more attractive zone for price to be drawn to. Not only does the area blend closely with the above said daily trendline support, it boasts a H4 AB=CD bull pattern that completes at the 1.25 handle, and also intersects with two H4 trendline supports extending from the lows 1.2301/1.2113.
Our suggestions: The H4 area highlighted above in green is attractive given its confluence. With that being said, our desk has placed a pending buy order a little above 1.25 at 1.2505, and set a stop just below at 1.2477. As of current price, the first take-profit target will be the 1.2550 point.
Data points to consider: There are no high-impacting news events on the docket today relating to these two markets.
Levels to watch/live orders:
- Buys: 1.2505 ([pending order] stop loss: 1.2477).
- Sells: Flat (stop loss: N/A).
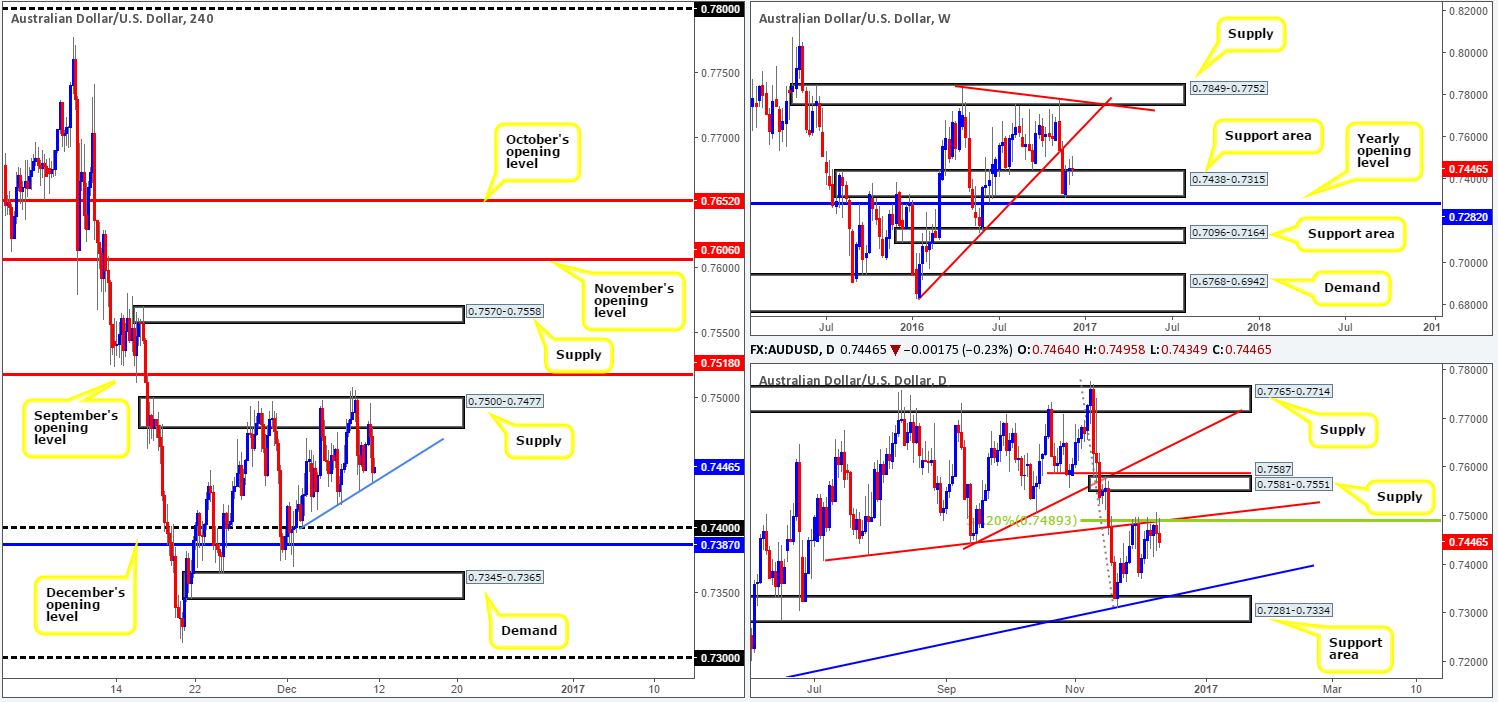
AUD/USD:
Weekly gain/loss: – 6 pips
Weekly closing price: 0.7446
Weekly view: The Aussie market was little changed by the week’s end, consequently recording a mere 6-pip difference from the prior week’s close. As a result, the commodity currency continues to tease the top edge of a support area seen at 0.7438-0.7315. A continuation move higher from this angle could force price to connect with a trendline resistance stretched from the low 0.6827. Meanwhile, a push south from here may portend a fakeout to the 2016 yearly opening level at 0.7282.
Daily view: Despite weekly price floating around a support area at the moment, down here on the daily chart the candles are seen capped by a trendline resistance extended from the low 0.7407 that ties in nicely with a 38.2% Fib resistance at 0.7489 (taken from the high 0.7778). Provided that the bears remain in the driving seat here, the next area of interest falls in at 0.7281-0.7334: a support zone which coincides with trendline support extended from the low 0.7145. A break to the upside, however, has the supply zone at 0.7581-0.7551 to target.
H4 view: A brief look at recent dealings on the H4 chart shows supply at 0.7500-0.7477, once again, did a superb job in keeping the bid-side of this market at bay! A break through the minor trendline support taken from the low 0.7400 could confirm intraday downside to the 0.74 neighborhood. A break through the current supply on the other hand, parks the unit within reaching distance of September’s opening level at 0.7518.
Direction for the week: Before weekly bulls can take control from the current support zone, daily sellers must be consumed around the aforementioned daily trendline resistance. Nonetheless, even with a break above this line there’s not much room to play with given the nearby daily supply at 0.7581-0.7551! Therefore, our team has stamped medium-term direction as ‘restricted’ for the time being.
Direction for today: Similar to medium-term direction, short-term direction is also rather cramped at the moment. As such, we feel price could bounce either way today. Ultimately, however, we do not imagine the market breaching much past the 0.74 region, or September’s opening barrier mentioned above at 0.7518.
Our suggestions: Although a H4 close below the current H4 trendline support may open up the runway south down to 0.74, there is not much room for profit between here and 0.74! What’s more, by selling here you’re potentially placing yourself against weekly flow from the weekly support area at 0.7438-0.7315. This – coupled with little scope to buy on the H4 has left us with little choice but to remain flat for now.
Data points to consider: There are no high-impacting news events on the docket today relating to these two markets.
Levels to watch/live orders:
- Buys: Flat (stop loss: N/A).
- Sells: Flat (stop loss: N/A).
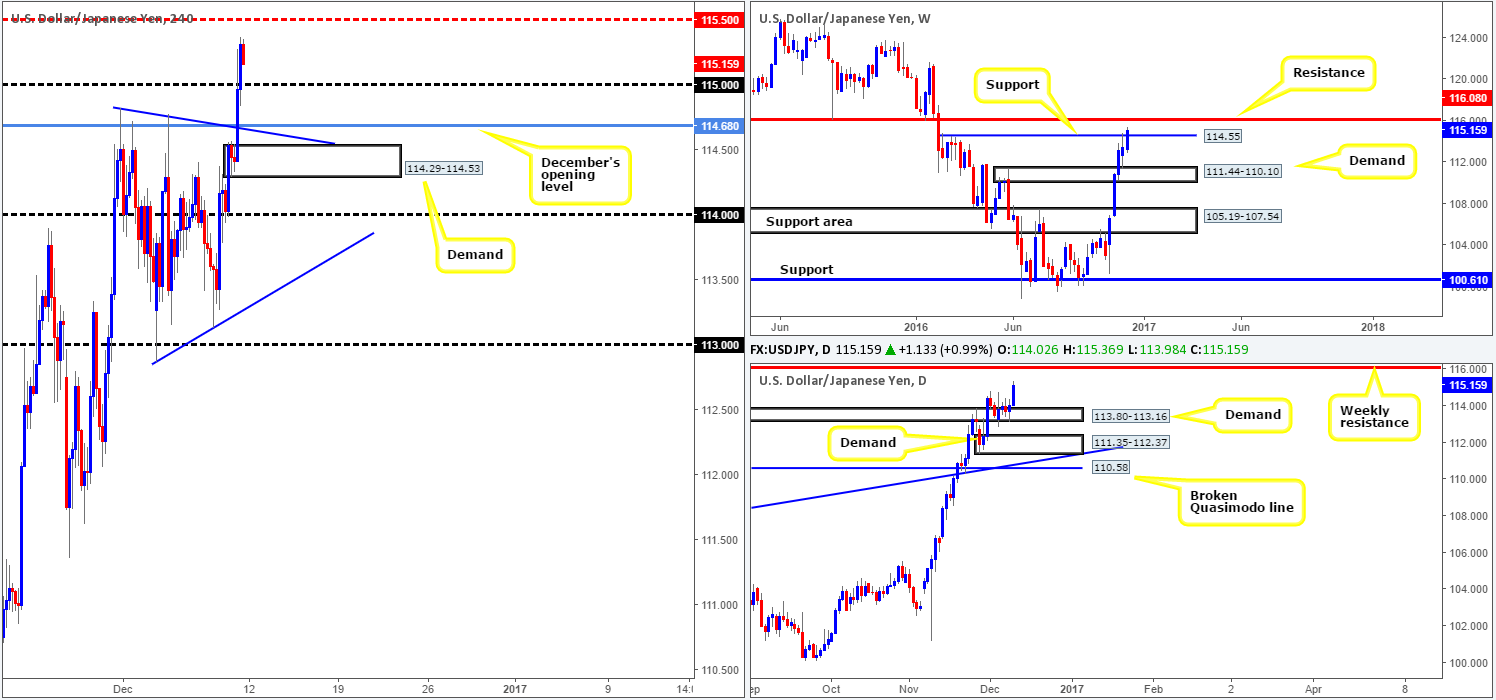
USD/JPY:
Weekly gain/loss: + 167 pips
Weekly closing price: 115.15
Weekly view: Last week’s rally marked the fifth consecutive bullish week for the pair. Running through offers at resistance drawn from 114.55 (now acting support), the river now looks relatively ripple free up to nearby resistance coming in at 116.08.
Daily view: Supply-turned demand at 113.80-113.16 continued to hold ground last week despite displaying little bullish intent. From daily price, we see absolutely no reason (due to there being little active supply seen to the left) why price cannot reach the aforementioned weekly resistance level sometime this week.
H4 view: Going into Friday’s morning segment the H4 bulls were on fire, eventually dragging price above the 115 handle. Reinforced by the better-than-expected US consumer report at 15.00pm GMT, the pair retested 115 as support and closed the week higher. Other than the H4 mid-way resistance at 115.50, we see little standing in the way of price reaching the weekly resistance level this week!
Direction for the week: As far as we can see, there is absolutely no higher-timeframe resistance on the horizon until we reach the above said weekly resistance base. With that being said, our desk believes the pair will continue gravitating higher until we reach this level.
Direction for today: The 115 handle will likely continue to hold firm as support and rally price to challenge offers around the H4 mid-way point 115.50. In the event that 115 fails to provide, the next downside hurdle in view is December’s opening level at 114.68, followed closely by H4 demand at 114.29-114.53 which boasts additional support from a H4 trendline taken from the high 114.82.
Our suggestions: A long from 115 is of interest to our desk today. Trading this level without confirmation, however, is, in our book, just asking for trouble! Psychological boundaries are susceptible to fakeouts and with December’s opening level sitting a little more than 30 pips away, the chances of seeing a fakeout here is high! Therefore, waiting for at least a lower timeframe buy signal (see the top of this report) to form is recommended. The first take-profit target from this angle would, of course, be the 115.50 point and then the 116 handle which, as we’re sure you already see, essentially signifies the aforementioned weekly resistance level.
Data points to consider today: There are no high-impacting news events on the docket today relating to these two markets.
Levels to watch/live orders:
- Buys: 115 region ([wait for a lower timeframe confirmed buy signal to form prior to pulling the trigger] stop loss: dependent on where one confirms this area).
- Sells: Flat (stop loss: N/A).
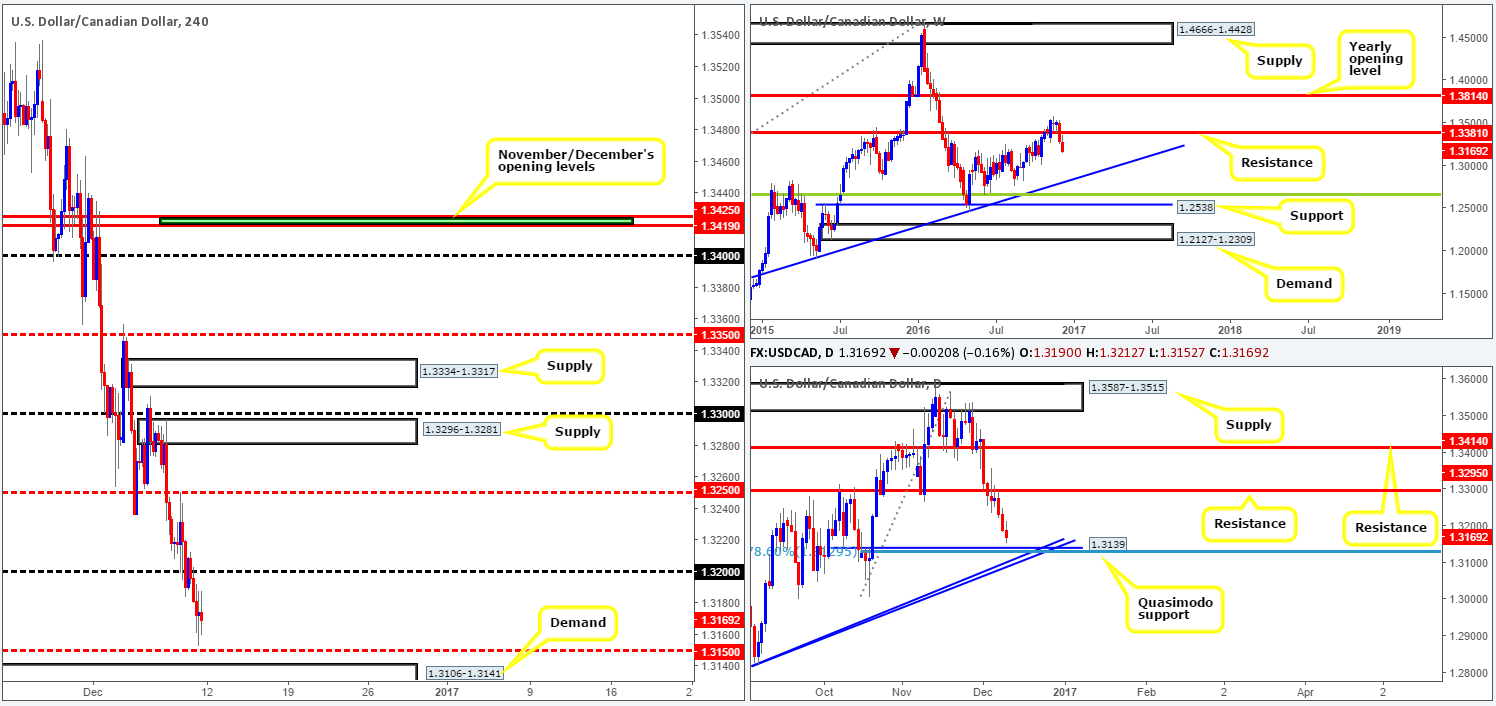
USD/CAD:
Weekly gain/loss: – 96 pips
Weekly closing price: 1.3169
Weekly view: Following a decisive close below support at 1.3381 two weeks back, the sellers extended this decline last week in the shape of a near-full-bodied bearish candle. To our way of seeing things, weekly price action below here looks relatively cramped. The only level that really catches our eye right now is the trendline support taken from the high 1.1278.
Daily view: The retest of resistance at 1.3295 on Wednesday, as you can see, sparked a selloff during Thursday and Friday’s sessions. Consequent to this, the commodity currency now trades within touching distance of Quasimodo support carved from 1.3139. As we hope is demonstrated on the chart, the Quasimodo level also sports a 78.6% Fib support at 1.3129 (taken from the low 1.3006) and two nearby trendline supports etched from the lows 1.2460/1.2763.
H4 view: Recent action over in the oil market shows that price extended Thursday’s bounce from H4 support at 49.80 and went on to clock fresh highs of 51.63 by the closing bell. Following a retest to the underside of the 1.32 handle the USD/CAD pushed further into losses on Friday, reaching lows of 1.3152 by the week’s end.
Direction for the week: According to weekly structure, there is scope for further downside. However, the daily chart, as mentioned above, shows that a support in the form of a Quasimodo pattern is lurking nearby. With the potential for a rebound from this area being reasonably high, our desk has noted that medium-term direction is limited at the moment.
Direction for today: Sitting just beyond the nearby H4 mid-way support at 1.3150 is a H4 demand base coming in at 1.3106-1.3141. Taking into account that this zone houses the daily Quasimodo support at 1.3139 and its partner 78.6% Fib support at 1.3129, as well as October’s opening level at 1.3120, this area could potentially act as a magnet to price today.
Our suggestions: We have two grumbles regarding a buy from the above noted H4 demand area. The first is the weekly chart threatening us with the possibility of further selling this week. Secondly, seeing as how the H4 demand is positioned just ahead of the psychological level 1.31, the possibility of a fakeout is high. Looking on the bright side, nevertheless, there is, as explained above, a strong collection of supports fixed around the H4 demand!
Therefore, we support a buy from here if, and only if, a H4 bull candle forms. Of course, this will not guarantee a winning trade, but what it will do is show one that there are interested buyers, hence lessening the likelihood of being stopped out.
Data points to consider today: There are no high-impacting news events on the docket today relating to these two markets.
Levels to watch/live orders:
- Buys: 1.3106-1.3141 ([reasonably sized H4 bullish close required prior to pulling the trigger] stop loss: ideally beyond the trigger candle).
- Sells: Flat (stop loss: N/A).
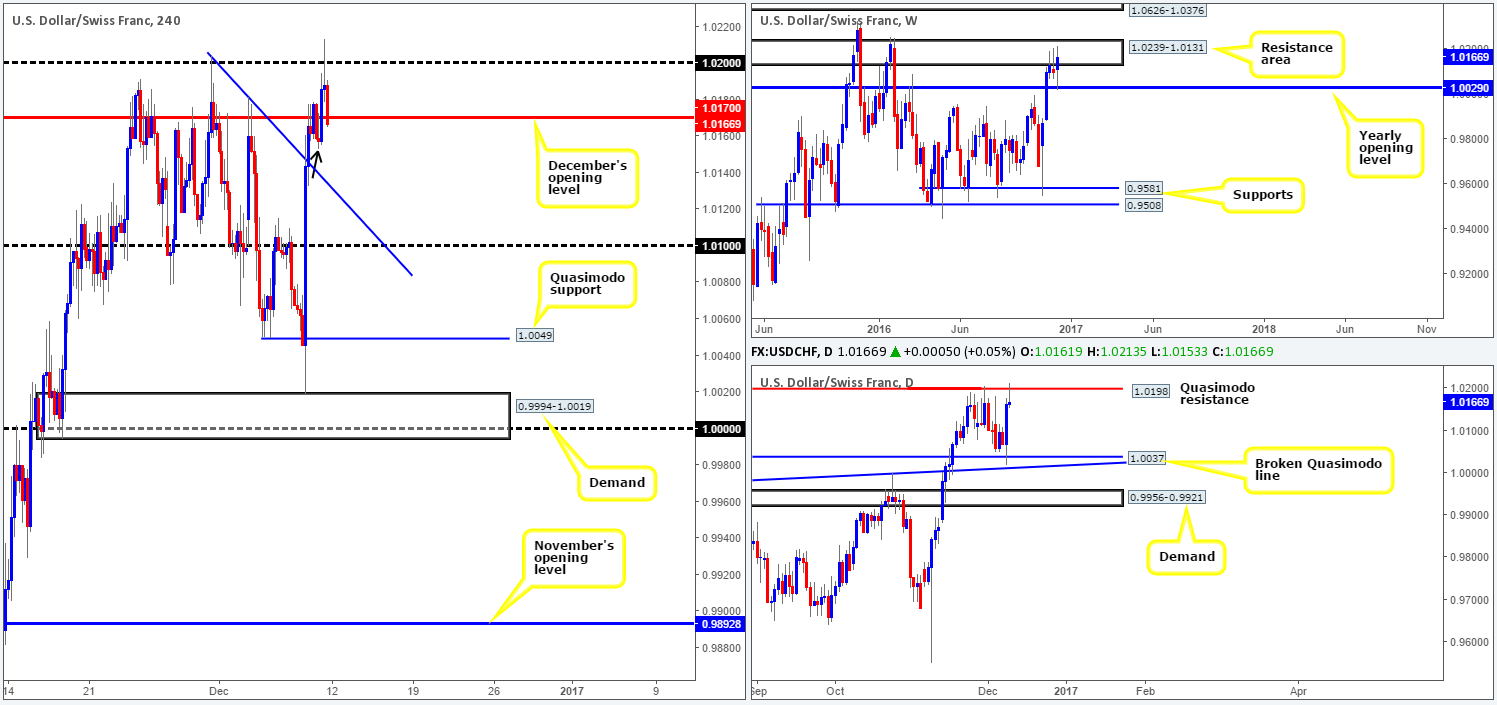
USD/CHF:
Weekly gain/loss: + 68 pips
Weekly closing price: 1.0166
Weekly view: Over the past three weeks the weekly candles have effectively been capped by a resistance area logged in at 1.0239-1.0131. Thanks largely to the ECB’s recent announcement of tapering/QE extension, however, the pair stretched lower from here and probed the 2016 yearly opening level at 1.0029 last week. This forced price to rally and engulf the two prior weekly candles as well as push higher into the said resistance zone.
Daily view: The story on the daily chart, nonetheless, shows that although the daily candles reacted beautifully from the broken Quasimodo support line at 1.0037, the Quasimodo resistance at 1.0198, once again, held ground. The rebound from this level formed a nice-looking bearish selling wick, which to a lot of candlestick enthusiasts, would likely be considered a sell signal. Follow-through selling here this week could potentially bring the pair back down to connect with the aforementioned broken Quasimodo line.
H4 view: (Trade update: pending sell order at 1.0188 was removed due to price trading nearby the level 30 or so minutes pre high-impacting news – for details please see Friday’s report).
Reviewing Friday’s movement on the H4 chart reveals that price drove higher during the London morning segment, and breached the 1.02 handle on the back of hotter-than-expected US consumer data at 15.00pm GMT. Nevertheless, bids quickly withered up and the pair rotated to the downside, concluding the week by marginally closing beyond December’s opening level at 1.0170.
Direction for the week: Although weekly action closed the week higher within the current resistance area, the response seen from the daily Quasimodo resistance level at 1.0198 is striking! To that end, our team remains in the sellers’ side of the camp for the time being.
Direction for today: This, we believe, all depends on how price answers to the H4 low marked with a black arrow at 1.0153. Should a H4 close be seen beyond this pivot, the next support in view is a trendline extended from the high 1.0204, followed by 1.01. If the bulls respond from here, nevertheless, this will place December’s opening level mentioned above at 1.0170 in the spotlight.
Our suggestions: Put simply, trading this pair is, at least for the time being, a waiting game. Ultimately, however, we’re waiting to see a close print below the H4 pivot discussed above at 1.0153. That way a short could be possible on the retest of December’s opening level should price follow through with a H4 bearish (confirming) close.
Data points to consider today: There are no high-impacting news events on the docket today relating to these two markets.
Levels to watch/live orders:
- Buys: Flat (stop loss: N/A).
- Sells: Watch for a close below the H4 pivot at 1.0153 and then look to trade any retest seen at December’s opening level drawn from 1.0170 ([reasonably sized H4 bearish close required prior to pulling the trigger] stop loss: ideally beyond the trigger candle).
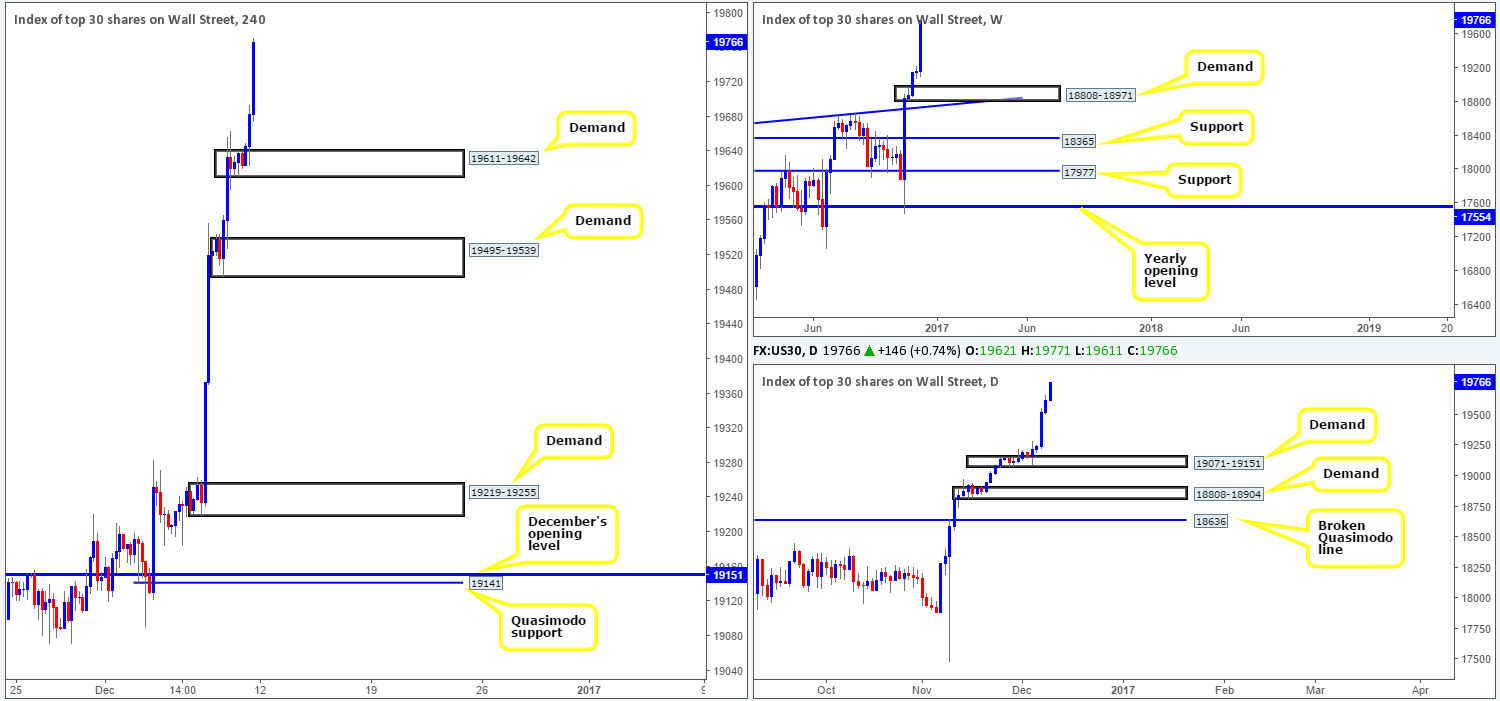
DOW 30:
Weekly gain/loss: + 599 points
Weekly closing price: 19766
Weekly view: The US equity market closed at record highs of 19771 on Friday, gaining around 600 points into the close. Since Trump’s victory the DOW has soared, with the majority of the 30 individual stocks displaying gains! This begs the question, how long can the buyers continue to fuel such a rally?
Should the market pullback, the demand area at 18808-18971 that converges with trendline support taken from the high 18365 is where we believe the index could withdraw to on this timeframe.
Daily view: Down on the daily scale, we can see that last week’s rally boasted an incredible five-out-of-five bullish sessions! This, as you can see, helped form demand at 19071-19151, which, according to this timeframe, is the next support hurdle in the mix should a retracement be seen (planted above the aforementioned weekly demand).
H4 view: In view of Friday’s rally, a new demand was also created here at 19611-19642. Of course, this H4 demand has no connection to higher-timeframe structure, but what it does do is give us a base to potentially work this week.
Direction for the week: Although a pullback is a possibility, the overall tone remains biased to the upside given the lack of higher-timeframe resistance, and the strong momentum we’ve seen post US election.
Direction for today: Monday’s are notoriously slow-moving days. This – coupled with the economic calendar also being relatively light too, we do not anticipate much movement today. However, do keep a check on the H4 demand base coming in at 19611-19642 for potential longs.
Our suggestions: In that the above noted H4 demand looks reasonably strong; our team has come to a general consensus that a long from here is promising with the backing of a reasonably sized H4 bull candle. A decisive push below this boundary on the other hand, could be an early cue to a move back down to H4 demand at 19495-19539.
Data points to consider today: There are no high-impacting news events on the docket today that will likely cause any considerable moves in this market.
Levels to watch/live orders:
- Buys: 19611-19642 ([reasonably sized H4 bullish close required prior to pulling the trigger] stop loss: ideally beyond the trigger candle).
- Sells: Flat (stop loss: N/A).
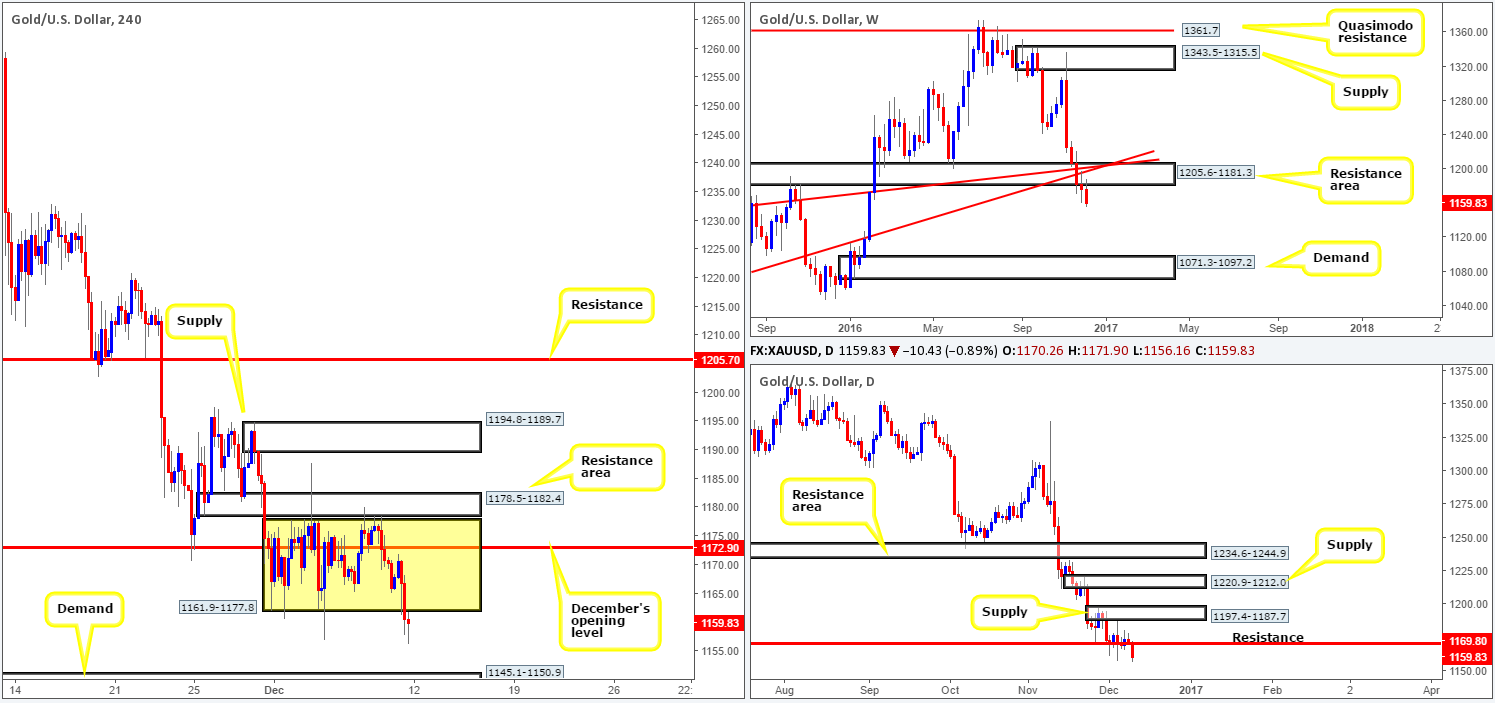
GOLD:
Weekly gain/loss: – $17
Weekly closing price: 1159.8
Weekly view: After four weeks of consecutive losses, the yellow metal extended lower for a fifth session last week. With the support area at 1205.6-1181.3 (now acting resistance) engulfed, the next downside target is visible at 1071.3-1097.2: a demand area that claims strong bullish momentum from its base.
Daily view: Over the past week, the daily candles found a pocket of support around the 1169.8 neighborhood. Our desk noted on several occasions during the week that in order to confirm a bearish stance beneath the aforementioned weekly resistance area, a decisive daily close would need to be seen beyond this daily level. As can be seen from the chart, this did in fact take place amid Friday’s session, thus potentially opening up the possibility of a continuation move lower this week down to demand coming in at 1108.2-1117.8.
H4 view: Since the beginning of last week, the yellow metal was seen limited within the walls of a consolidation zone fixed at 1161.9-1177.8. However, alongside the close below the above noted daily support level came with it a H4 close beyond the H4 range lows. This was a noted move to watch for in Friday’s report, since a retest to the underside of this area followed up with a reasonably sized H4 bearish candle would, in our book, be sufficient enough for our team to sell, targeting the demand at 1145.1-1150.9 as a first take-profit zone.
Direction for the week: With the weekly support area looking as though it will soon become a distant memory, as well as daily support taken out on Friday, another wave of selling could be seen in the week ahead!
Direction for today: Given the break through the lower edge of the current H4 range, intraday sentiment is likely to take on a bearish tone during Asia, at least until we arrive at the aforementioned H4 demand zone.
Our suggestions: Seeing as H4 action retested the underside of the H4 range edge prior to the week’s close, all we have need of now is a reasonably sized H4 bearish close to signal a sell from current price today.
Levels to watch/live orders:
- Buys: Flat (stop loss: N/A).
- Sells: Watch for a reasonably sized H4 bearish close to form around the H4 range lows 1161.9 (stop loss: ideally beyond the trigger candle).


