
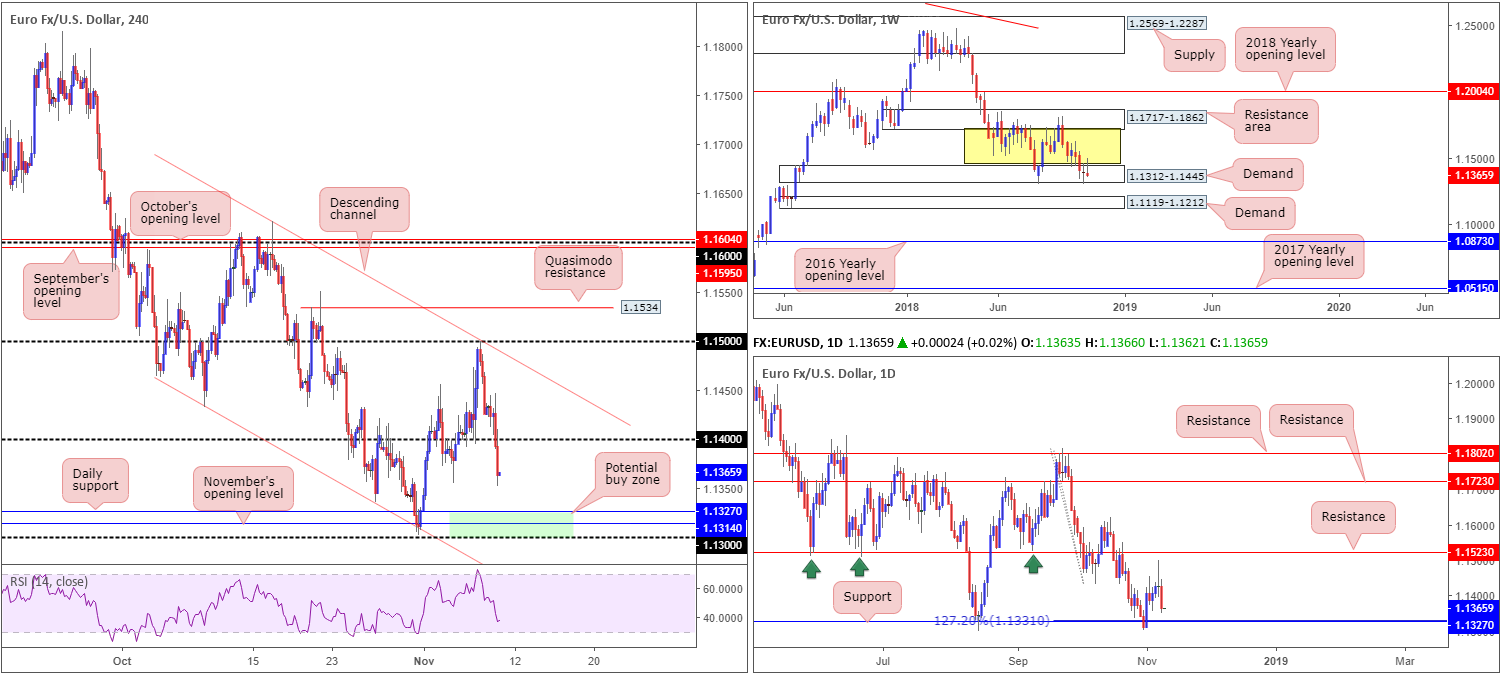
EUR/USD:
On the back of latest budget exchanges between Italy and the EU, as well as The FOMC keeping rates unchanged at 2.00-2.25%, as expected, this cemented the single currency’s position beneath 1.14 on Thursday. The FOMC statement was also little changed, though remains reasonably upbeat, potentially paving the way for a December rate hike.
With weekly demand at 1.1312-1.1445 appearing somewhat fragile at the moment, its last line of defense rests around the 1.1327 neighbourhood: a daily support level that fuses closely with a 127.2% daily Fib ext. point at 1.1331. While H4 price is showing signs of rejection from the 1.1374 November 5 low, the next support target on this scale resides at 1.1314: November’s opening level (positioned just north of the 1.13 handle). An additional point to consider is the RSI indicator is seen fast approaching its oversold region.
Areas of consideration:
Although the current weekly demand seems delicate, there’s still hope according to the overall technical picture. On the H4 timeframe, the area between the daily support at 1.1327, November’s opening level at 1.1314 and the round number 1.13 is shaded in green as a potential buy zone. In addition to this, when, or indeed if, price reaches this far south, the H4 RSI indicator will likely be flirting with oversold terrain by this point.
As a fakeout may occur beyond 1.13 (common viewing around psychological numbers), waiting for additional candlestick confirmation to form before pulling the trigger out of 1.13/1.1327 is an option. As for an initial upside target, 1.1350 appears reasonably logical, followed by the 1.14 handle.
Today’s data points: US PPI m/m; FOMC member Quarles speaks, US prelim UoM consumer sentiment.
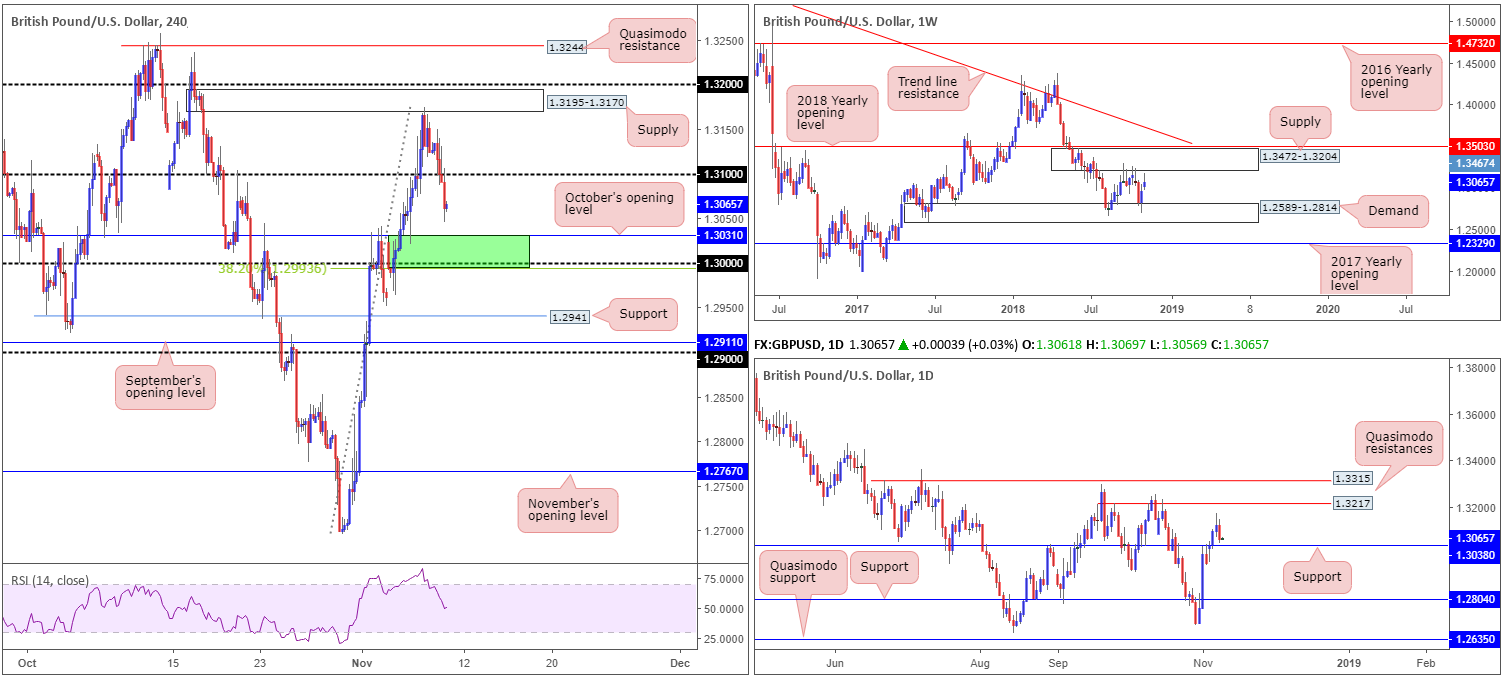
GBP/USD:
After losing grip of its 1.31 handle on several occasions Thursday, the British pound eventually ceded ground against its US counterpart and clocked lows just north of October’s opening level at 1.3031. Catalysts behind yesterday’s move lower fall on the back of contrasting Brexit headlines, along with FOMC keeping rates unchanged at 2.00-2.25%, as expected.
From a technical standpoint, daily movement hints at a possible test of nearby support coming in at 1.3038, while on the H4 scale, room to push marginally beneath this barrier is seen. October’s opening level at 1.3031 (as highlighted above) is on the radar, as is the key figure 1.30 and a 38.2% Fib support at 1.2993. It might also be worth noting weekly price has yet to connect with its supply zone at 1.3472-1.3204, therefore the possibility of the unit correcting higher remains baked in for this unit.
Areas of consideration:
Should the market observe signs of buying pressure (bullish candlestick structures – entry/stop parameters can be defined by the candlestick structure) emanate from 1.2993/1.3031: a green H4 buy zone, a long from here is considered high probability, targeting 1.31 as the initial upside objective.
Today’s data points: UK GDP m/m; UK manufacturing production m/m; UK prelim GDP q/q; US PPI m/m; FOMC member Quarles speaks, US prelim UoM consumer sentiment.
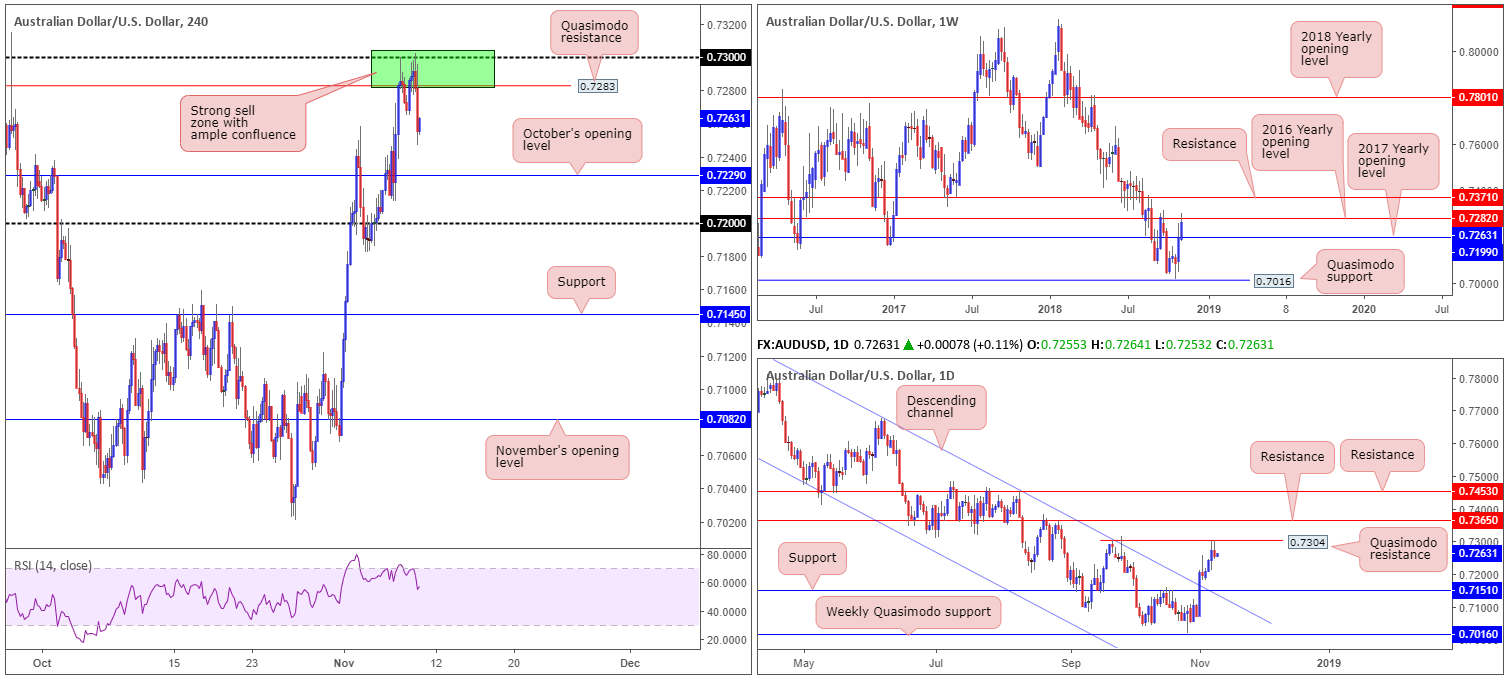
AUD/USD:
Once again, the AUD/USD found itself around 0.73 territory Thursday, though failed to sustain gains beyond this point. Down 0.24% on the day, a resurgence of bidding entered USD markets amid the latest round of FOMC action, consequently weighing on the commodity currency.
For those who read previous reports, the spotlight was drawn towards 0.7304/0.7282 as a possible sell zone: an area shaded green on the H4 timeframe. Besides the H4 structure (the round number 0.73 and Quasimodo resistance at 0.7283), having the 2016 yearly opening level at 0.7282 positioned nearby (weekly timeframe), and a daily Quasimodo resistance sited directly above 0.73 at 0.7304, added considerable weight, according to our technical reading.
Well done to any of our readers who remain short this market. In terms of take-profit targets, the first objective was recently met at 0.7258 (last Friday’s high), with eyes on October’s opening level at 0.7229 as the next port of call. Of course, price action could eventually push for a test of 0.72, as it merges with the next downside target on the weekly scale: the 2017 yearly opening level at 0.7199.
Areas of consideration:
Traders are urged to consider reducing risk to breakeven from 0.7304/0.7282, owing to the RBA making an appearance in early Asia this morning. Although no change is expected, which has been the case for more than 2 years, an AUD/USD response is likely.
Today’s data points: RBA monetary policy statement; US PPI m/m; FOMC member Quarles speaks, US prelim UoM consumer sentiment.
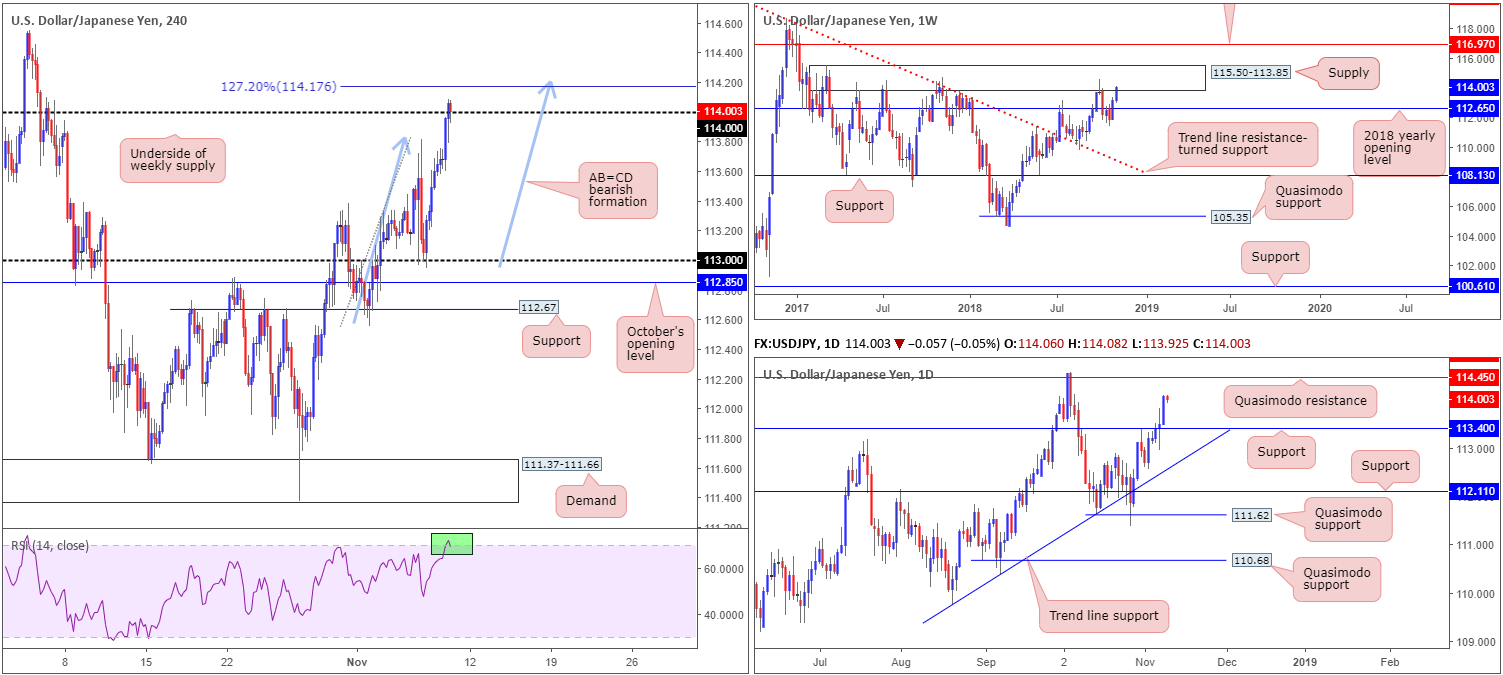
USD/JPY:
While Thursday’s US Federal Reserve monetary policy decision brought about little change, the US dollar advanced higher against its Japanese peer and made a run for the 114 handle on the H4 timeframe. What this also did was highlight a possible AB=CD (blue arrows) bearish pattern that terminates around the 114.17ish region (127.2% Fib ext. point).
In terms of the bigger picture, recent buying brought the USD/JPY exchange rate into supply territory at 115.50-113.85. Note this supply has incredibly strong history dating as far back as May 2017. Despite strong selling likely to occur from here, daily action displays room to climb towards Quasimodo resistance at 114.45 (sited within the weekly supply).
Areas of consideration:
Keeping things simple this morning, possible shorting opportunities are seen around the 114.17 neighbourhood: the H4 AB=CD completion point. Besides having weekly price shake hands with supply at 115.50-113.85, the H4 RSI indicator presents an overbought reading.
As there’s a risk of price overthrowing 114.17 for a move towards the daily Quasimodo resistance at 114.50, traders are urged to consider waiting for additional bearish candlestick confirmation before pulling the trigger (entry/stop parameters can be defined by the candlestick structure). A H4 close back beneath 114 is also important. Ultimately the first take-profit target from here is seen at daily support drawn from 113.40.
Today’s data points: US PPI m/m; FOMC member Quarles speaks, US prelim UoM consumer sentiment.
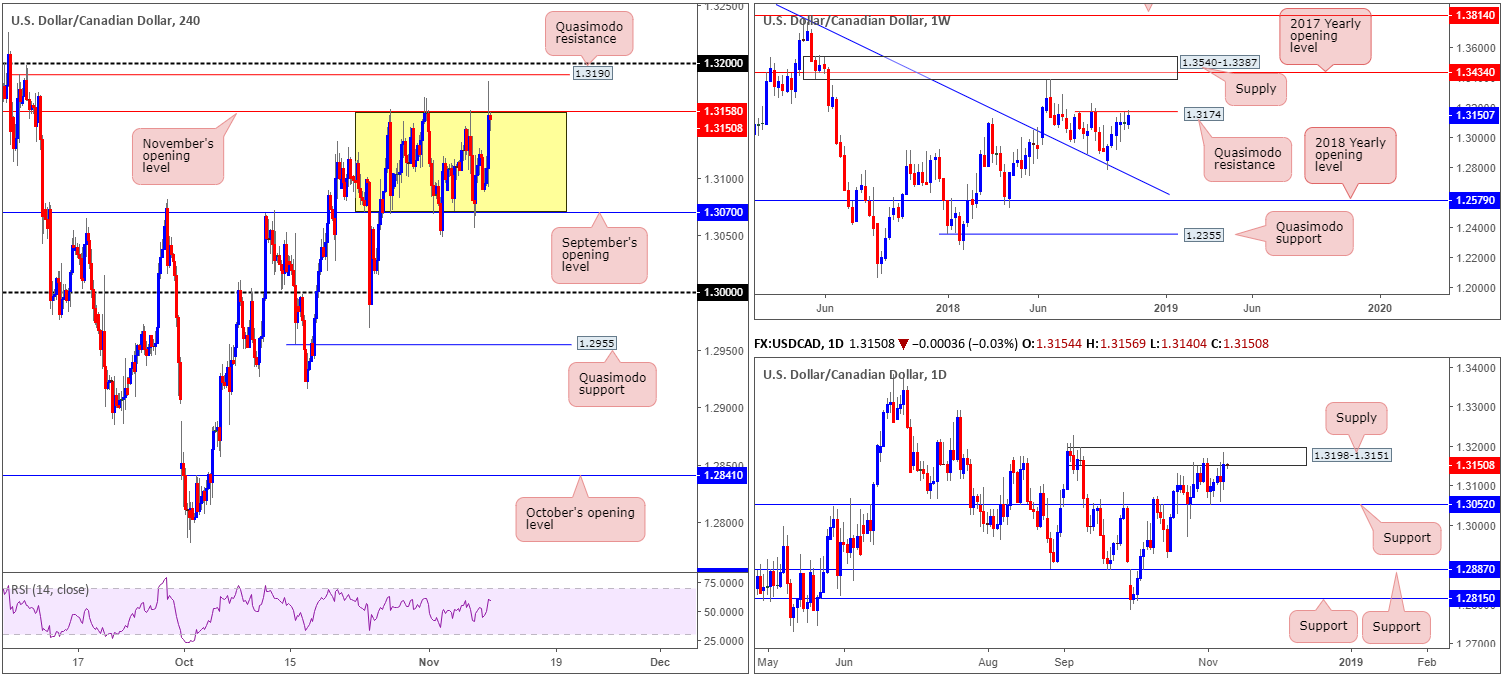
USD/CAD:
In recent sessions, H4 price decorated its chart with a strong bullish candle in response to the latest FOMC action, though failed to maintain a bullish presence above November’s opening level at 1.3158. Since October 26 the H4 candles have been busy carving out a consolidation (yellow) between November’s opening level and September’s opening level at 1.3070. Outside of this border, a Quasimodo resistance rests at 1.3190 (sited just south of the 1.32 handle), along with the key figure 1.30.
Supporting the H4 range, daily price is seen sandwiched between supply drawn from 1.3198-1.3151 and support coming in at 1.3052. Higher up on the curve, however, we have weekly price meandering beneath Quasimodo resistance plotted at 1.3174.
Areas of consideration:
Having seen weekly price hovering beneath a Quasimodo resistance, entering long remains a challenge. With that in mind, focus is still drawn towards the H4 Quasimodo resistance at 1.3190 for possible shorting opportunities. Not only do we have the weekly Quasimodo resistance floating nearby, daily supply at 1.3198-1.3151 is in view as well (see above).
In terms of stop-loss order placement, above the daily supply edge (1.3198) appears a logical option, though do try to include the 1.32 handle here as well (conservative stops will likely be looking above the weekly Quasimodo apex [1.3226]). As for potential targets, November’s opening level mentioned above at 1.3158 appears a logical first step, followed by September’s open level at 1.3070.
Today’s data points: US PPI m/m; FOMC member Quarles speaks, US prelim UoM consumer sentiment.
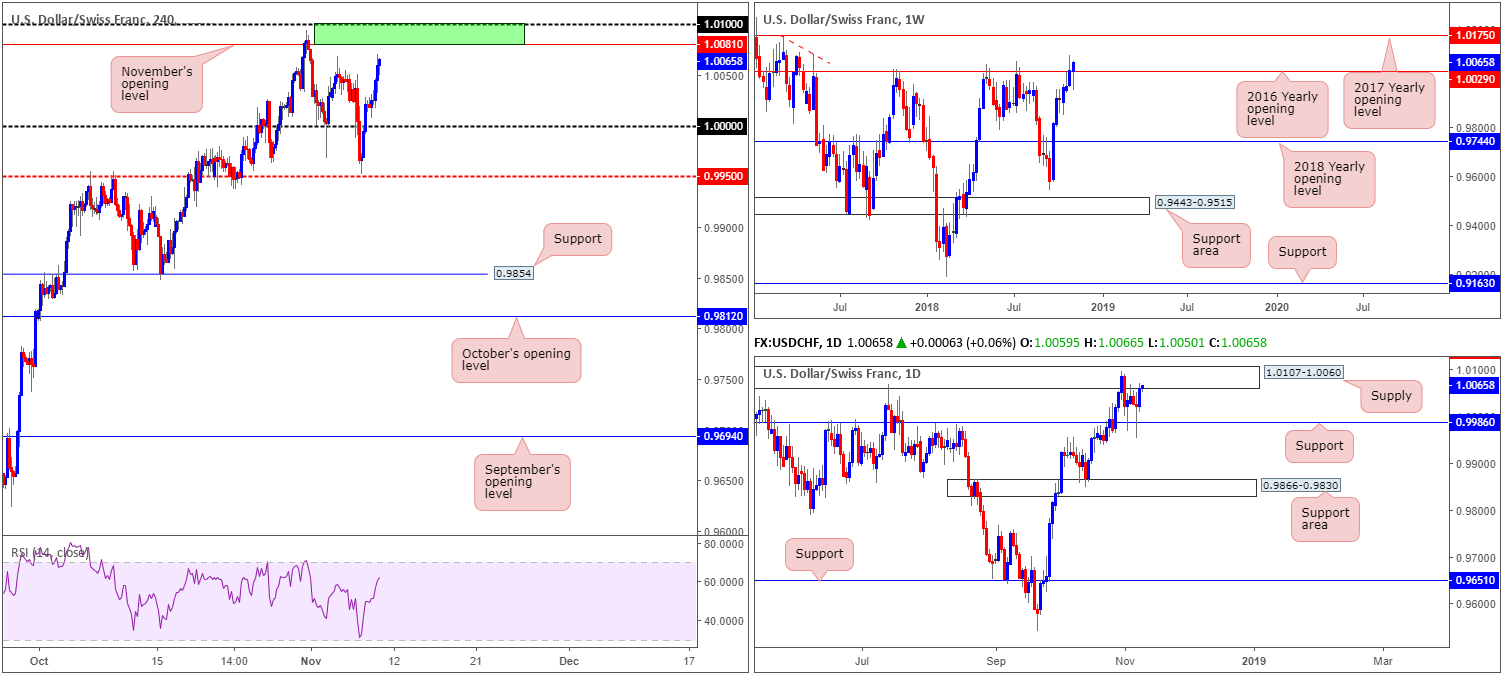
USD/CHF:
USD/CHF trade put in a reasonably strong performance Thursday, up 0.38%. Bolstered by latest FOMC movement, the H4 candlesticks are currently touching gloves with the 1.0069 Nov 5 high, positioned just south of November’s opening level at 1.0081 and the 1.01 handle.
While the area (marked in green) between 1.01/1.0081 could potentially hold price action lower, the higher-timeframe picture offers a somewhat mixed opinion in terms of structure. The story on the weekly timeframe shows price action engulfing the 2016 yearly opening level at 1.0029. Although this level boasts incredibly strong history, we see little resistance above this number until price shakes hands with the 2017 yearly opening level at 1.0175. Daily flow, on the other hand, is challenging the underside of supply at 1.0107-1.0060. It will take a break of this area, according to our technical studies, to confirm upside beyond the 2016 open level.
Areas of consideration:
With daily supply at 1.0107-1.0060 in the picture, selling from the H4 green zone marked at 1.01/1.0081 is an option today. However, to be on the safe side, waiting for additional H4 candlestick confirmation to form is recommended. While this will not guarantee a winning trade, it will display bearish intent and provide entry/stop parameters. In regard to downside targets, parity (1.0000) looks reasonable, shadowed closely by daily support at 0.9986.
Today’s data points: US PPI m/m; FOMC member Quarles speaks, US prelim UoM consumer sentiment.
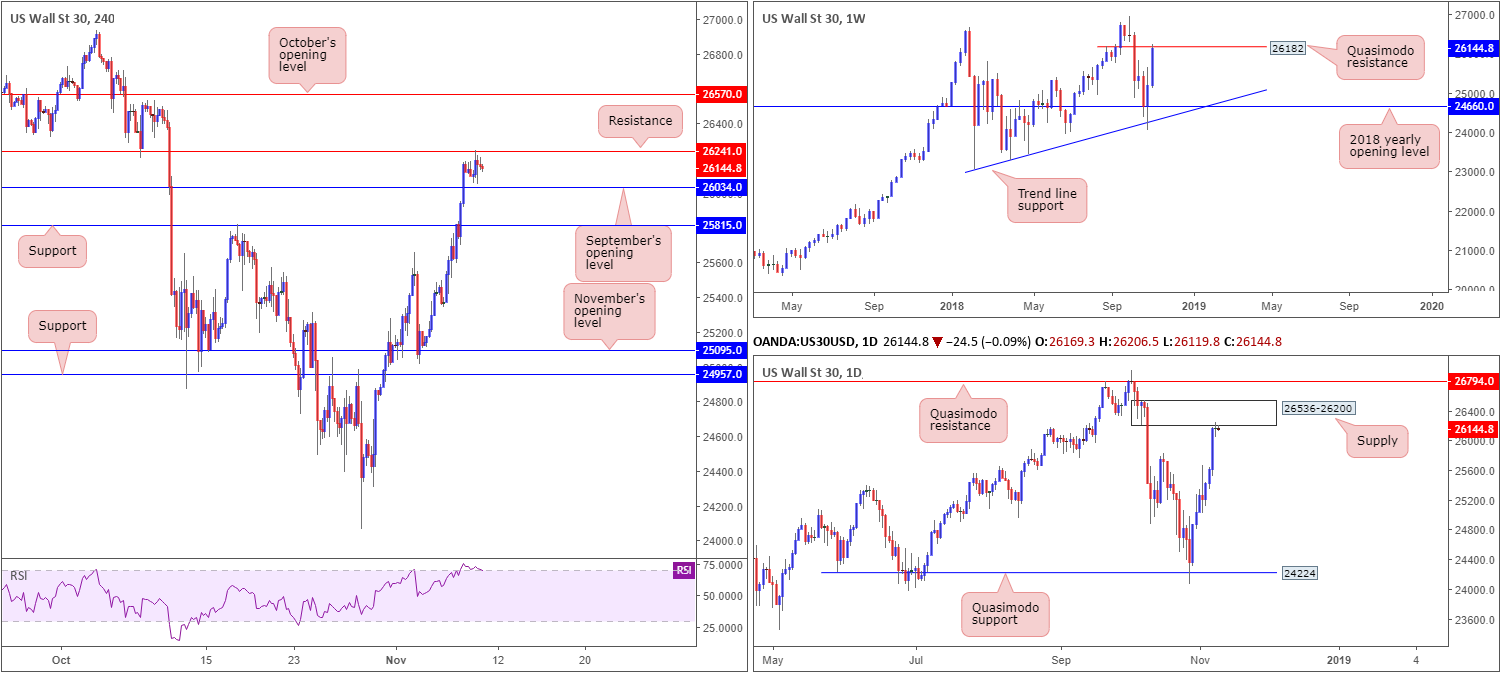
Dow Jones Industrial Average:
With the FOMC keeping rates unchanged at 2.00-2.25%, as expected, price action faded H4 resistance at 26241 Thursday. For those who read Thursday’s briefing you may recall the piece highlighted the said resistance as a potential sell zone.
The team underscored this level largely due to where price is trading from on the higher-timeframe picture, though it also helped seeing the H4 RSI indicator trade within overbought territory. Weekly price is seen kissing the underside of a Quasimodo resistance level at 26182. Overthrowing this barrier, though, could eventually lead to fresh record highs being seen. A closer look at price action on the daily timeframe has supply at 26536-26200 in view. A break of this area has a Quasimodo resistance at 26794 to target.
Areas of consideration:
With the higher timeframes displaying reasonably strong evidence the index may explore lower ground, selling this market remains in focus. Traders who managed to sell 26241 yesterday, well done. Ultimately, a break of September’s opening level at 26034 is eyed for said traders. A violation of this level then leaves H4 support at 25815 on the hit list as an initial take-profit target.
Today’s data points: US PPI m/m; FOMC member Quarles speaks, US prelim UoM consumer sentiment.
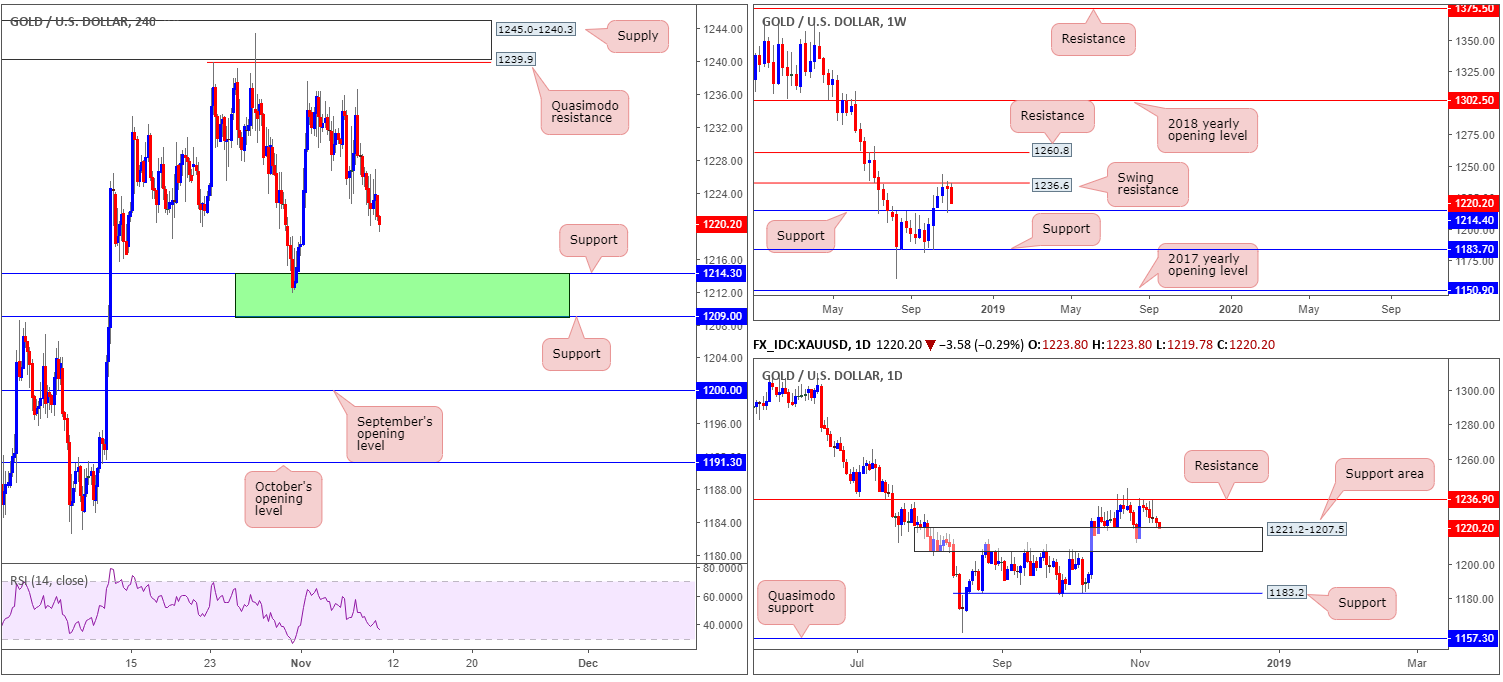
XAU/USD (Gold):
The yellow metal ceded further ground to the US dollar Thursday, as recent FOMC movement provided fresh impetus to the greenback.
As is evident from the charts, this has seen weekly price near its support level at 1214.4, and brought daily price to the top edge of a support area coming in at 1221.2-1207.5. Against the backdrop of intraday flow, we can also see the H4 candles pressing towards two layers of support at 1214.3/ 1209.0, both of which have strong connections to the higher-timeframe supports mentioned above.
Areas of consideration:
Focus remains on potential buying opportunities out of the green shaded zone on the H4 at 1209.0/1214.3.
Aggressive traders looking to enter long at 1214.3 and place stops beneath 1209.0 should remain aware of the possibility of a fakeout into the daily support area, given its lower base is limited by 1207.5. For conservative traders, waiting for additional candle confirmation is an alternative (entry/stop parameters can be defined by the candlestick structure).
The use of the site is agreement that the site is for informational and educational purposes only and does not constitute advice in any form in the furtherance of any trade or trading decisions.
The accuracy, completeness and timeliness of the information contained on this site cannot be guaranteed. IC Markets does not warranty, guarantee or make any representations, or assume any liability with regard to financial results based on the use of the information in the site.
News, views, opinions, recommendations and other information obtained from sources outside of www.icmarkets.com.au, used in this site are believed to be reliable, but we cannot guarantee their accuracy or completeness. All such information is subject to change at any time without notice. IC Markets assumes no responsibility for the content of any linked site. The fact that such links may exist does not indicate approval or endorsement of any material contained on any linked site.
IC Markets is not liable for any harm caused by the transmission, through accessing the services or information on this site, of a computer virus, or other computer code or programming device that might be used to access, delete, damage, disable, disrupt or otherwise impede in any manner, the operation of the site or of any user’s software, hardware, data or property.


