
A note on lower timeframe confirming price action…
Waiting for lower timeframe confirmation is our main tool to confirm strength within higher timeframe zones, and has really been the key to our trading success. It takes a little time to understand the subtle nuances, however, as each trade is never the same, but once you master the rhythm so to speak, you will be saved from countless unnecessary losing trades. The following is a list of what we look for:
- A break/retest of supply or demand dependent on which way you’re trading.
- A trendline break/retest.
- Buying/selling tails/wicks – essentially we look for a cluster of very obvious spikes off of lower timeframe support and resistance levels within the higher timeframe zone.
- Candlestick patterns. We tend to stick with pin bars and engulfing bars as these have proven to be the most effective.
We search for lower timeframe confirmation between the M15 and H1 timeframes, since most of our higher-timeframe areas begin with the H4. Stops are usually placed 5-10 pips beyond confirming structures.
EUR/USD:
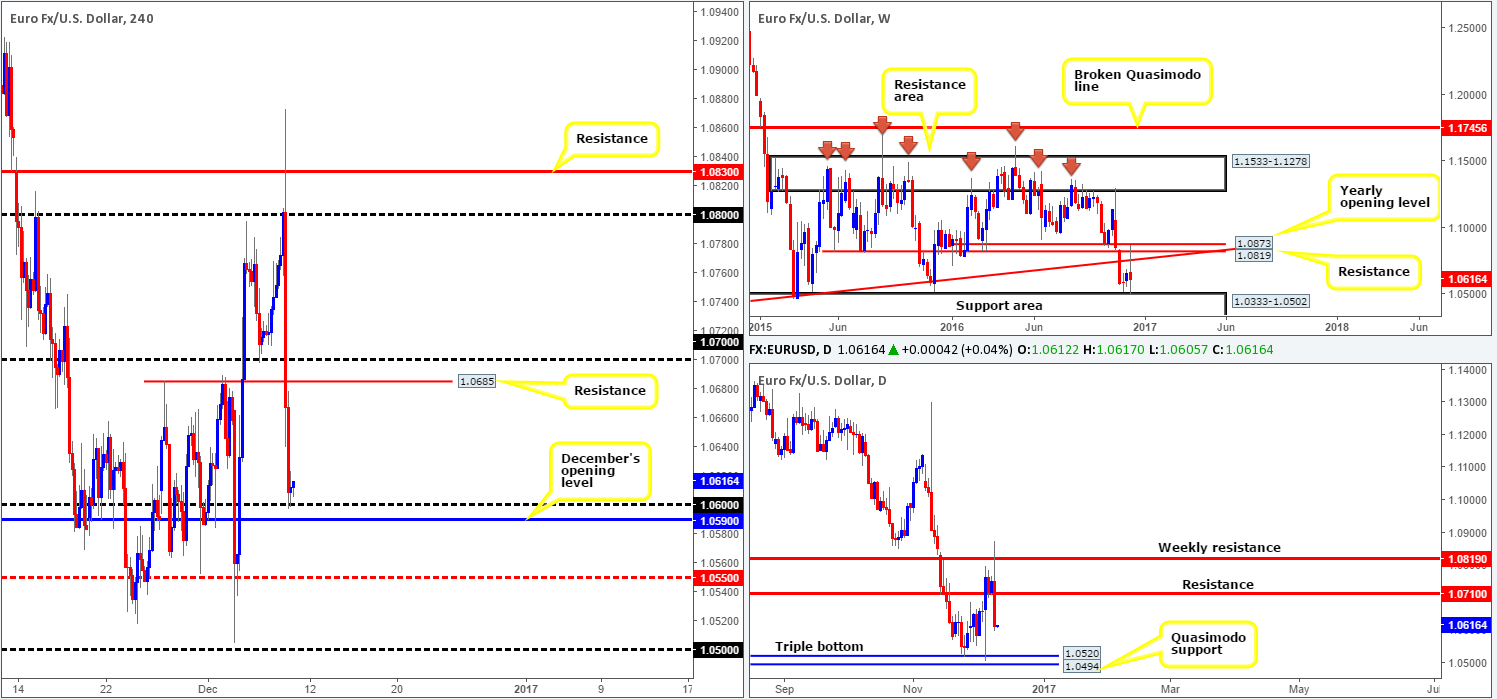
The EUR, as you can see, stamped in a rather savage-looking selling wick ahead of yesterday’s ECB press conference, surpassing both the 1.08 handle and a nearby H4 resistance at 1.0830, with the unit managing to clock highs of 1.0873. Following the ECB’s decision to taper the QE amount but extend the program, this sent the single currency screaming lower. Ripping through the 1.07 barrier and its nearby H4 support at 1.0685, the major ended the day shaking hands with the 1.06 handle.
Amid the increased volatility the pair hit the 2016 yearly opening level at 1.0873 (a to-the-pip reaction), before collapsing lower. This has now positioned weekly action within striking distance of a support area drawn from 1.0333-1.0502. Looking down to the daily candles, the next support target appears to be the triple-bottom formation at 1.0520, followed closely by a Quasimodo support carved from 1.0494.
Our suggestions: Considering that the1.06 barrier is bolstered by December’s opening level at 1.0590, there’s a chance that we may see a bullish rotation from this neighborhood today. Be that as it may, a long from this vicinity places one in an awkward spot, since there is little higher-timeframe structure reinforcing this area. In that the daily candle looks somewhat poised to extend lower today, we’ll humbly pass on longs from 1.06, but this is not to say a trade from here will not work out!
Should a H4 close be seen below both 1.06 and the December opening level, followed by a retest of this zone as resistance, we may, dependent on how the lower timeframe action behaves (see the top of this report for ideas on how to utilize lower-timeframe action), look to sell, targeting the H4 mid-way support at 1.0550, followed by the daily triple bottom at 1.0520 and then the 1.05 handle!
Data points to consider: University of Michigan consumer sentiment survey due for release at 3pm GMT.
Levels to watch/live orders:
- Buys: Flat (stop loss: N/A).
- Sells: Watch for a H4 close to form below the 1.0590/1.06 region and then look to trade any retest seen thereafter ([waiting for a lower timeframe confirmed signal following the retest is preferred] stop loss: dependent on where one confirms this area).
GBP/USD:
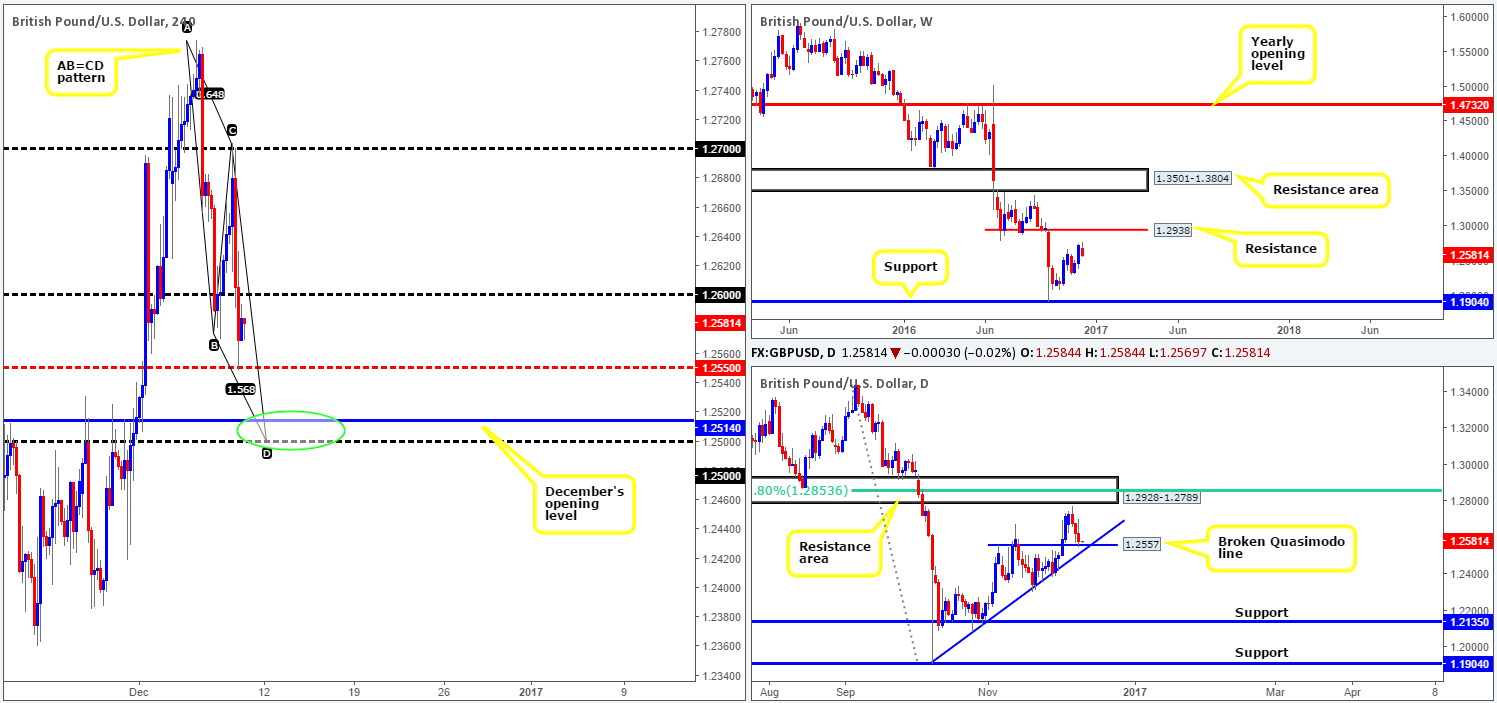
After price shook hands with the 1.27 handle during the early hours of yesterday’s London segment, a durable wave of offers swamped the market. Stimulated by the US dollar index gathering momentum, as well as the ECB announcing that it will be reducing the quantity of QE, but prolonging the program, cable wiped out the 1.26 level and touched gloves with the H4 mid-way support at 1.2550 by the day’s end.
With the above points in mind, here is our two pips’ worth on where price action may head today. Despite the recent decline in value, weekly price still, in our opinion, looks poised to extend north to resistance at 1.2938. The story on the daily chart, however, shows that the candles are now seen interacting with a broken Quasimodo support level at 1.2557 that is bolstered by a trendline support taken from the low 1.1904. This – coupled with H4 price currently in the process of forming a D-leg to a H4 AB=CD bull pattern that completes at 1.25, which happens to sit just below December’s opening level at 1.2514 (green circle), potentially advertises the 1.25 neighborhood as an area we may see the pair rotate from today.
Our suggestions: Although we’re confident that at least a bounce will likely be seen from the 1.25 zone, we would be wary of placing pending orders here. The reason is that, quite simply, psychological boundaries are prone to fakeouts! Therefore, waiting for a reasonably sized H4 bull candle to form prior to pulling the trigger is the route we shall take.
Data points to consider: UK Goods trade balance at 9.30am. University of Michigan consumer sentiment survey due for release at 3pm GMT.
Levels to watch/live orders:
- Buys: 1.25 region ([reasonably sized H4 bullish close required prior to pulling the trigger] stop loss: ideally beyond the trigger candle).
- Sells: Flat (stop loss: N/A).
AUD/USD:
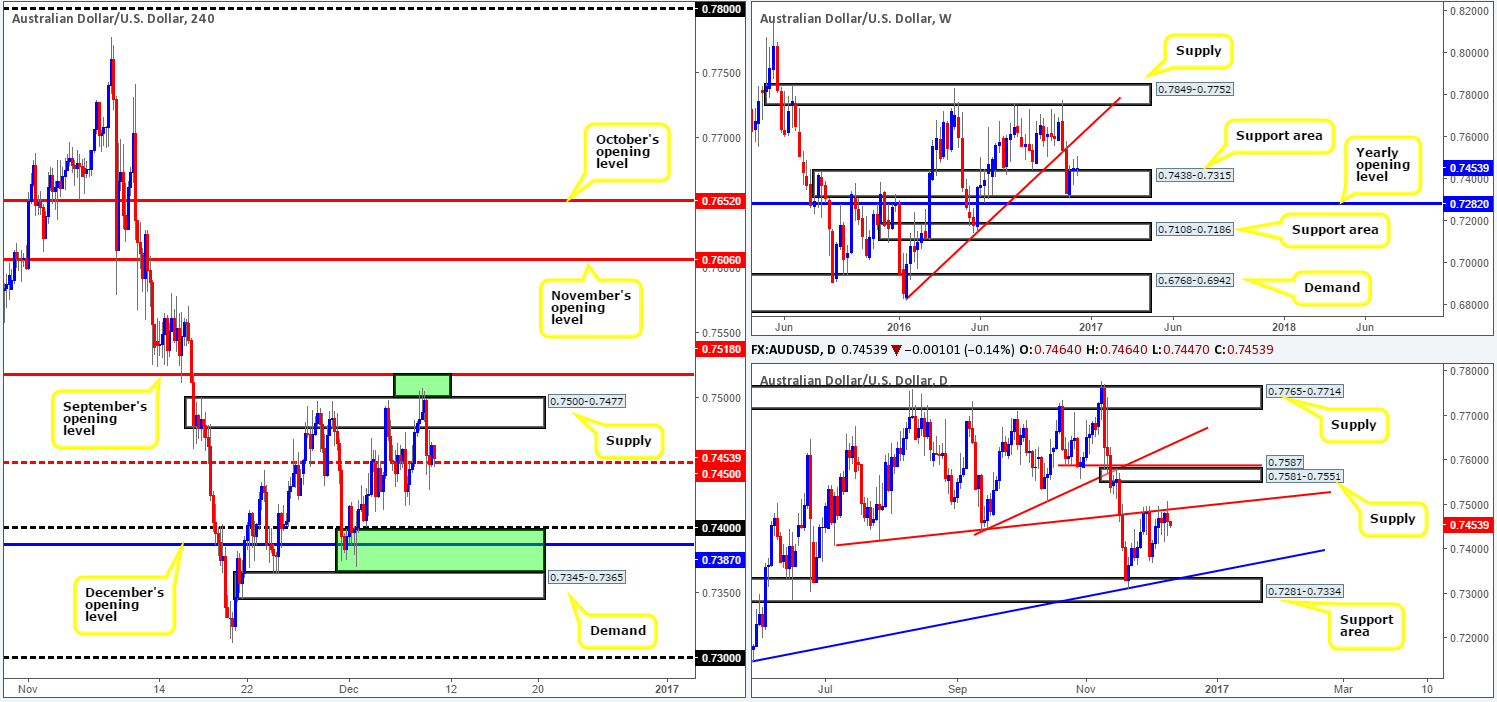
For those who read our previous report on the Aussie, you may recall that the team highlighted the 0.7518/0.75 region (upper green zone) as a fakeout area and a potential sell zone. Our reasoning simply stemmed from the amount of stops likely positioned above the H4 supply at 0.7500-0.7477, hence the expectation of a fakeout/stop run. Well done to any of our readers who managed to take advantage of the move seen from here!
Although the setup was technically sound, in our opinion, fundamentals clearly had their part to play here too. Disappointing Aussie and Chinese trade data, coupled with the recent ECB shenanigans, helped propel the market to lows of 0.7428 on the day.
As of now, our interest is more drawn to the buy zone seen between the top edge of the H4 demand at 0.7365 and the 0.74 boundary (lower green zone). Not only is there little active demand seen below the current H4 mid-way support at 0.7450 (therefore a close below 0.7450 will likely bring about a sharp bearish move lower), but the above noted buy zone also contains December’s opening level at 0.7387 and is positioned within a weekly support area seen at 0.7438-0.7315.
Our suggestions: Look to trade long from the aforementioned H4 buy zone. However, do so with caution, as let’s not forget that over on the daily chart, price is being held lower by a trendline resistance extended from the low 0.7407. Waiting for lower timeframe confirming action (see the top of this report) here is, according to our desk, the safer route to take. This will not only help in keeping you from taking an unnecessary loss, but also in avoiding a fakeout down into the nearby H4 demand at 0.7345-0.7365.
Data points to consider: Chinese CPI/PPI data at 1.30am. University of Michigan consumer sentiment survey due for release at 3pm GMT.
Levels to watch/live orders:
- Buys: 0.7365/0.74 ([waiting for a lower timeframe confirmed signal before pressing the buy button is preferred] stop loss: dependent on where one confirms this area).
- Sells: Flat (stop loss: N/A).
USD/JPY:
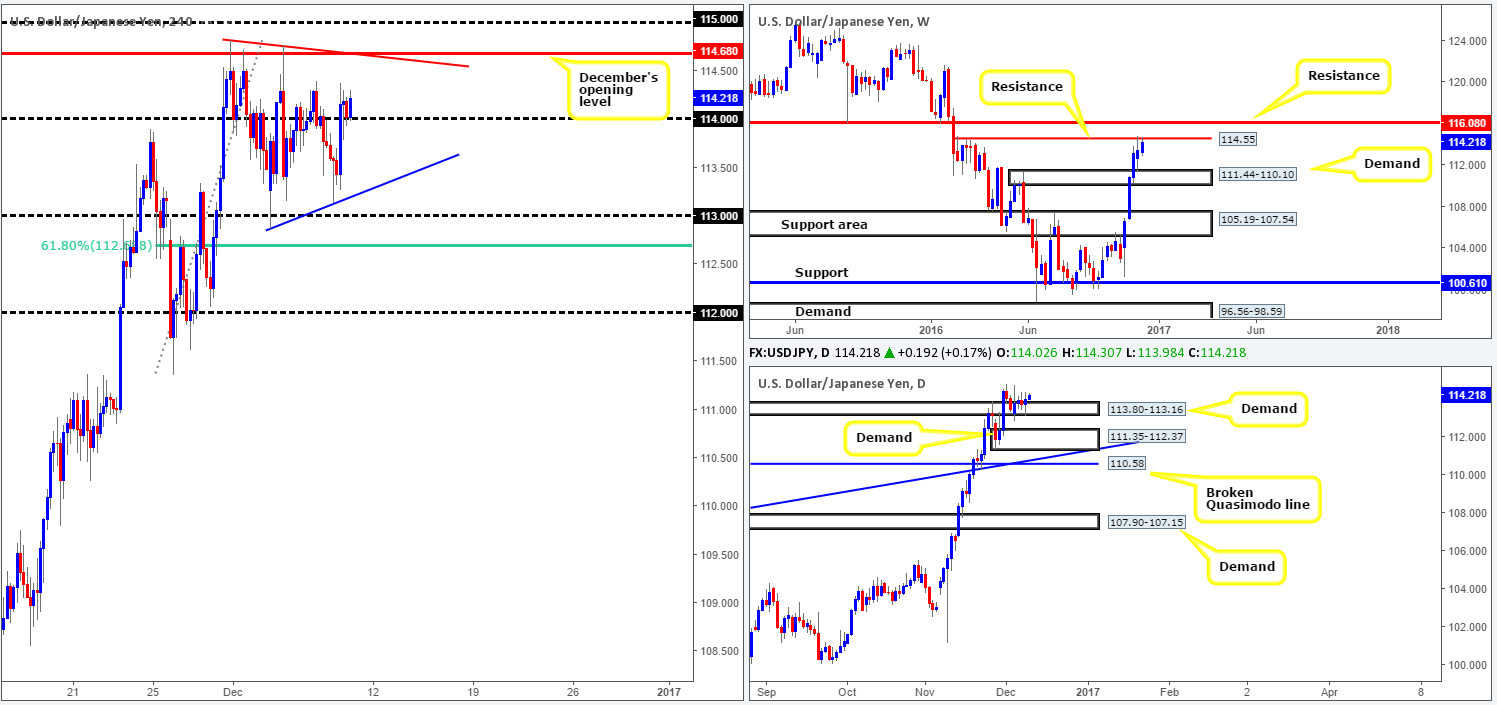
In view of current weekly action, the market is seen trading at a critical weekly juncture: a resistance level at 114.55. A rejection off this boundary could inspire further downside to demand formed at 111.44-110.10, whereas a break to the upside would likely place resistance at 116.08 in the limelight. Looking a little lower on the curve, daily demand at 113.80-113.16 continues to hold ground despite looking incredibly weak over the past few days. The next downside hurdle beyond this region can be seen at 111.35-112.37: a demand zone that is bolstered by a trendline support drawn from the low 105.54.
Stepping across to the H4 candlesticks, we can see that the pair benefitted from yesterday’s ECB announcement regarding tapering/QE extension. In fact, it was from here that we saw the unit close above the 114 handle, and subsequently open the pathway north to December’s opening level at 114.68 that fuses nicely with a H4 trendline resistance taken from the high 114.82.
Our suggestions: Put simply, we’re currently watching December’s opening level at 114.68 and the nearby psychological level above at 115 for shorts today. Granted, a trade from this area carries a reasonable amount of risk due to the current daily demand in play. What we’re banking on, however, is the weekly resistance at 114.55 holding firm. As long as a reasonable H4 bearish candle takes shape around 115/114.68, we believe this to be sufficient enough to sell, targeting 114 as an immediate take-profit target.
Data points to consider today: University of Michigan consumer sentiment survey due for release at 3pm GMT.
Levels to watch/live orders:
- Buys: Flat (stop loss: N/A).
- Sells: 115/114.68 region ([reasonably sized H4 bearish close required prior to pulling the trigger] stop loss: ideally beyond the trigger candle).
USD/CAD:
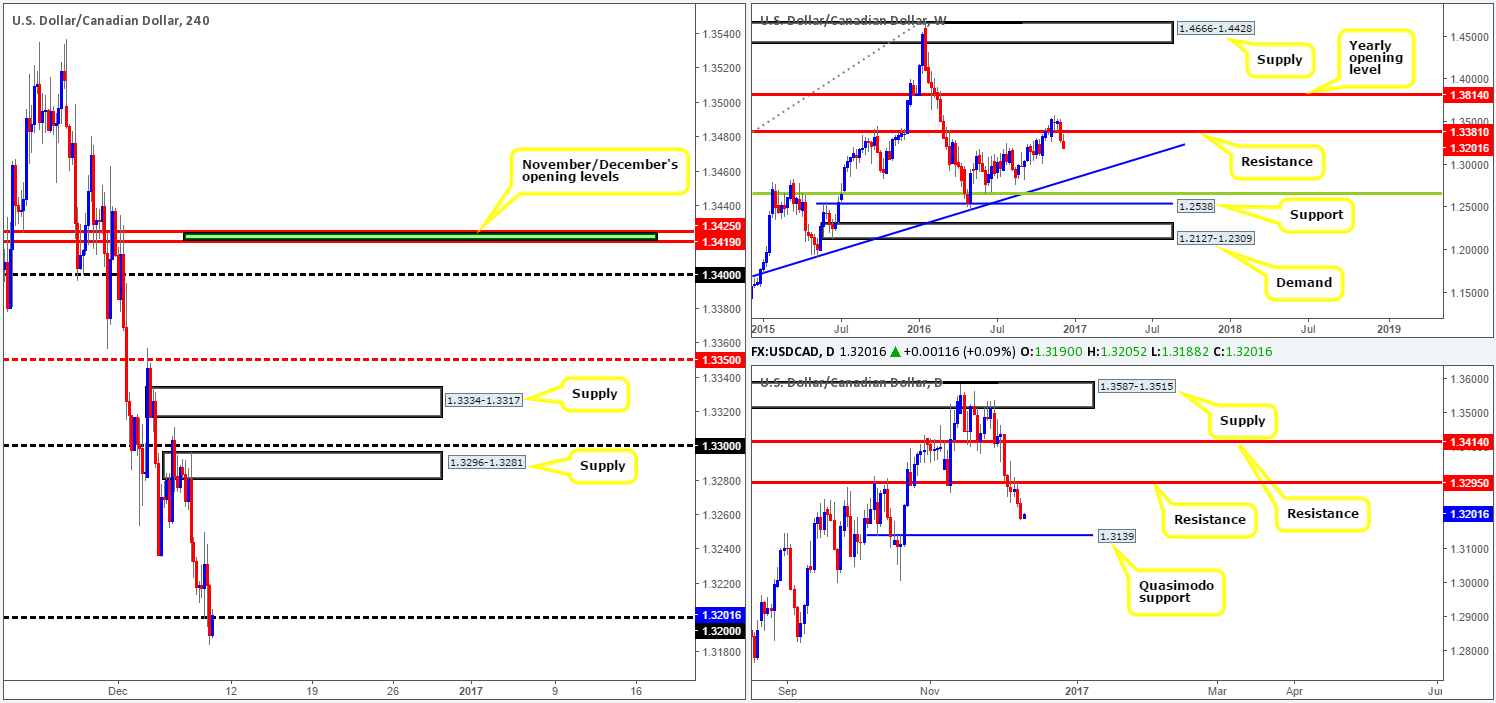
The rebound seen over in the oil market from H4 support at 49.80 helped set the tone for further downside in the USD/CAD pair yesterday, which, as you can see, eventually squeezed through bids at the 1.32 handle. In our previous report, the team stated that no short trades would be permitted until a H4 close has been seen below the 1.32 handle. Our reasoning lies within the higher timeframes.
Wednesday’s rebound from daily resistance at 1.3295, extended lower yesterday thus opens up the possibility for a drive down to the daily Quasimodo support at 1.3139. Meanwhile, up on the weekly chart, the next downside target from current resistance at 1.3381 can be seen much lower at a trendline support taken from the high 1.1278.
Our suggestions: Seeing as how the higher-timeframe picture is supportive of shorts at the moment, alongside the recent close below the 1.32 handle, our team is now watching for H4 price to form a bearish candle off the underside of 1.32 to sell. The first take-profit target can be seen around the H4 mid-way support at 1.3150, followed closely by the above noted daily Quasimodo support at 1.3139 and then October’s opening level at 1.3120.
Data points to consider today: University of Michigan consumer sentiment survey due for release at 3pm GMT.
Levels to watch/live orders:
- Buys: Flat (stop loss: N/A).
- Sells: 1.32 region ([reasonably sized H4 bearish close required prior to pulling the trigger] stop loss: ideally beyond the trigger candle).
USD/CHF:
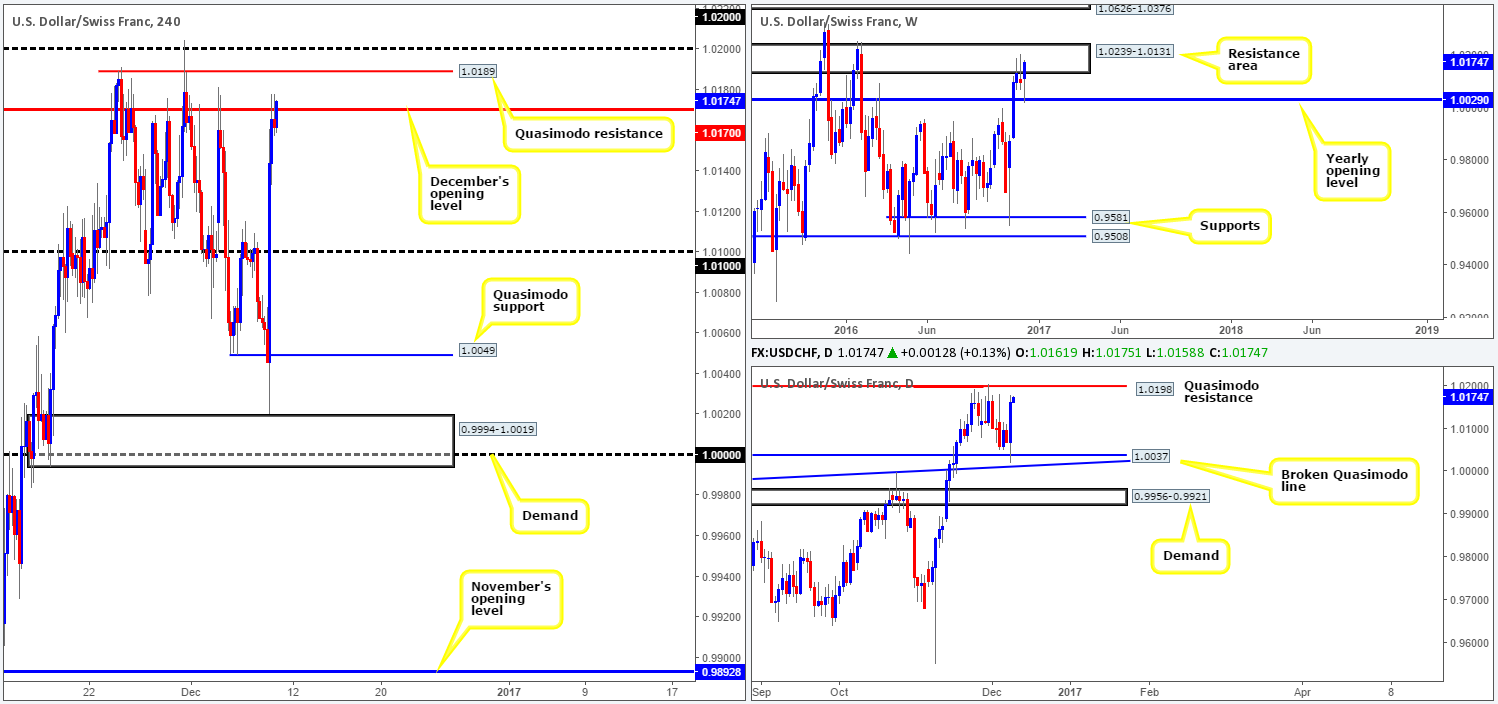
Thanks largely to the ECB’s recent announcement of tapering/QE extension, the USD/CHF came within an inch of linking with H4 demand at 0.9994-1.0019, before surging north. As a result, we can see that the buyers and sellers are currently battling for position around December’s opening level at 1.0170, which has held prices lower on two occasions since forming. Whether this barrier will hold the Swissy for a third consecutive time is difficult to judge. The reason for why is that daily price is trading within striking distance of a Quasimodo resistance level at 1.0198, thereby placing more emphasis on the H4 Quasimodo resistance at 1.0189 and the psychological handle at 1.02.
Our suggestions: Given the above factors, the aforementioned H4 Quasimodo resistance/1.02 handle is our prime focus today. Not only are both levels situated within the weekly resistance area at 1.0239-1.0131, but, as we have already mentioned, the barriers are also positioned nearby the daily Quasimodo resistance level at 1.0198. In light of this confluence, we feel a pending sell order can be placed at 1.0188 with a stop set above the apex of the H4 Quasimodo formation at 1.0206.
Data points to consider today: University of Michigan consumer sentiment survey due for release at 3pm GMT.
Levels to watch/live orders:
- Buys: Flat (stop loss: N/A).
- Sells: 1.0188 ([pending order] stop loss 1.0206).
DOW 30:
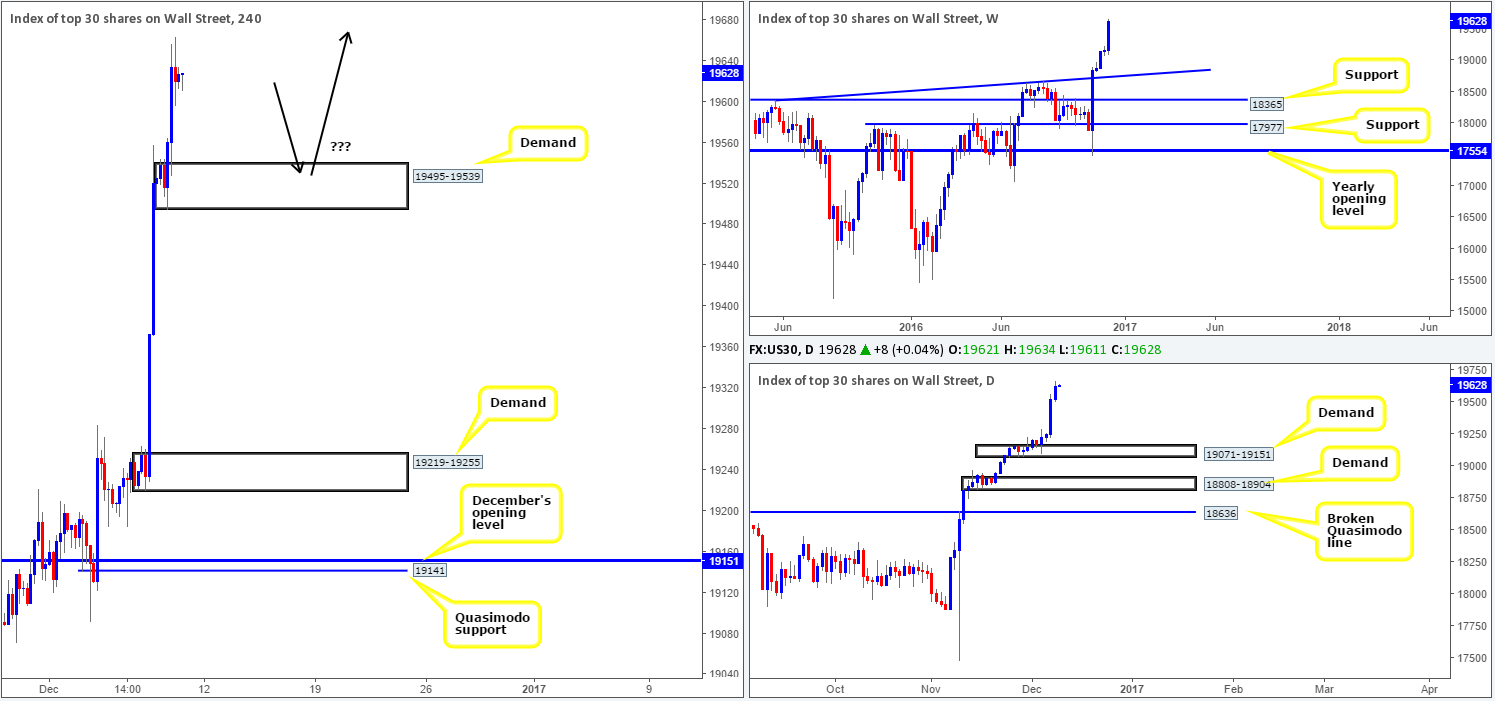
US equities closed higher for a fourth consecutive session yesterday, reaching record highs of 19664 on the day! The rally, as can be seen on the H4 chart, formed a nice-looking demand base coming in at 19495-19539. Of course, this H4 demand has no connection to higher-timeframe structure, but what it does do is give us a base to potentially work with upon further confirmation.
The closest barrier of support on the higher timeframes comes in at 19071-19151: a demand area. The top edge of this zone represents December’s opening level at 19151, while 10 points below (within the daily area) is a Quasimodo support seen at 19141.
Our suggestions: In that the H4 demand looks reasonably strong; our team has come to a general consensus that a long from here is possible with the backing of a reasonably sized H4 bull candle. A decisive push below this boundary on the other hand, could be an early cue to a move back down to H4 demand at 19219-19255.
Data points to consider today: University of Michigan consumer sentiment survey due for release at 3pm GMT.
Levels to watch/live orders:
- Buys: 19495-19539 ([reasonably sized H4 bullish close required prior to pulling the trigger] stop loss: ideally beyond the trigger candle).
- Sells: Flat (stop loss: N/A).
GOLD:
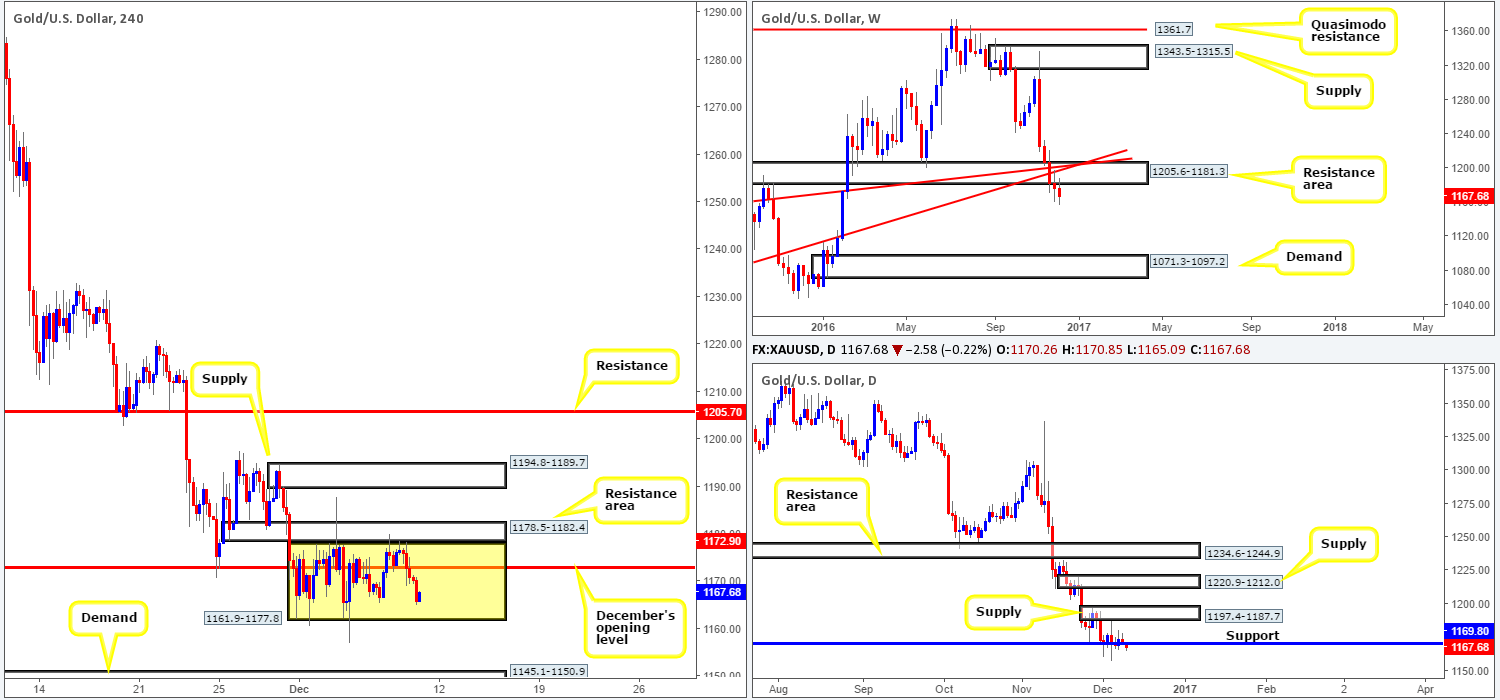
Despite the yellow metal selling off yesterday in reaction to an overall stronger dollar, the unit remains confined within the walls of a H4 consolidation fixed at 1161.9-1177.8. As was mentioned in previous writings, the top edge of this consolidation is bolstered by a H4 resistance area drawn from 1178.5-1182.4. A breakout south of this H4 range, nevertheless, likely clears the path south for price to test H4 demand at 1145.1-1150.9.
Now, considering that the weekly candles remain beneath the resistance area at 1205.6-1181.3, there’s a chance we may see a continuation move south from current price. However, to confirm bearish strength from the current weekly resistance area, a DECISIVE daily close below daily support at 1169.8 is needed. The close, in our estimation, would likely open up a void down to 1108.2-1117.8: a daily demand.
Our suggestions: Based on the above points, our team is looking for a H4 close to be seen beyond the current H4 range. Followed up with a retest to the underside of this area as resistance along with a reasonably sized H4 bearish candle, would be sufficient enough for our team to sell, targeting the H4 demand at 1145.1-1150.9 as a first take-profit zone.
Levels to watch/live orders:
- Buys: Flat (stop loss: N/A).
- Sells: Watch for a H4 close to form below the current H4 consolidation zone at 1161.9-1177.8 and then look to trade any retest seen thereafter ([H4 bearish candle close required following the retest] stop loss: ideally beyond the trigger candle).


