
EUR/USD:
Ranging little more than 50 pips on Thursday, EUR/USD prices are effectively unchanged this morning. Thursday’s US ADP non-farm employment miss boosted demand for the single currency, though the move was short-lived. The US ISM Non-Manufacturing PMI, however, came in better than expected, sending the EUR/USD lower, though, once again, the move was fleeting.
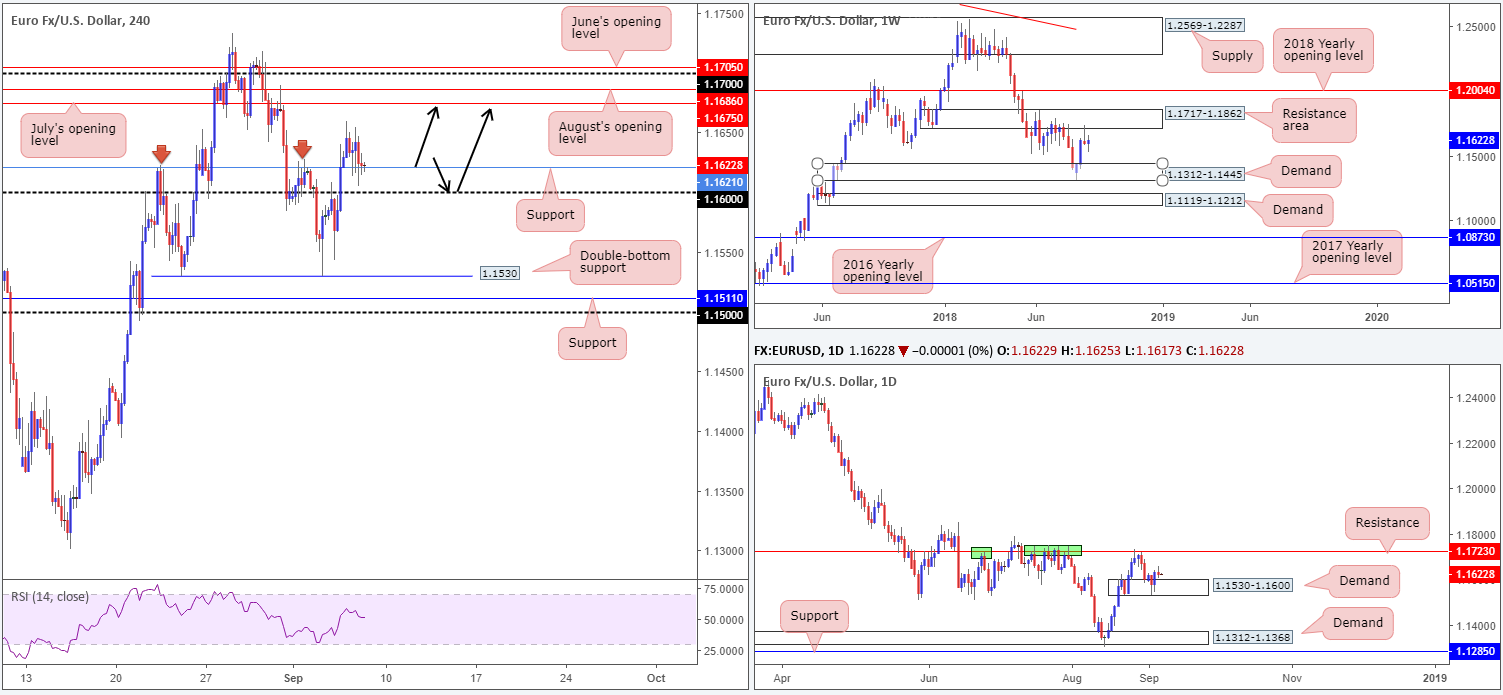
The H4 candles, as you can see from the chart, is seen testing support at 1.1621. From this neighborhood, the runway north appears free to challenge July’s opening level at 1.1675, followed closely by August’s opening level at 1.1686, the 1.17 handle and then June’s opening level at 1.1705. Further adding to this, the RSI is trading above its center line, emphasizing a strong market at the moment.
On wider perspective, aside from yesterday’s daily indecision candle, the structure remains pretty much unchanged. Daily activity continues to hover above demand coming in at 1.1530-1.1600, poised to potentially challenge 1.1723: a key resistance. In terms of where we stand on the weekly timeframe, current activity shows the unit meandering between a resistance area at 1.1717-1.1862 (holds the noted daily resistance level within its lower limits) and a demand zone penciled in at 1.1312-1.1445.
Areas of consideration:
Based on the above reading, a potential retest play still may be in the offing from either the H4 support at 1.1621 or the 1.16 handle (see black arrows). Aggressive traders will likely enter at market with stops tucked a few pips beneath their chosen support, whereas conservative traders may opt to enter on a bullish candlestick formation, be it on the H4 scale or on a lower timeframe (this is trader dependent).
The initial upside target from either support stands at July’s opening level mentioned above at 1.1675, and has an ultimate target at 1.1723: the current daily resistance. By that time: 1.1723, active selling is expected to materialize since the unit will also be touching gloves with a weekly resistance zone at 1.1717-1.1862.
Traders are reminded that we might be in for more sideways action this morning ahead of today’s US non-farm payrolls. Analysts forecast 191k non-farm payrolls will be added to the US economy in August, though wage growth is seen unchanged at 2.7% y/y.
Today’s data points: US non-farm payrolls; US average hourly earnings; US unemployment rate.
GBP/USD:
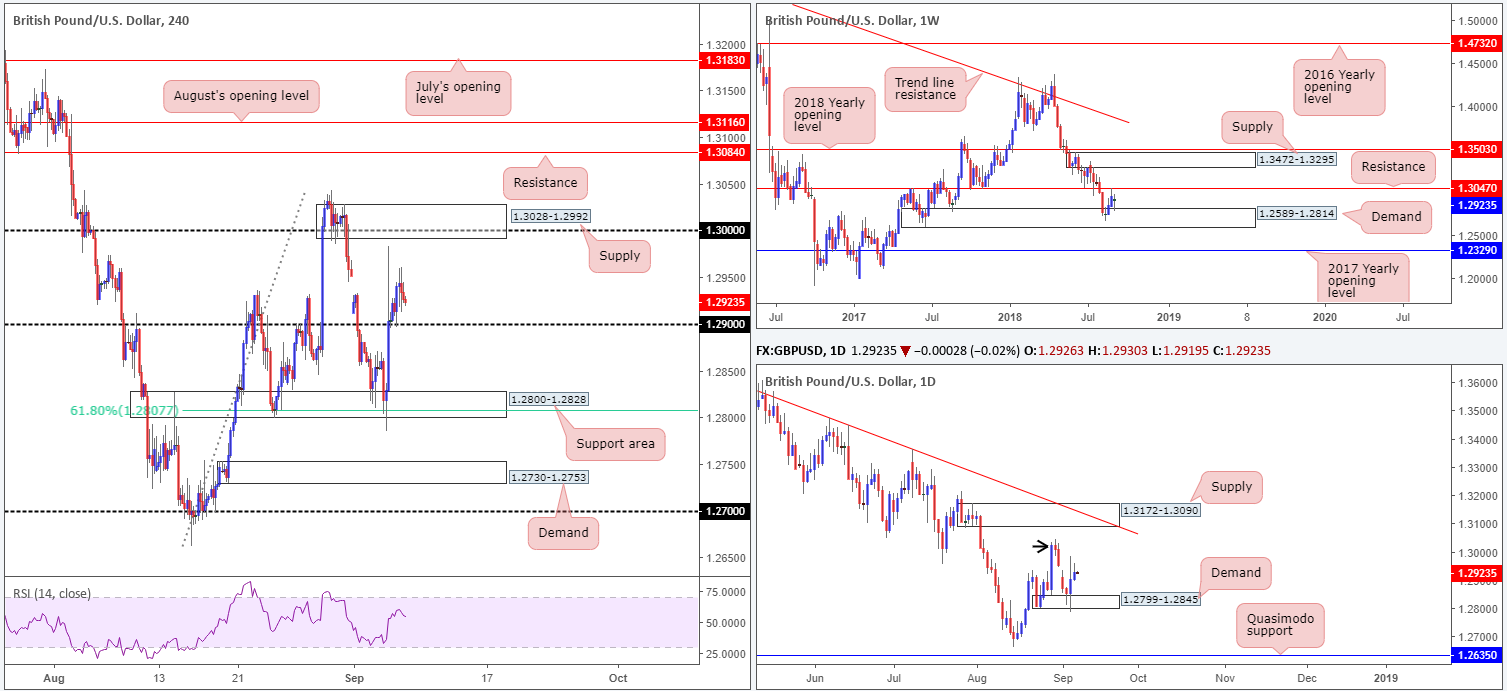
Sterling managed to maintain 1.29+ status on Thursday, despite Germany downplaying claims it may be more flexible on Brexit bill conditions. Reaching highs of 1.2961, the H4 candles now appear poised to challenge the key figure 1.30, which happens to be encased within a notable supply zone coming in at 1.3028-1.2992.
Higher-timeframe flow on the weekly chart continues to emphasize an indecisive tone at the moment, loitering between resistance at 1.3047 and demand drawn from 1.2589-1.2814. Daily price, on the other hand, remains buoyant above demand at 1.2799-1.2845 (glued to the top edge of the current weekly demand). While we expect sellers to be interested in the August 30 high at 1.3042 (black arrow), the ultimate upside objective on this scale falls in around a supply zone at 1.3172-1.3090 that converges with a trend line resistance (etched from the high 1.3472).
Areas of consideration:
Intraday (we’re referring to the H4 here) shines its spotlight on the key figure 1.30 today, given it converges with a strong H4 supply at 1.3028-1.2992. This area also happens to line up closely with the August 30 high at 1.3042 highlighted on the daily timeframe. As a result, it could be worth keeping an eyeball on 1.30 for possible shorting opportunities should price challenge this number. Technically speaking, stop-loss orders are best placed above the H4 supply zone, since the expectation is for 1.30 to hold ground and force the unit lower.
There are no macroeconomic events scheduled in the UK today, though we do have the mighty NFP report making an appearance later on.
Today’s data points: US non-farm payrolls; US average hourly earnings; US unemployment rate.
AUD/USD:
Despite a busy round of data out of Australia this week, the AUD/USD remains capped around the underside of the 0.72 handle as we head into US Non-Farm Payrolls to end the week. Thursday’s Australian trade balance posted a larger-than-expected surplus of $1,551M, though failed to generate enough force to break the 0.72 mark.
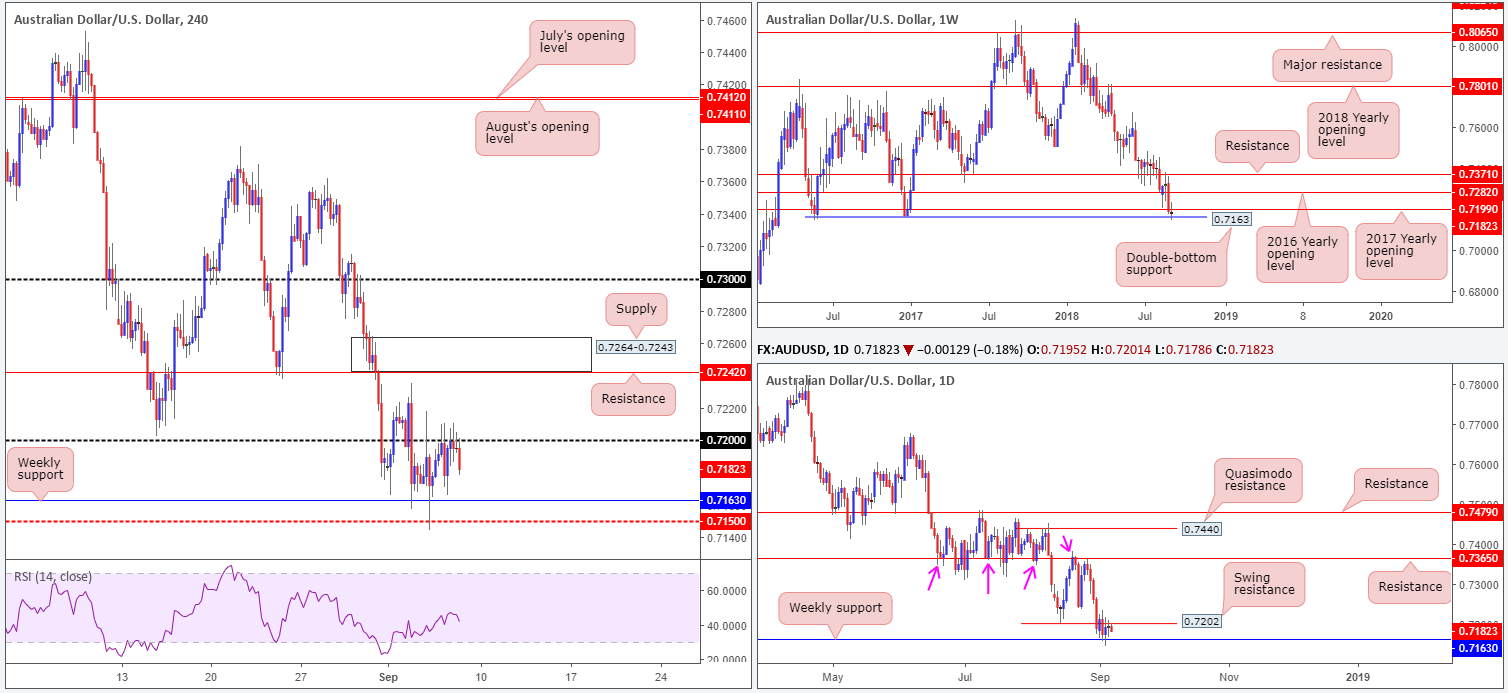
The weekly double-bottom support at 0.7163, as you can see, continues to provide this market a floor to trade from. This is quite a level considering we have interested sellers from the 0.72 handle on the H4 timeframe, which happens to be bolstered by the 2017 yearly opening level on the weekly timeframe at 0.7199, and also a clear swing resistance on the daily timeframe at 0.7202.
Areas of consideration:
According to our technical reading, the AUD/USD pendulum could still potentially swing either way!
To our way of seeing things, though, the sellers may have the upper hand here, despite an earnest attempt seen to hold the current weekly double-bottom support. Not only are we entrenched within a dominant downtrend at the moment, we know there are a number of key factors supporting the sellers right now.
Although the case for selling is strong, waiting for the weekly double-bottom support to be taken out before pulling the trigger would be the safer approach here we feel – long term that is.
For traders who managed to short off 0.72 (a noted level for sells in Thursday’s report), well done! Price action, as we write, is seen heading towards the weekly double-bottom support at 0.7163: the only clear downside target from here right now. A break beyond here and we’re almost immediately facing potential support from the H4 mid-level barrier at 0.7150.
Today’s data points: US non-farm payrolls; US average hourly earnings; US unemployment rate.
USD/JPY:
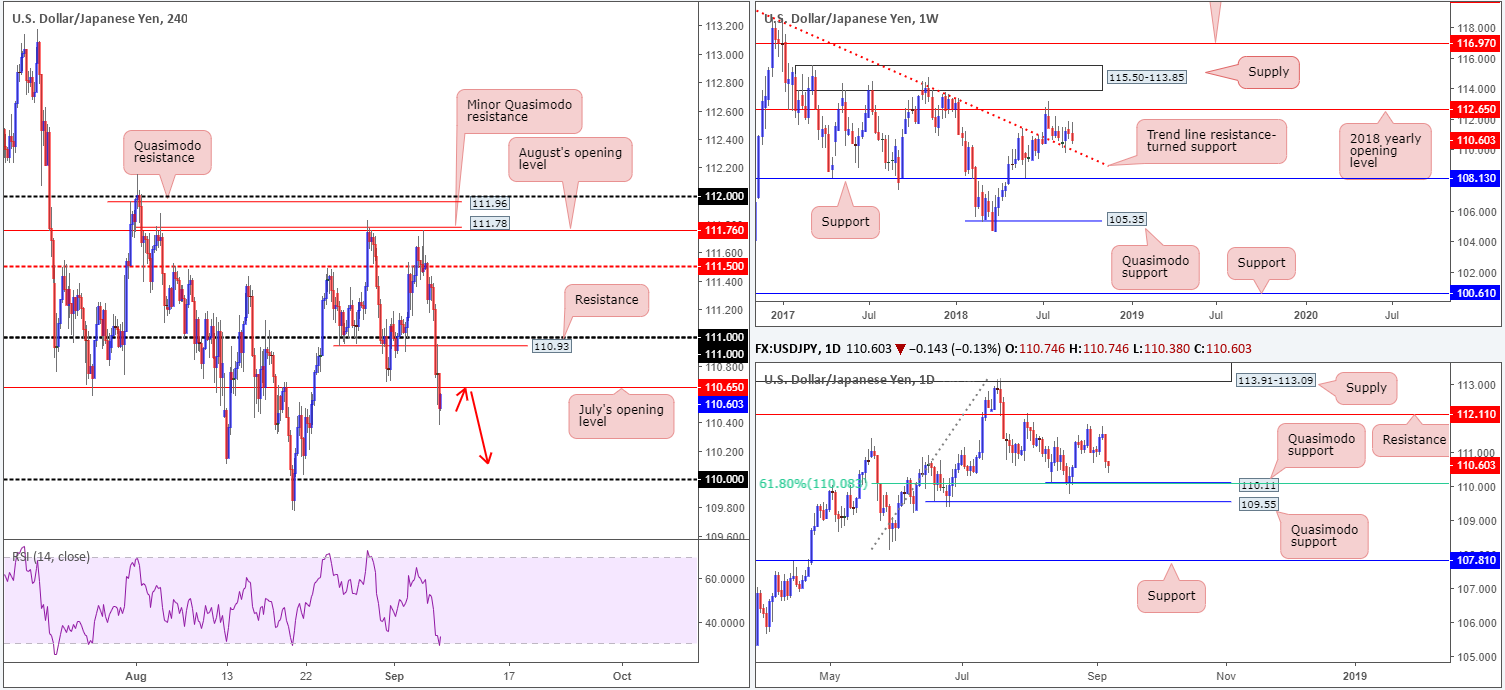
The USD/JPY took to lower ground on Thursday, nudging to a fresh September low of 110.70, as sentiment took a turn for the worse. Trade war angst and tariff woes have clearly taken the wind out of the traders’ sails! In recent hours, it’s also worth noting further selling has been observed, taking out July’s opening level on the H4 timeframe at 110.65 and potentially setting the stage for further downside towards the 110 region.
Before we reach 110, however, daily price has printed a support 11 pips north of this number in the form of a Quasimodo support, bolstered by another layer of support in the shape of a 61.8% Fib at 110.08. Also in our sights now is the weekly trend line resistance-turned support (extended from the high 123.57).
Areas of consideration:
With July’s opening level at 110.65 out of the way, there is a clear bearish tone present in this market this morning, at least until we shake hands with the aforementioned daily Quasimodo support. In view of this, a retest to the underside 110.65 has ‘sell me’ written all over it. While aggressive traders will likely attempt to fade this number with stops positioned a few pips above the line, conservative traders are urged to wait for additional bearish confirmation: a bearish candlestick formation, before pulling the trigger. This not only helps display seller intent, it also provides traders direction as to where to position stops.
Today’s data points: US non-farm payrolls; US average hourly earnings; US unemployment rate.
USD/CAD:
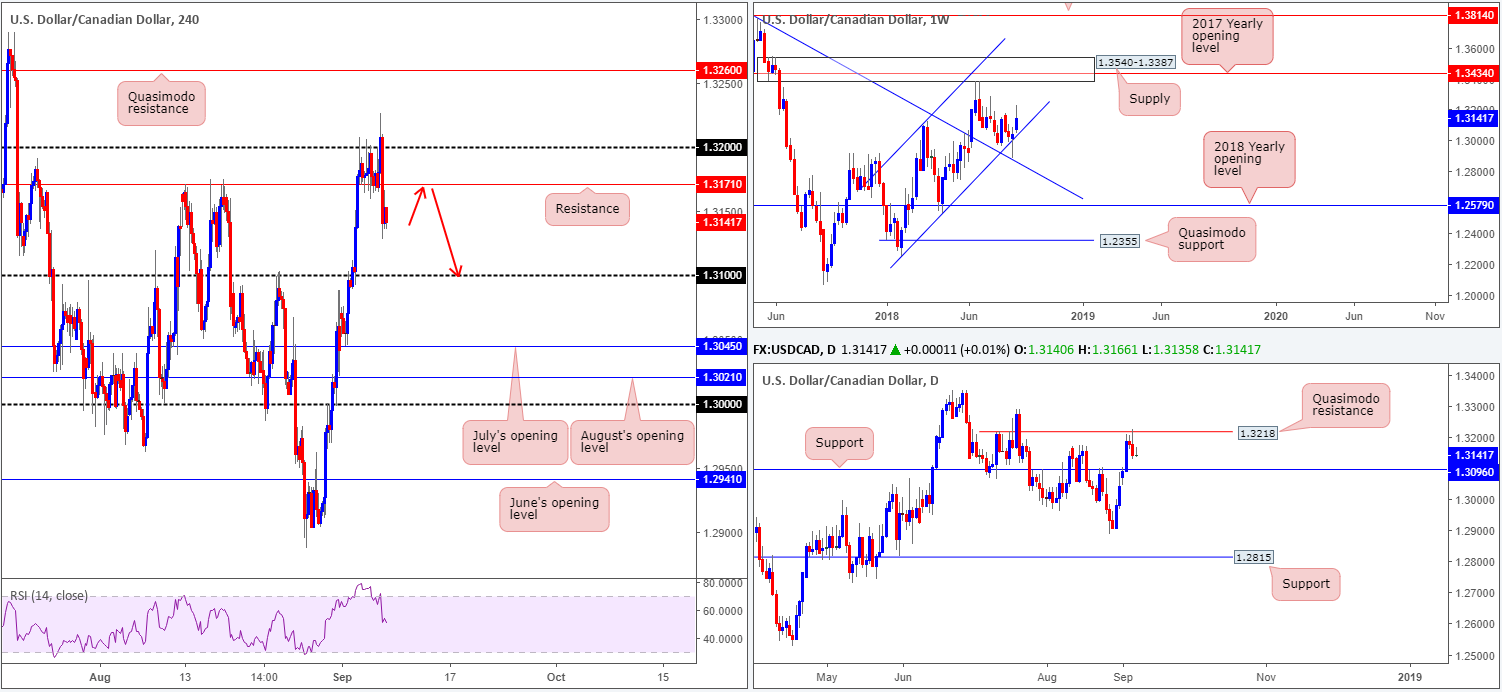
Off 6-week highs, the USD/CAD fell sharply in a matter of minutes on Thursday, following comments from the Bank of Canada’s Senior Deputy Governor Carolyn Wilkins. The move firmly placed the H4 candles beneath support at 1.3171 (now acting resistance), and, according to the H4 scale, possibly cleared the pathway south towards the 1.31 handle.
From a technical perspective, however, the daily Quasimodo resistance at 1.3218 was also recently brought into the mix. The next downside target from here falls in around the support level fixed at 1.3096. On the other side of the spectrum, though, weekly price remains in positive territory after respecting its channel support (extended from the low 1.2247).
Areas of consideration:
In the event H4 price retests the underside of 1.3171 today and chalks up a bearish candlestick formation (be it on the H4 timeframe or lower), selling this market down to 1.31 could be an option (see red arrows). Constant monitoring is recommended, however, given where the market is trading from on the weekly timeframe.
Today’s data points: US non-farm payrolls; US average hourly earnings; US unemployment rate; Canadian job’s data; CAD Ivey PMI.
USD/CHF:
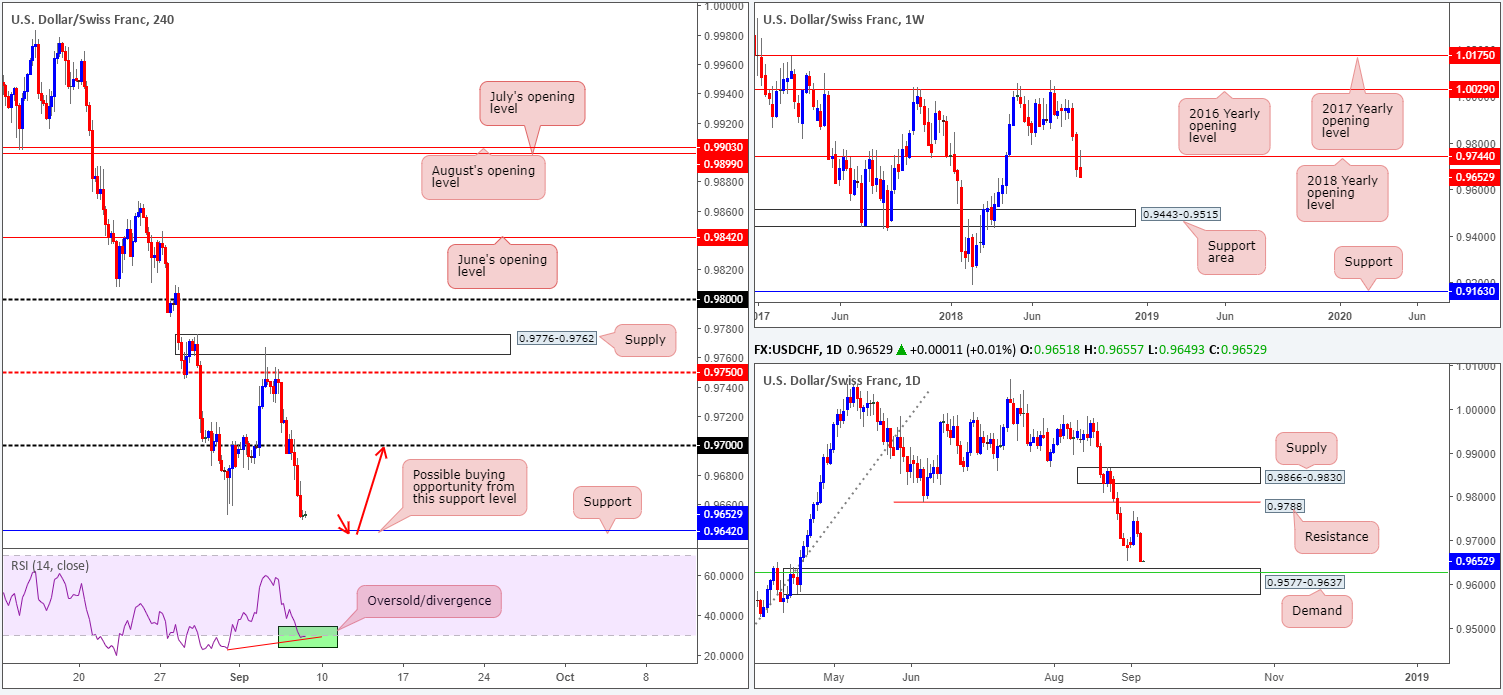
Kicking this market off from the top this morning, weekly activity is seen firmly selling off from the underside of the 2018 yearly opening level at 0.9744. With limited support on this scale until reaching the 0.9443-0.9515 area, further downside could be in store!
Focusing the spotlight on the daily timeframe for a minute, the pair took out the August 31 low 0.9652 on Thursday in the shape of a full-bodied bearish candle. Despite this, however, demand at 0.9577-0.9637 is now lurking within striking distance (fuses with a 50.0% support value at 0.9627 [green line]).
In conjunction with the daily timeframe, H4 price is seen nearing a notable support level coming in at 0.9642 (positioned directly above the current daily demand). It may also be of interest to some traders to note the RSI indicator is currently displaying an oversold/divergence reading.
Areas of consideration:
Technically speaking, although weekly action portends further selling, shorting into a strong-looking daily demand and a H4 support level is not a setup that echoes high probability. In fact, it is highly likely we’ll observe a response from 0.9637/0.9642, as traders may look to cover short positions ahead of today’s non-farm payrolls report. As a result of this, should traders witness a strong bullish candlestick formation emerge from this area, this could be a good opportunity to consider buying this market, targeting the underside of 0.97.
Today’s data points: US non-farm payrolls; US average hourly earnings; US unemployment rate.
Dow Jones Industrial Average:
Once again, the DJIA sported a reasonably lackluster performance on Thursday. In consequence to this, much of the following report will echo thoughts put forward in yesterday’s analysis…
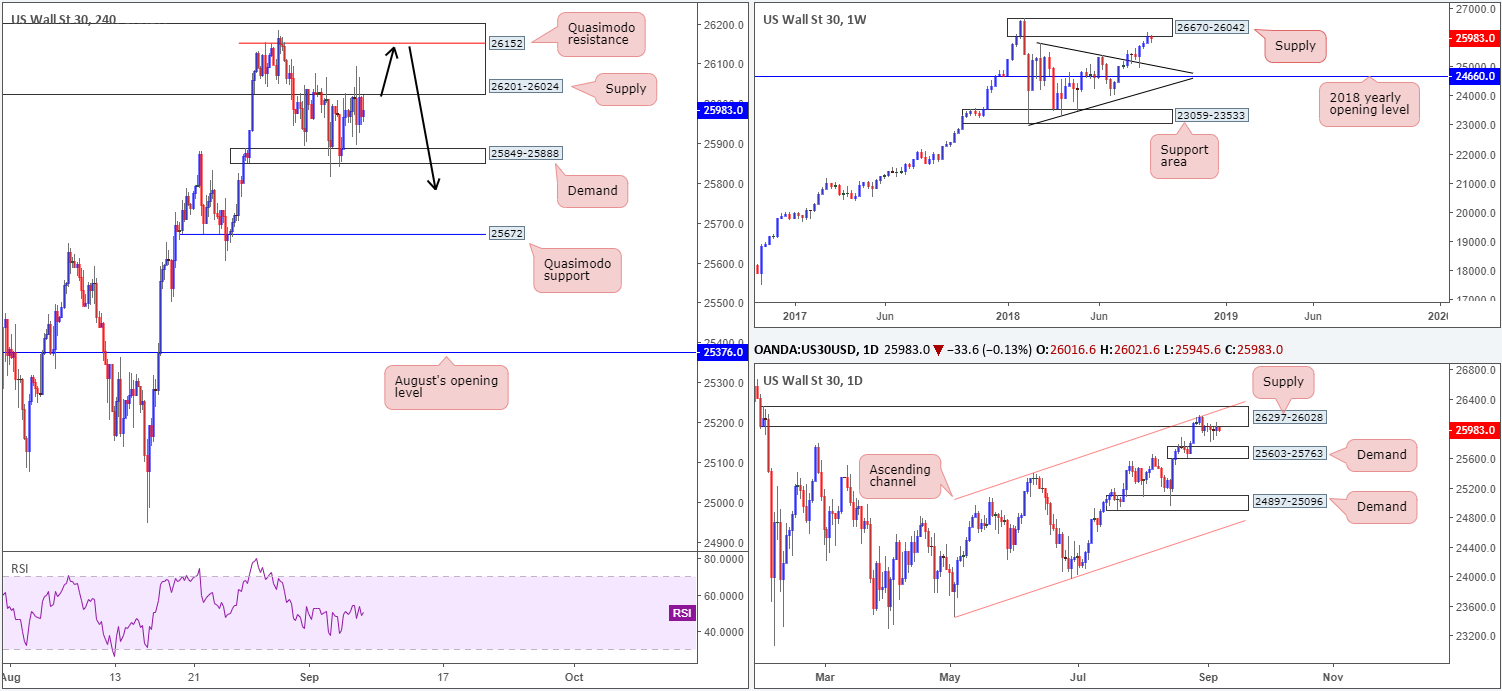
H4 price continues to loiter between a rather large supply area at 26201-26024 and a demand base coming in at 25849-25888. Also worth noting is the current H4 demand was taken out on Tuesday, potentially clearing the path south towards the H4 Quasimodo support level at 25672.
Meanwhile, higher up on the curve, the bigger picture remains pretty much unchanged. Although the index registered its third consecutive weekly gain last week, traders may have noticed price recently engaged with the lower edge of a weekly supply at 26670-26042, following a strong retest off a weekly trend line resistance-turned support (etched from the high 25807) a few weeks back.
In terms of the daily timeframe, strong supply at 26297-26028 remains in the fold. What gives this area credibility comes down to the following:
- Downside momentum drawn from the base is incredibly strong.
- The zone intersects with a daily channel resistance (taken from the high 25399).
- Glued to the underside of the aforesaid weekly supply area.
Areas of consideration:
As the current H4 supply at 26201-26024 is enormous, entering short from the H4 Quasimodo resistance level seen within the upper limits of the area at 26152 could be something to consider (see black arrows). This gives traders the option of positioning stops above the overall H4 supply (while keeping risk/reward in check), targeting the H4 demand area mentioned above at 25849-25888 as the initial take-profit zone, followed then by the top edge of daily demand at 25603-25763 (next downside target on the daily scale) and then the aforementioned H4 Quasimodo support level.
Today’s data points: US non-farm payrolls; US average hourly earnings; US unemployment rate.
XAU/USD (Gold):
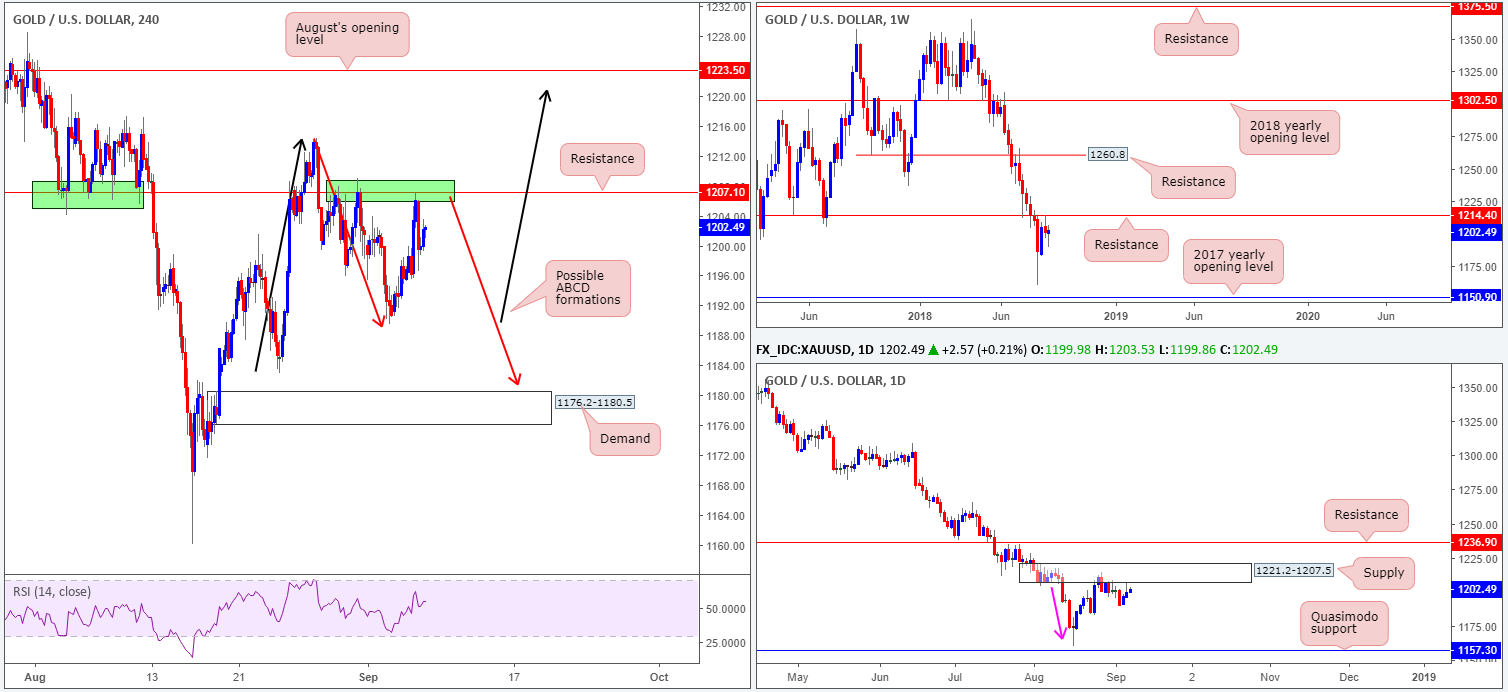
During the course of yesterday’s sessions, the yellow metal shook hands with the underside of a notable H4 resistance level at 1207.1 and turned lower. Supporting this barrier is a strong daily supply area at 1221.2-1207.5, along with the fact weekly price remains capped beneath resistance at 1214.4.
On the H4 scale, there are two possible ABCD scenarios on the radar. Further selling from the current resistance level would likely see a bullish ABCD complete (red arrows) just north of a demand base coming in at 1176.2-1180.5, whereas a move above the current resistance could witness bullion attempt to approach August’s opening level at 1223.5 in the shape of a bearish ABCD formation (black arrows).
Areas of consideration:
Ultimately, knowing both weekly and daily price display strong resistances in play at the moment, the chances of the bullish ABCD completing is higher, in our humble view. With that being the case, shorting from the current H4 resistance level could be something to consider today.
Although 1207.1 is a strong barrier, traders may want to think about waiting for additional candlestick confirmation before pulling the trigger. A nice-looking H4 bearish pin-bar formation, or an engulfing setup would be ideal, as not only will this show seller intent, it’ll provide traders a position to fix their stop-loss orders.
The use of the site is agreement that the site is for informational and educational purposes only and does not constitute advice in any form in the furtherance of any trade or trading decisions.
The accuracy, completeness and timeliness of the information contained on this site cannot be guaranteed. IC Markets does not warranty, guarantee or make any representations, or assume any liability with regard to financial results based on the use of the information in the site.
News, views, opinions, recommendations and other information obtained from sources outside of www.icmarkets.com.au, used in this site are believed to be reliable, but we cannot guarantee their accuracy or completeness. All such information is subject to change at any time without notice. IC Markets assumes no responsibility for the content of any linked site. The fact that such links may exist does not indicate approval or endorsement of any material contained on any linked site.
IC Markets is not liable for any harm caused by the transmission, through accessing the services or information on this site, of a computer virus, or other computer code or programming device that might be used to access, delete, damage, disable, disrupt or otherwise impede in any manner, the operation of the site or of any user’s software, hardware, data or property.


