
A note on lower timeframe confirming price action…
Waiting for lower timeframe confirmation is our main tool to confirm strength within higher timeframe zones, and has really been the key to our trading success. It takes a little time to understand the subtle nuances, however, as each trade is never the same, but once you master the rhythm so to speak, you will be saved from countless unnecessary losing trades. The following is a list of what we look for:
- A break/retest of supply or demand dependent on which way you’re trading.
- A trendline break/retest.
- Buying/selling tails/wicks – essentially we look for a cluster of very obvious spikes off of lower timeframe support and resistance levels within the higher timeframe zone.
- Candlestick patterns. We tend to only stick with pin bars and engulfing bars as these have proven to be the most effective.
We search for lower timeframe confirmation between the M15 and H1 timeframes, since most of our higher-timeframe areas begin with the H4. Stops are usually placed 5-10 pips beyond confirming structures.
EUR/USD:
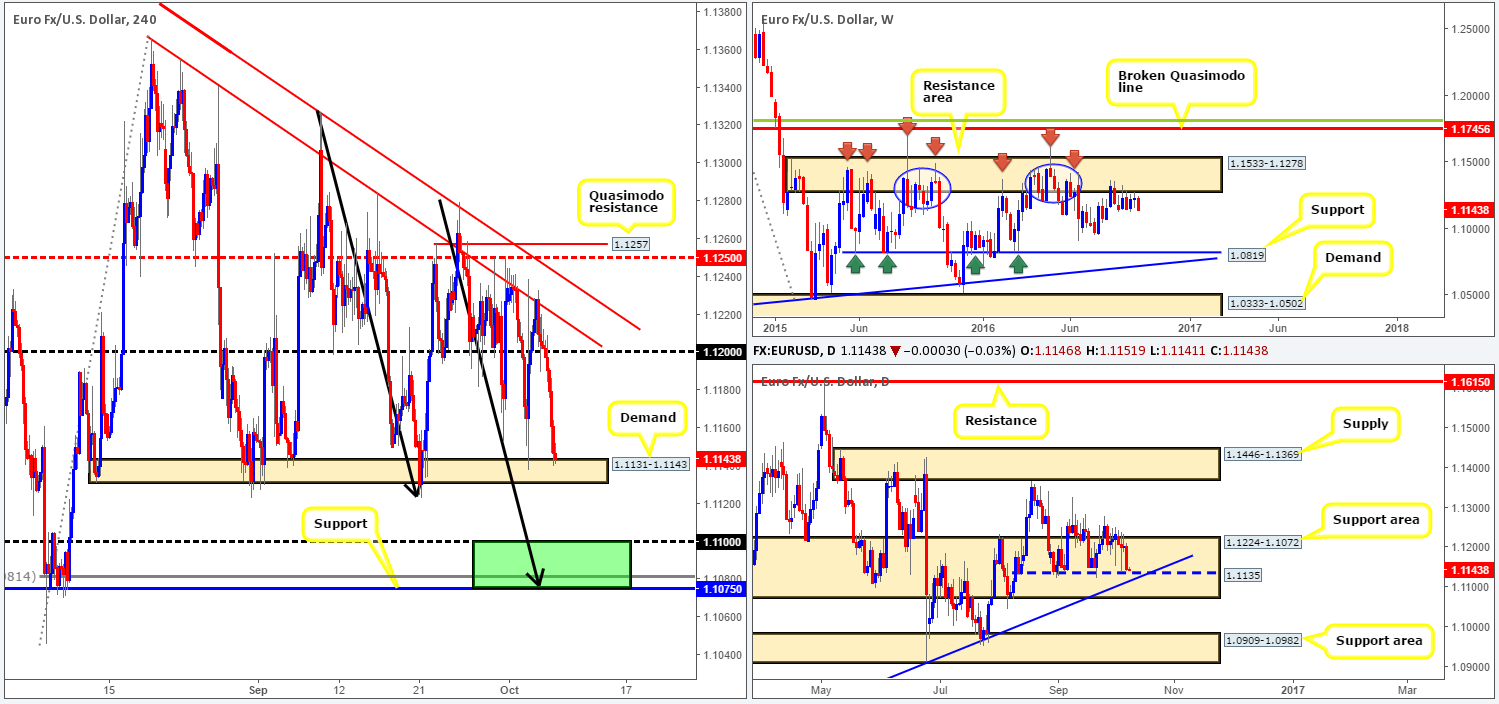
The EUR/USD experienced quite a significant selloff during the course of yesterday’s sessions, as dollar bulls aggressively pushed to highs of 96.77 on the day. Shrugging off better than expected US jobless claims data, the shared currency, as you can see, fell sharply down to a H4 demand barrier coming in at 1.1131-1.1143. What this also did was drive the daily candles deeper into the current support area at 1.1224-1.1072, and closed the day out just ahead of a rather prominent support penciled in at 1.1135 (bolstered by a trendline support taken from the low 1.0516).
While this could be a logical area for price to bounce from, one mustn’t forget where price is currently trading from in the bigger picture: a weekly resistance area at 1.1533-1.1278. Therefore, although the current daily support has held prices higher on a number of occasions recently (albeit unable to print new highs) this is still considered a rather risky place to buy in our view.
Our suggestions: Given the technical picture and the fact that we have the influential US employment report hitting the wire later on today at 12.30pm GMT, our team will not be buying from the current H4 demand zone. In fact, we’re actually looking for the H4 candles to close beyond this barrier today, as this could, depending on whether or not price retests the underside of this area as supply, allow us to sell down to the 1.1075/1.11 region (green zone). As we mentioned in previous reports, 1.1075/1.11 is not only a good take-profit area for any shorts in this market, it’s also a fantastic location to look for longs. It sits within the depths of the aforementioned daily support area, as well as converging with a deep H4 88.6% Fib support at 1.1081 and also a H4 AB=CD bull pattern completion point (taken from the high 1.1327 [black arrows]). While this H4 buy zone will very likely bounce price, do keep in mind that by entering long from here you’re effectively buying into weekly flow. As a result, waiting for at least a H4 bullish close to form prior to pulling the trigger may be the better path to take.
In addition to NFP data, traders may also want to note that we have a number of key FOMC officials taking the stage at different intervals between 2.30pm-8.00pm GMT today. This, along with NFP, is bound to cause a stir in the financial markets so remain vigilant during these times!
Levels to watch/live orders:
- Buys: 1.1075/1.11 ([H4 bullish close required] Stop loss: beyond the trigger candle).
- Sells: Watch for price to consume the H4 demand at 1.1131-1.1143 and then look to trade any retest seen to the underside of this barrier (H4 bearish candle is required before pulling the trigger).
GBP/USD:
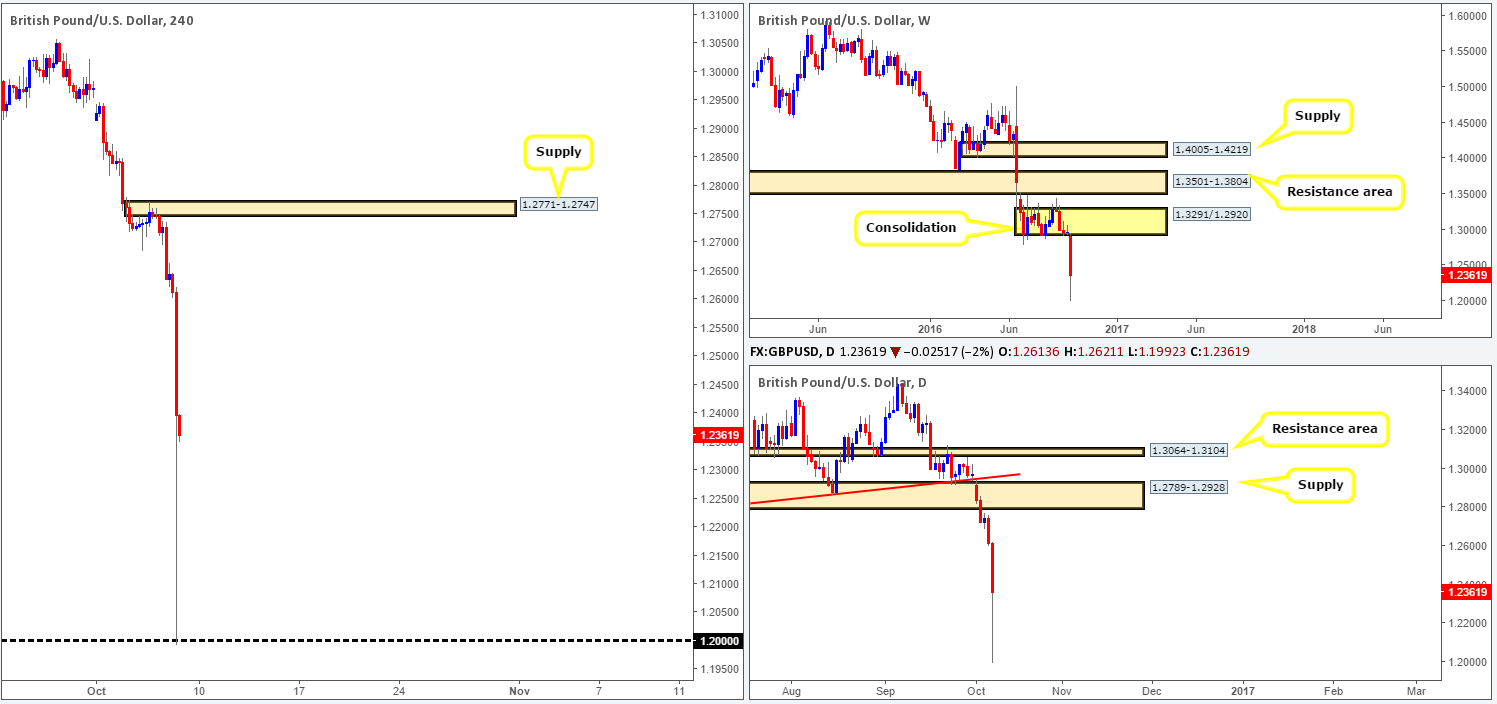
Well, isn’t the GBP/USD chart a sight for sore eyes this morning – no doubt this made a lot of eyebrows go up! The pair dropped over 600 pips within three minutes! We are under the impression that this ‘flash crash’ was caused by comments made by the French president Francois Hollande that the EU need to make an example out of Britain.
Technically it has caused a mess on the charts. Trading this market today, along with UK factory production data at 8.30am and the mighty NFP report set to take the stage at 12.30pm GMT, may just be asking for trouble in our opinion. Therefore, we’re going to remain on the sidelines today and analyze the market’s reaction to such an aggressive round of selling.
Levels to watch/live orders:
- Buys: Flat (Stop loss: N/A).
- Sells: Flat (Stop loss: N/A).
AUD/USD:
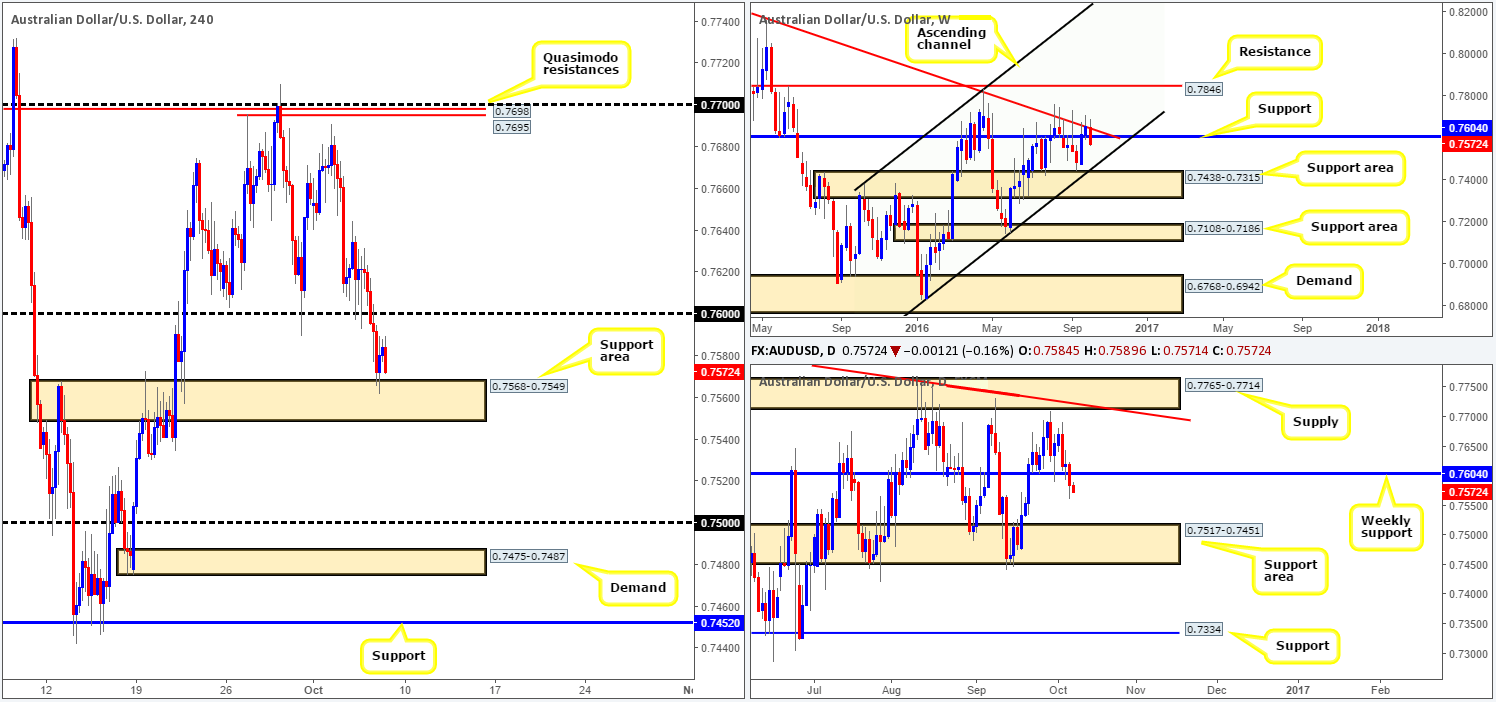
Kicking this morning’s report off with a quick look at the weekly chart shows that the Aussie dollar is currently seen trading below support drawn from 0.7604, following a selloff from the trendline resistance extended from the high 0.8295. According to daily structure, this could spark further selling down to a support area registered at 0.7517-0.7451. However, as we anticipated, a break of 0.76 seen over on the H4 chart forced the candles down to a support zone coming in at 0.7568-0.7549, which is currently holding firm. This area is significant, in our opinion, as it was used to propel the commodity currency beyond the weekly resistance 0.7604 back on the 21st September.
Our suggestions: For our team to become sellers in this market, we require a H4 close beyond the current H4 support area, followed up by a retest and a H4 bearish candle. Should this come to fruition, the next objective on the hit list is likely the 0.75 handle, which is lodged within the aforementioned daily support area. Event risks for this setup, however, include the mighty US NFP report scheduled for release at 12.30pm, as well as the group of key FOMC members taking the spotlight at different intervals between 2.30pm-8.00pm GMT. Volatility will likely be high during these times as traders attempt to hunt for any subtle clues regarding interest-rate policy.
Levels to watch/live orders:
- Buys: Flat (Stop loss: N/A).
- Sells: Watch for a close below the H4 support area at 0.7568-0.7549 and then look to trade any retest seen thereafter (H4 bearish candle is required before pulling the trigger).
USD/JPY:
(Trade update: Suffered a loss as we attempted to short from the H4 supply at 103.80-103.62).
The USD/JPY continued to trade with a strong bias to the upside yesterday, managing to clock fresh highs at 104.15. As you can see, H4 supply at 103.80-103.62 was taken out (now acting demand), leaving price free to challenge a H4 Quasimodo resistance level drawn from 103.99, which is currently holding ground. On top of this, we can see that daily price pierced through a resistance area seen at 103.50-103.89. The next upside target beyond this region can be seen at 105.60-105.25: a supply zone.
With weekly movement now seen trading nearby weekly highs chalked up on the 29/08 around the 104.32ish range, and daily candles holding steady around a resistance area, there’s a chance we may see this pair pullback today. However, shorting this pair on the H4 chart is difficult! Not only is there demand at 103.80-103.62, which is currently in play, we also have a demand base positioned directly below here at 103.34-103.51, followed closely by the 103 handle that is also bolstered by another demand logged in at 102.65-102.89. Given this minefield, our team has come to a general consensus that opting to stand on the sidelines today may very well be the better path to take.

Levels to watch/live orders:
- Buys: Flat (Stop loss: N/A).
- Sells: Flat (Stop loss: N/A).
USD/CAD:
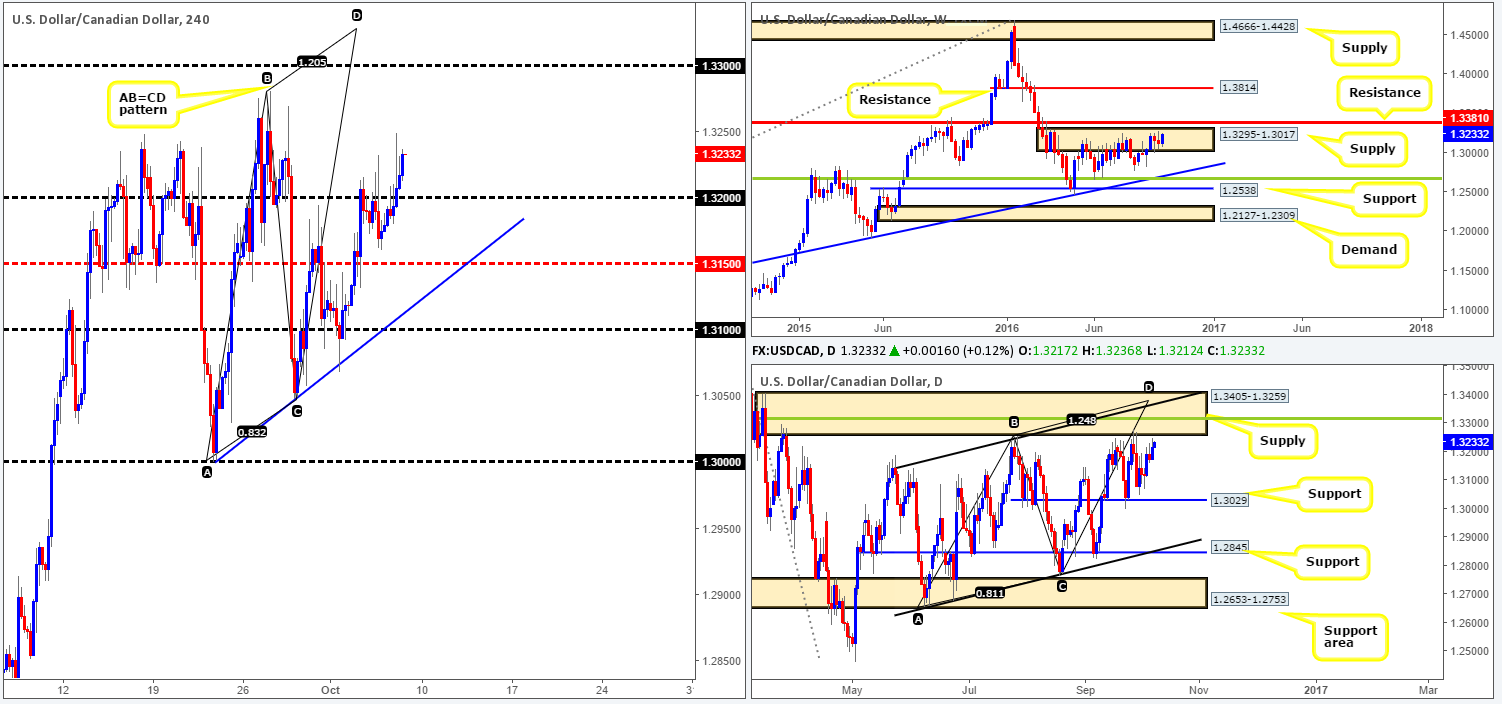
After enduring and finally conquering the 1.32 handle yesterday, the pair managed to strike highs of 1.3248 on the day. As far as we’re concerned now, all eyes are likely on the 1.33 region. Looking to buy from current prices, however, is not something that interests our team. This is due to weekly price loitering within the upper edge of a supply zone coming in at 1.3295-1.3017, and also daily action seen trading just ahead of a supply registered at 1.3405-1.3259. Also worthy of consideration here (something we’ve been banging the drum about for a while now) is the daily convergence point located within this barrier: a 38.2% Fib resistance level at 1.3315 (green line), the weekly resistance level at 1.3381, a channel resistance taken from the high 1.3241 and an AB=CD completion point around the 1.3376ish range.
Our suggestions: As we highlighted in yesterday’s report, we remain focused on shorting around 1.3315ish region. Not only does this area boast a truckload of daily/weekly confluence (see above) and a H4 AB=CD bearish completion point (1.3328), it also allows one to place their stops above the current daily supply! Initially, we did have a pending sell order set at 1.3315 and a stop placed above at 1.3407, but given both US and Canadian labor data is set to hit the wire at 12.30pm GMT today, our team has removed these orders. This is not to say that we will not short from here, it is more a precautionary measure as getting caught on the wrong side of trade flows during market-moving events such as the NFP, will rarely do any good to one’s account!
Levels to watch/live orders
- Buys: Flat (Stop loss: N/A).
- Sells: Keep an eye on the 1.3315ish region today (Stop loss: 1.3407). We would not advise trading this area 30 minutes pre/post NFP today.
USD/CHF:
A disappointing Swiss CPI reading along with strong US jobless claims data helped push the USD/CHF higher yesterday, eventually crossing swords with a H4 resistance level coming in at 0.9817. Moving over to the daily chart, you’ll see that current price action also connected with a trendline resistance extended from the high 1.0256.
In light of the confluence seen around the H4 resistance level, technically we feel this will be a difficult barrier for the bulls to overcome today. However, given that today’s news hosts the influential US non-farm payrolls report, this barrier could be taken out and price could rally up to the H4 Quasimodo resistance carved in at 0.9863.
Our suggestions: Seeing as we are predominantly technical traders here, we are looking to short the current H4 resistance today. Assuming a reasonably sized H4 bearish candle takes shape here, we’ll short with our stop placed above the trigger candle, targeting Wednesday’s low 0.9733, followed closely by a H4 support area seen at 0.9706-0.9721.
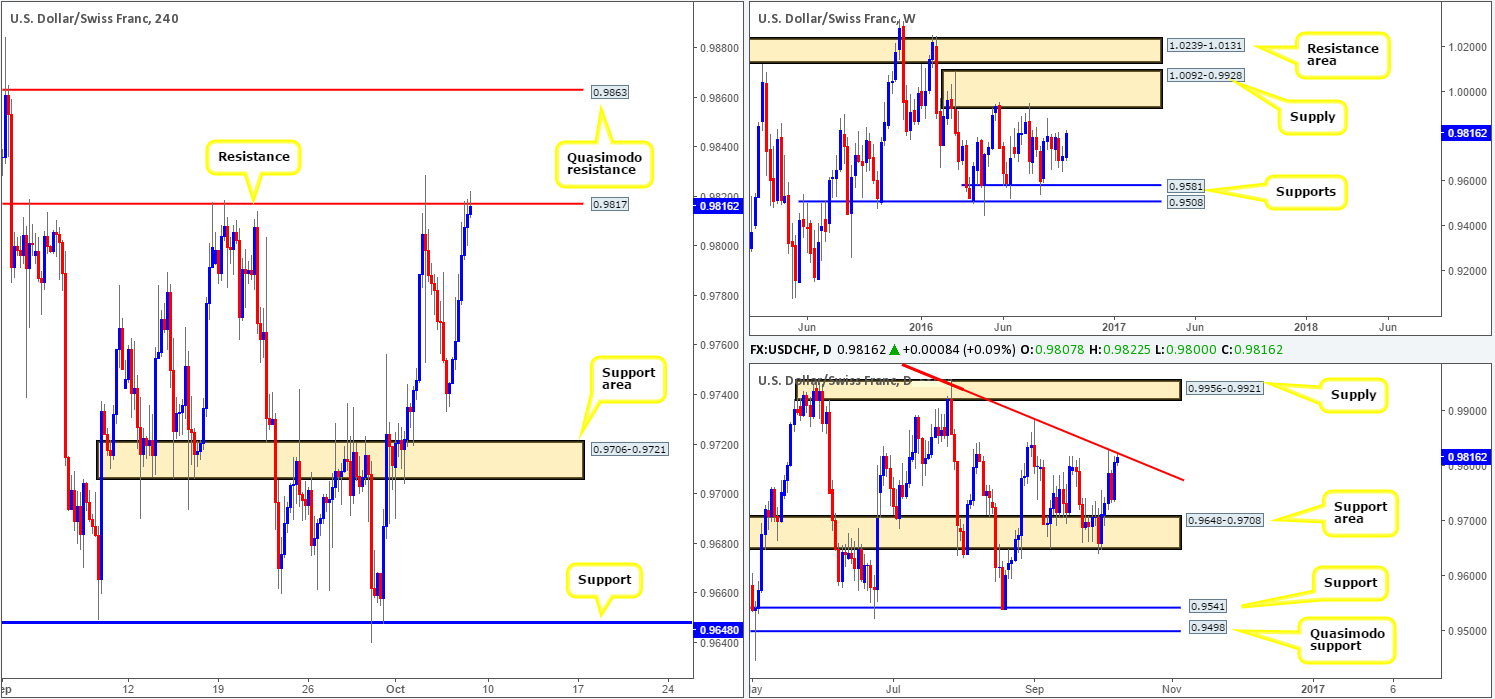
Levels to watch/live orders:
- Buys: Flat (Stop loss: N/A).
- Sells: 0.9817 ([H4 bearish candle required] Stop loss: beyond the trigger candle).
DOW 30:
Working our way from the top this morning, we can clearly see that the DOW is currently capped by a resistance barrier coming in at 18365 and a support level drawn from 17977. By the same token, the daily chart also shows price action is in a rather cramped situation, as the buyers and sellers battle for position between resistance at 18322 and a trendline support taken from the low 15501.
Stepping across to the H4 chart, the candles are seen compressing between two converging trendlines (17959/18450). Despite this, we would not feel comfortable risking capital trading either line right now, especially with the US employment report right around the corner.
Our suggestions: The only area that really takes our fancy at the moment is the H4 Quasimodo support level at 18023 for buys. The line sits just above a daily broken Quasimodo hurdle at 18018 and is also positioned nearby the current weekly support level. In light of the upcoming labor data, however, we will not be placing pending orders around this region. Instead, we’ll simply wait for price to connect with our buy level and assess the strength of lower timeframe price action (see the top of this report for lower timeframe entry techniques), before looking to commit.
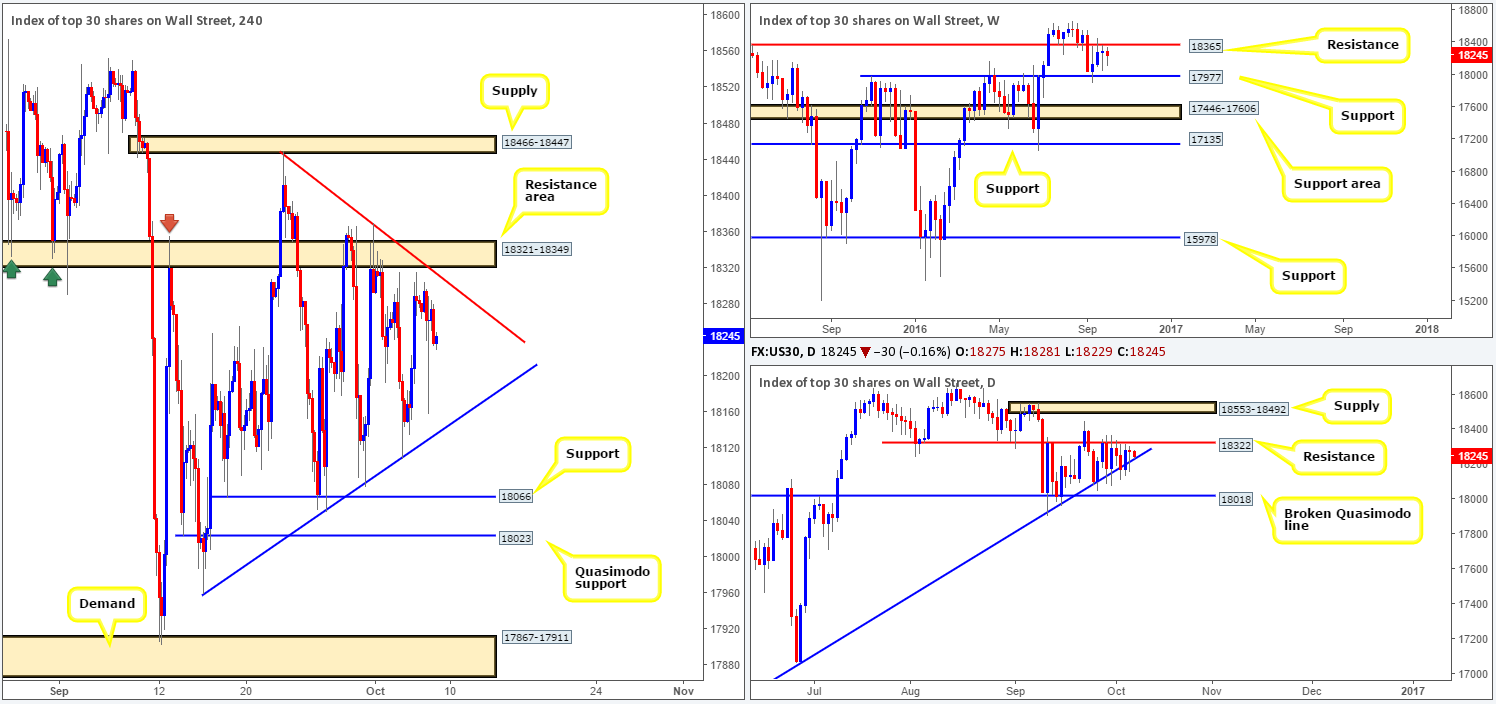
Levels to watch/live orders:
- Buys: 18023 region ([lower timeframe confirmation required] Stop loss: dependent on where one confirms this area).
- Sells: Flat (Stop loss: N/A).
GOLD:
Across the board, we saw the dollar intensify its advance yesterday, consequently pushing the yellow metal into further losses. The H4 Quasimodo support level at 1257.4 was taken out with little to no fight seen from the bulls, leaving price free to clock fresh lows of 1249.7 on the day.
The break through the weekly support area at 1307.4-1280.0 looks incredibly intimidating, and could encourage further selling in this market all the way down to demand chalked up at 1205.6-1181.2 in the near future. Conversely, however, daily price remains firm deep within demand drawn from 1250.1-1265.0 for the time being.
Our suggestions: With the US employment report scheduled for release at 12.30pm GMT today, this will likely affect the price of the precious metal. From a technical standpoint, nonetheless, we feel as long as the sellers are able to defend the underside of the recently broken H4 Quasimodo support, the metal will look to attack lower prices today and close the week out below the current daily demand area. As such, should our team manage to pin down a lower timeframe sell signal (see the top of this report) off the back of 1257.4 today, we’ll short, in the hope that weekly sellers continue to push gold lower.
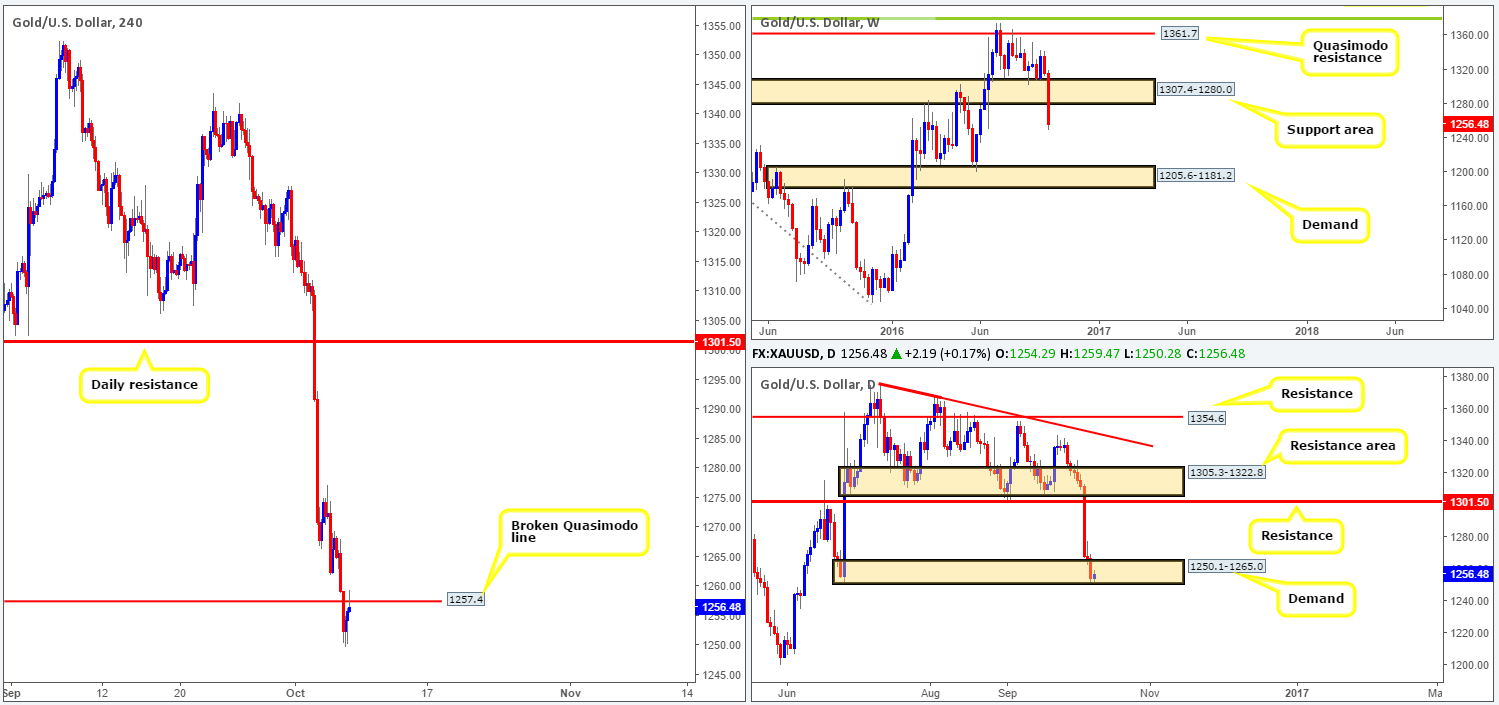
Levels to watch/live orders:
- Buys: Flat (Stop loss: N/A).
- Sells: 1257.4 region ([lower timeframe confirmation required] Stop loss: dependent on where one confirms this area).


