
EUR/USD:
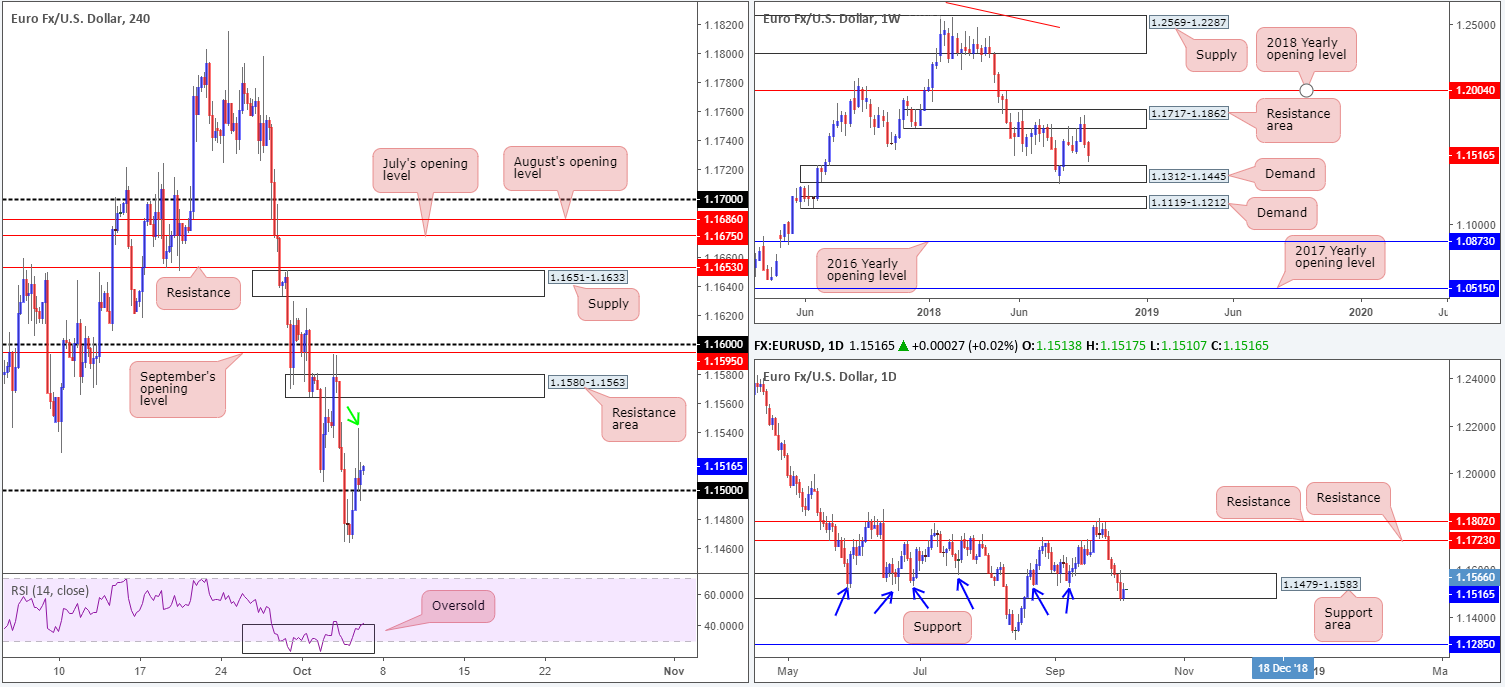
Thursday’s movement observed the EUR/USD exchange rate rise from an open of 1.1477 to a peak of 1.1542, consequently violating a dominant six-day bearish phase.
Latest action could lead to some headway unfolding on the H4 scale towards a resistance area at 1.1580-1.1563, followed closely by September’s opening level at 1.1595 and the round number 1.16. On top of this, the pair recently regained control of its 1.15 handle and successfully retested the level as support amid US hours.
Against the backdrop of intraday flow, we can also see a noteworthy daily support area at 1.1479-1.1583 holding ground for the time being. While the pair could potentially take this as a bullish cue and trade higher, do bear in mind room for a possible move lower is offered on the weekly scale towards demand at 1.1312-1.1445.
Areas of consideration:
The 1.15 retest as support emphasizes strength, presenting a reasonably robust bullish close. Further adding to this, the H4 wick seen marked with a green arrow at 1.1542 likely cleared a truckload of supply (sellers) for a possible move north towards at least the H4 resistance area mentioned above at 1.1580-1.1563. This, coupled with the daily support area at 1.1479-1.1583 showing signs of rotation, may be enough to lift the euro higher today.
For folks considering an entry at current price, tucking stop-loss orders beneath the H4 rejection candle’s tail at 1.1492 is an idea. Assuming the move higher comes to fruition, traders have the opportunity of at least netting a 1:2 risk/reward trade here.
On the data front, we have the mighty NFP report due for release later on today. Non-farm payrolls points to 185,000 increase, against August’s 201,000 print. Unemployment is expected to drop back to 3.8% over 3.9% previous. Average hourly earnings are expected to increase by 0.3%.
Today’s data points: US average hourly earnings m/m; US non-farm employment change and unemployment rate.
GBP/USD:
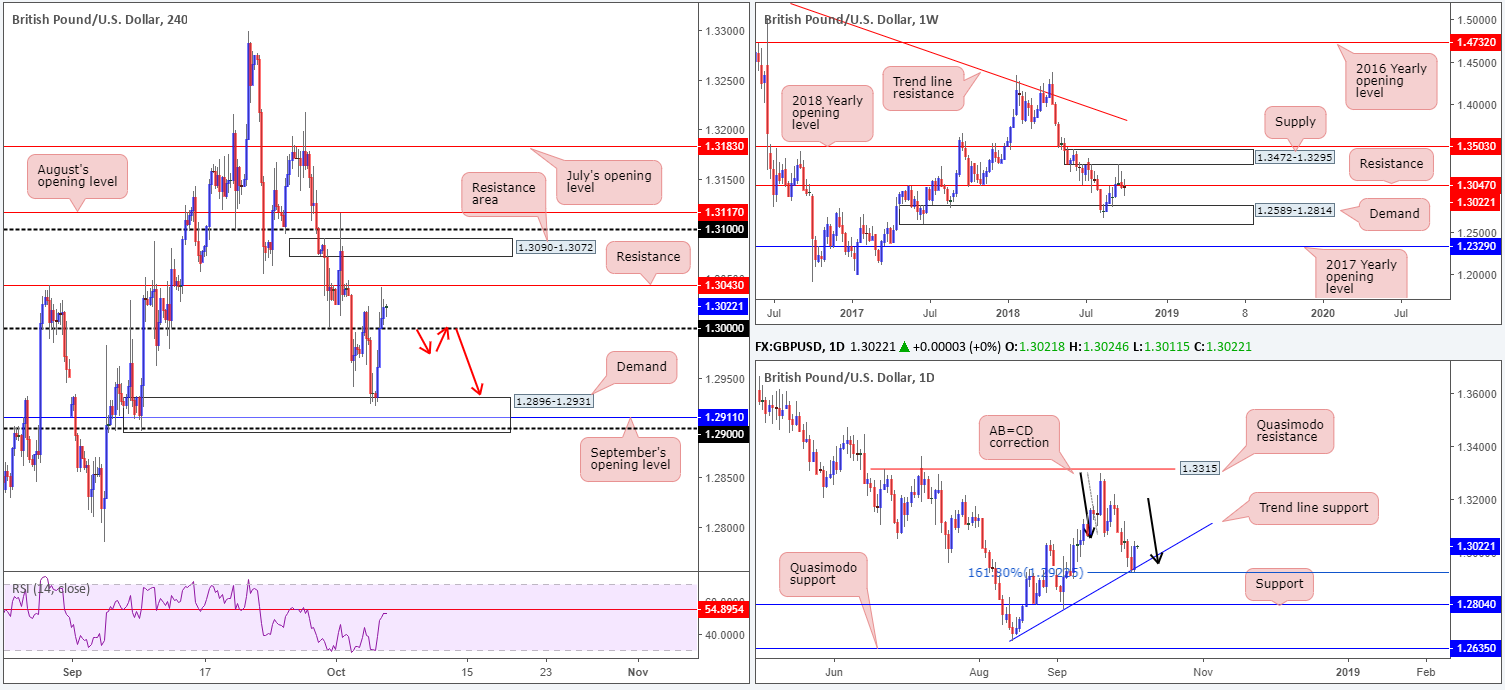
Brexit headlines improved demand for British pound on Thursday, with EU’s Barnier stating they’re in the final stage of negotiations.
For those who read Thursday’s briefing you may recall the team drawing attention to H4 demand at 1.2896-1.2931 as a possible buy zone. Not only does it house September’s opening level at 1.2911 and the 1.29 handle, it also converges with a daily AB=CD termination point at 1.2927: its 161.8% Fib ext. (also labelled an alternate AB=CD pattern as per Scott Carney). As you can see, the H4 candles chalked up a bullish pin-bar formation yesterday and aggressively advanced north, concluding the day in positive territory above 1.30. Well done to any of our readers who managed to jump aboard this move!
Going forward, however, considerable obstacles lie in the way of further gains, cautioning an exuberantly bullish approach from here. H4 resistance is seen plotted nearby at 1.3043, along with an additional layer of resistance coming in just above it at 1.3047 on the weekly timeframe. Further adding to this, H4 RSI resistance is seen close by at 54.89.
Areas of consideration:
On account of the aforementioned resistances, traders who remain long from the noted H4 demand may want to begin considering unloading some of their position.
For traders looking to short based on oncoming resistance, waiting for the 1.30 figure to be reclaimed to the downside is an option. To our way of seeing things, this indicates seller intent and may bring the unit south to revisit the said H4 demand base. Shorts on the retest of 1.30 (red arrows) are, therefore, something to keep tabs on.
Today’s data points: US average hourly earnings m/m; US non-farm employment change and unemployment rate.
AUD/USD:
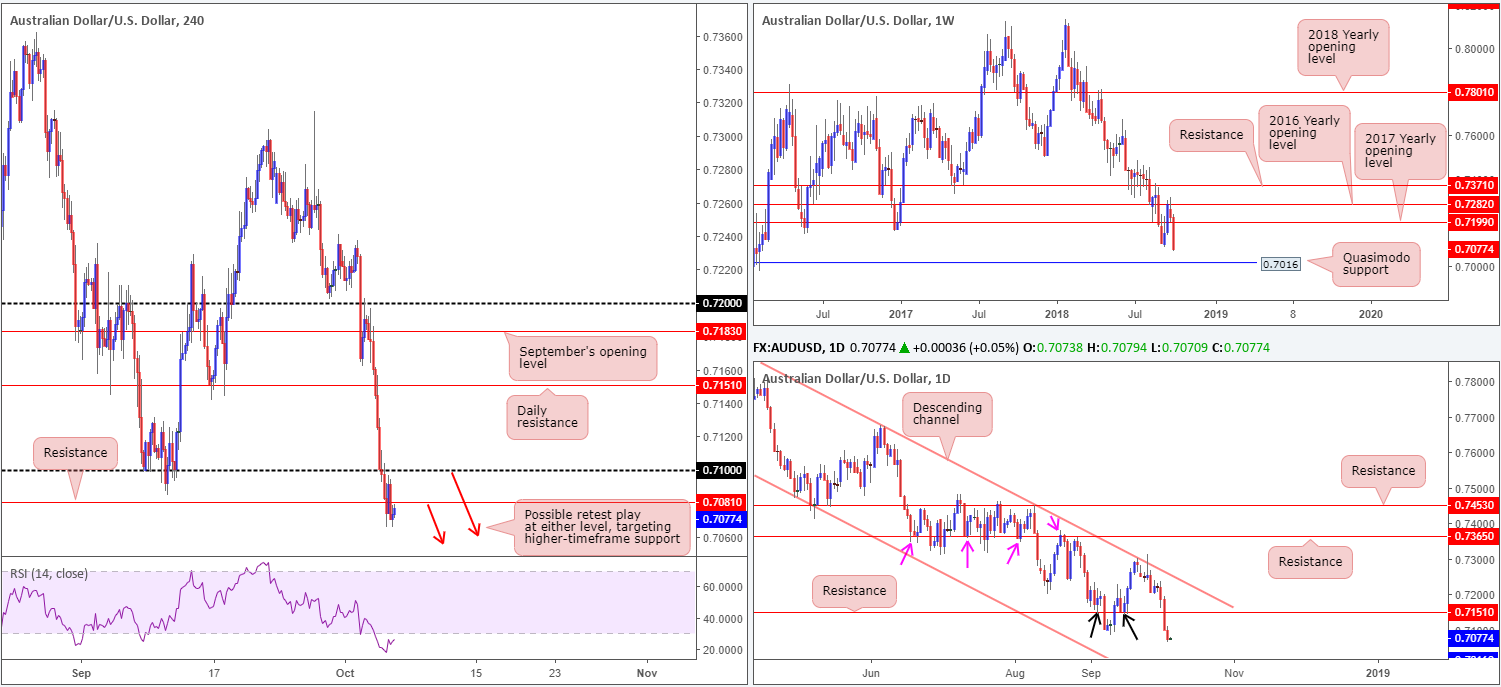
Unable to reclaim its 0.71 handle and largely overlooking upbeat Aussie trade balance data, the AUD/USD resumed its downside movement on Thursday. The break of the H4 Quasimodo support at 0.7081 (now acting resistance) is considered a strong bearish cue.
Below 0.7081 there’s limited demand to the left of current price stopping the unit from pressing as far south as weekly Quasimodo support at 0.7016 (the daily timeframe has a similar downside target). With this in mind, the underside of 0.7081 or the 0.71 handle may be sufficient platforms to consider a shorts from today.
Areas of consideration:
While keeping in mind Aussie retail sales data is due for release in a couple of hours, we feel shorts on the retest of either 0.7081 or 0.71 is certainly an option today. Just to be clear, though, waiting for additional candle confirmation is a must. Not only will this highlight which level to trade and offer entry/stop-loss parameters, traders should always act on the side of caution as the market approaches a potentially high-impacting news release.
Today’s data points: Australian retail sales m/m; US average hourly earnings m/m; US non-farm employment change and unemployment rate.
USD/JPY:
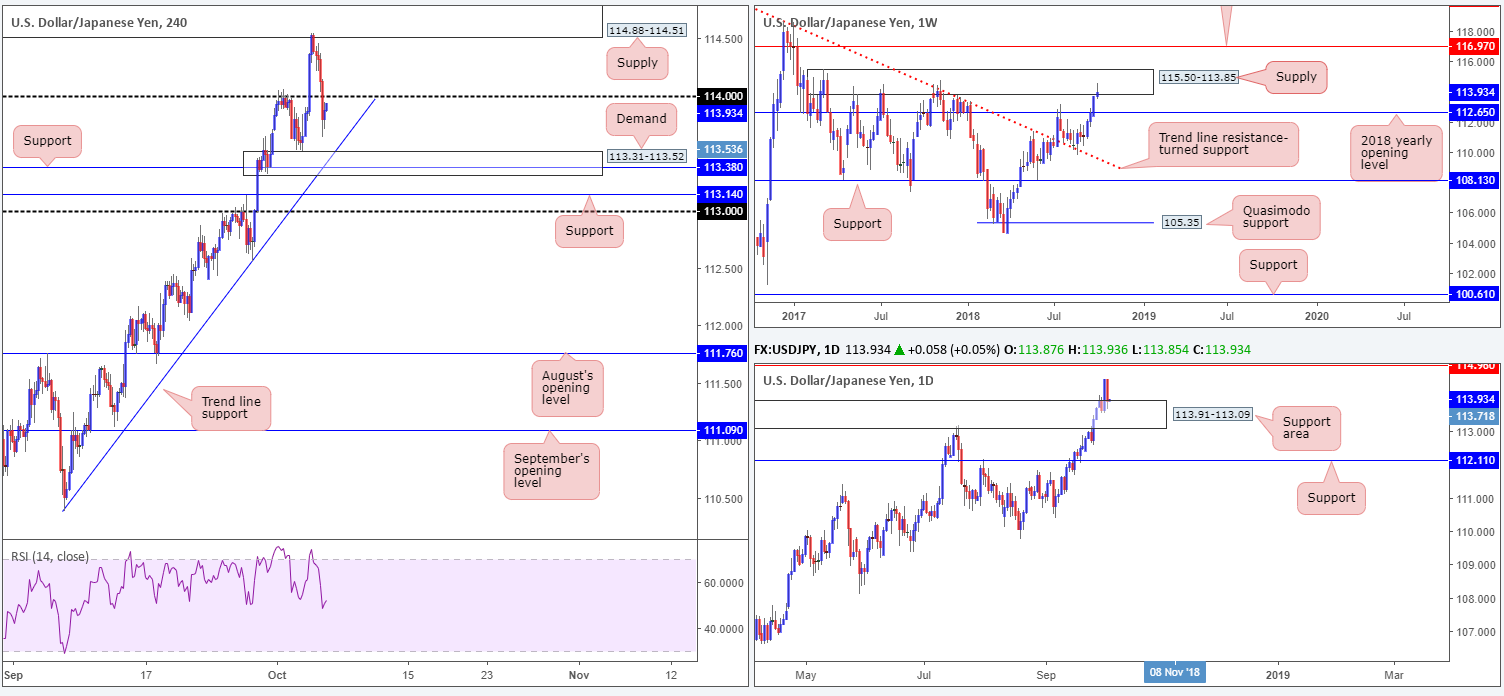
Across the board, the US dollar (according to the US dollar index) pivoted lower on Thursday following a six-day bullish phase.
H4 supply on the USD/JPY at 114.88-114.51, as you can see, recently elbowed its way into the spotlight and held price action lower. The move out of here drove the unit sub 114 to lows of 113.63, eclipsing a large portion of Wednesday’s gains.
While weekly price is seen printing a strong bearish pin-bar formation out of notable supply on the weekly timeframe at 115.50-113.85, both daily and H4 structure could prove to be problematic for sellers. Beyond 114 on the H4 scale, proven demand rests at 113.31-113.52 along with a merging trend line support (extended from the low 110.38) and support coming in from 113.38. Along the same vein, daily price is testing the top edge of a support area penciled in at 113.91-113.09, after failing to challenge nearby Quasimodo resistance at 114.96 (not seen on the screen).
Areas of consideration:
Considering only the H4 scale for a moment, most traders would agree the current H4 demand holds reasonably attractive confluence that’s likely to produce at least a bounce higher – even more so given the converging daily support area. Nevertheless, trading long from here entails buying into potential weekly selling out of a mammoth supply zone!
To that end, traders are urged to exercise caution in this market given the conflicting tone observed on the charts. Regardless of the direction one selects, opposing structure is clearly marked.
Today’s data points: US average hourly earnings m/m; US non-farm employment change and unemployment rate.
USD/CAD:
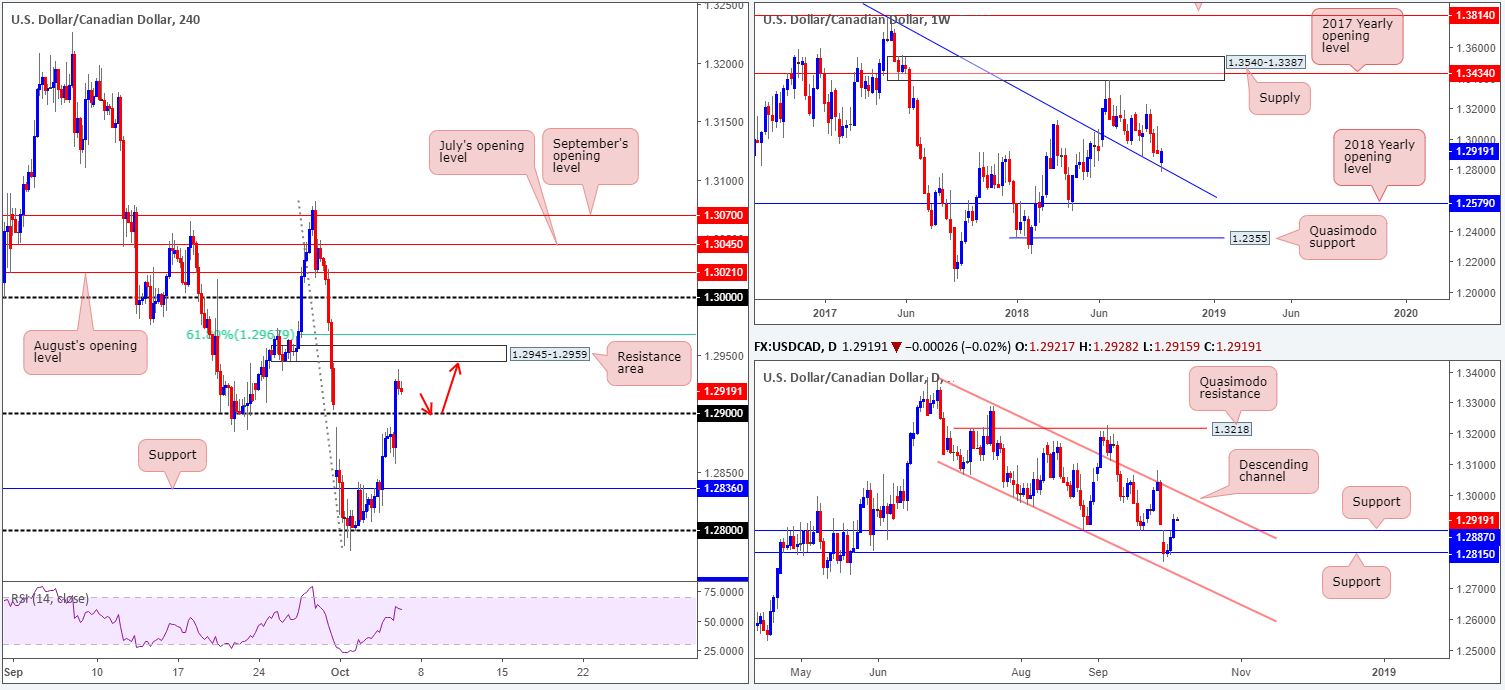
The US dollar advanced against its Canadian counterpart on Thursday, firmly reclaiming 1.29 status on the H4 timeframe. The rally, as far as we can see, was likely triggered by a combination of a selloff in oil and buying off the USD/JPY’s weekly trend line resistance-turned support (extended from the high 1.4689). This technical barrier supported this market once already back in late August, so there’s a chance we may see history repeat itself.
Assuming buyers remain defensive above 1.29, the main interest falls in around 1.2945-1.2959, a H4 demand-turned resistance area that’s positioned just south of a 61.8% H4 Fib resistance value at 1.2967. In terms of daily price action, resistance at 1.2887 (now acting support) was engulfed as a result of yesterday’s push higher, consequently shining the spotlight on a channel resistance (taken from the high 1.3386) as the next upside target.
Areas of consideration:
At current price, all three timeframes point to further buying in this market.
A retest of 1.29 that’s reinforced with additional candlestick confirmation is, technically speaking, likely enough to consider a buy in this market (red arrows), targeting the H4 resistance area at 1.2945-1.2959 as the initial take-profit zone.
As for entry and stop-loss placement, traders are urged to follow the selected confirming candlestick parameters.
Today’s data points: US average hourly earnings m/m; US non-farm employment change and unemployment rate; Canadian job’s data and trade balance.
USD/CHF:
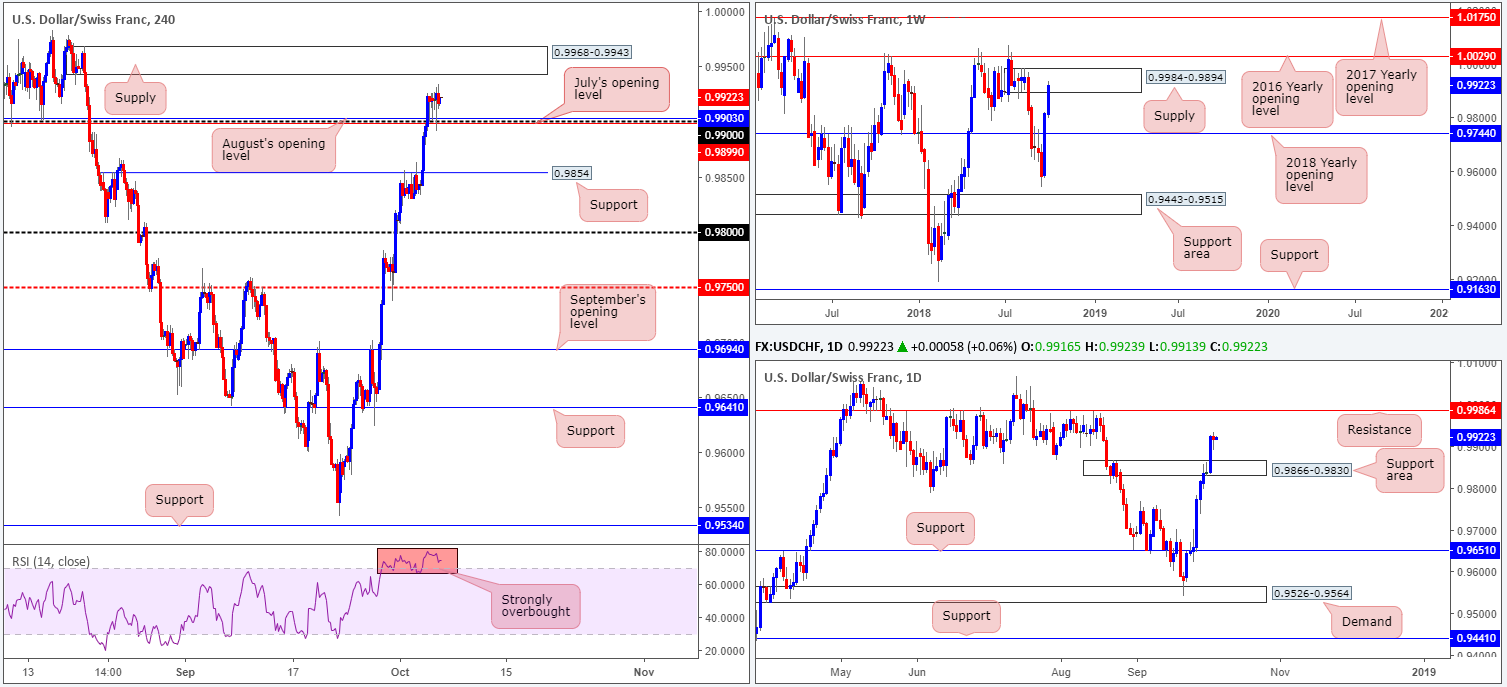
Following price action reclaiming/retesting its 0.99 handle (along with its closely converging August’s opening level at 0.9903 and also July’s opening level at 0.9899) on Wednesday, the H4 candles are seen little changed this morning. Further buying from current price has the nearby H4 supply zone at 0.9968-0.9943 to target.
On a wider perspective, however, weekly price is seen firmly engaging with strong supply drawn from 0.9984-0.9894. In terms of structure, this area boasts solid momentum out of its base. Daily action, although the unit could find resistance at current price due to weekly supply, could potentially stretch as high as resistance seen at 0.9986.
Areas of consideration:
Given the lackluster performance on Thursday, our outlook for this market remains unchanged.
For folks looking to buy at current price, upside is somewhat limited owing to nearby H4 supply plotted at 0.9968-0.9943 that’s positioned within the current weekly supply zone. Therefore, trade with caution!
Failure to climb from 0.99 will likely result in a pullback to 0.9854 on the H4 scale. A retest to the underside of 0.99 in the shape of a bearish candlestick formation (either H4 or on the lower timeframes) would be considered a strong sell signal.
Today’s data points: US average hourly earnings m/m; US non-farm employment change and unemployment rate.
Dow Jones Industrial Average:
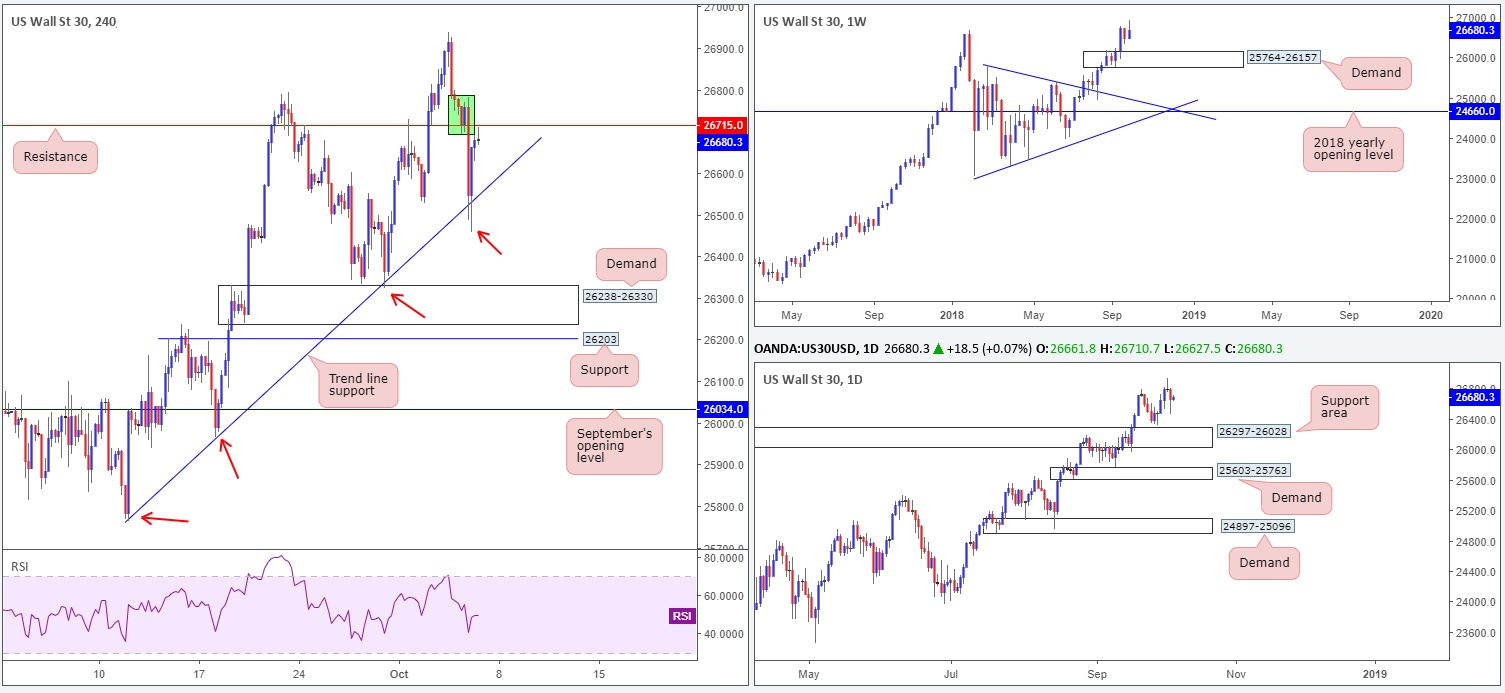
US equities ended Thursday’s segment in the red, following sharp losses recorded in tech, communication and energy sectors. H4 support at 26715 was abruptly taken out (now acting resistance), though the H4 candles managed to find a platform off trend line support (extended from the low 25764).
In recent hours, the market observed a recovery take shape from the noted H4 trend line support, dragging the index up to within striking distance of H4 resistance at 26715. Given the base of supply formed around this resistance level (marked in green), a decisive H4 close above the level would need to be seen before the team is convinced the bulls have a strong hand in this fight.
Areas of consideration:
Ahead of today’s US job’s report, H4 price will likely meander between its current trend line support and nearby resistance mentioned above at 26715.
Unless a decisive H4 close prints above 26715 and retests the barrier as support in the shape of a well-defined candlestick formation, entering long is a challenge.
Today’s data points: US average hourly earnings m/m; US non-farm employment change and unemployment rate.
XAU/USD (Gold)
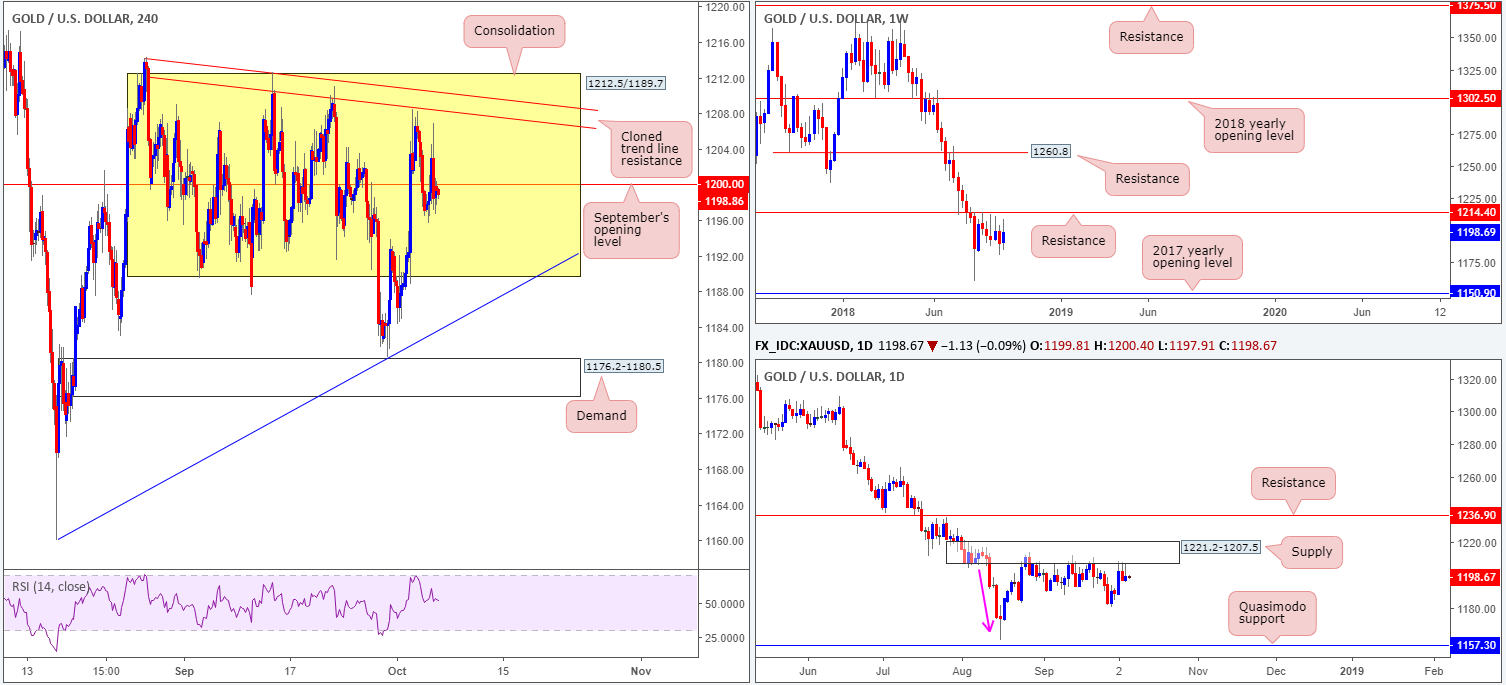
Since the later stages of August, the H4 candles (apart from a brief spell during late September) have been busy carving out quite a substantial consolidation between 1212.5/1189.7, which happens to hold September’s opening level at 1200.0. Also of note on the H4 scale is the cloned trend line resistance (taken from the high 1214.3) and trend line support (extended from the low 1160.0).
As we move up the curve, traders will notice the H4 range is fixed around the underside of daily supply at 1221.2-1207.5. Traders may have also acknowledged yesterday’s movement chalked up a nice-looking daily bearish pin-bar formation off this area. This – coupled with weekly price languishing beneath a key resistance level at 1214.4 that shows room to press as far south as 1150.9 (the 2017 yearly opening level) – shows we may still have some strong sellers in the mix.
Areas of consideration:
In light of where price is trading from on the higher timeframes, a long in this market will unlikely produce much to get excited about. You’re simply buying against higher-timeframe flow here.
Points of interest for shorts, on the other hand, can be seen beneath September’s opening level at 1200.0, the cloned H4 trend line resistance and the top edge of the H4 range at 1212.5. Either barrier, according to the overall technical picture, is a high-probability short as long as it’s accompanied with additional candlestick confirmation, be it on the H4 or H1 timeframe.
The use of the site is agreement that the site is for informational and educational purposes only and does not constitute advice in any form in the furtherance of any trade or trading decisions.
The accuracy, completeness and timeliness of the information contained on this site cannot be guaranteed. IC Markets does not warranty, guarantee or make any representations, or assume any liability with regard to financial results based on the use of the information in the site.
News, views, opinions, recommendations and other information obtained from sources outside of www.icmarkets.com.au, used in this site are believed to be reliable, but we cannot guarantee their accuracy or completeness. All such information is subject to change at any time without notice. IC Markets assumes no responsibility for the content of any linked site. The fact that such links may exist does not indicate approval or endorsement of any material contained on any linked site.
IC Markets is not liable for any harm caused by the transmission, through accessing the services or information on this site, of a computer virus, or other computer code or programming device that might be used to access, delete, damage, disable, disrupt or otherwise impede in any manner, the operation of the site or of any user’s software, hardware, data or property.


