Waiting for lower timeframe confirmation is our main tool to confirm strength within higher timeframe zones, and has really been the key to our trading success. It takes a little time to understand the subtle nuances, however, as each trade is never the same, but once you master the rhythm so to speak, you will be saved from countless unnecessary losing trades. The following is a list of what we look for:
- A break/retest of supply or demand dependent on which way you’re trading.
- A trendline break/retest.
- Buying/selling tails/wicks – essentially we look for a cluster of very obvious spikes off of lower timeframe support and resistance levels within the higher timeframe zone.
- Candlestick patterns. We tend to stick with pin bars and engulfing bars as these have proven to be the most effective.
We typically search for lower-timeframe confirmation between the M15 and H1 timeframes, since most of our higher-timeframe areas begin with the H4. Stops are usually placed 1-3 pips beyond confirming structures.
EUR/USD:
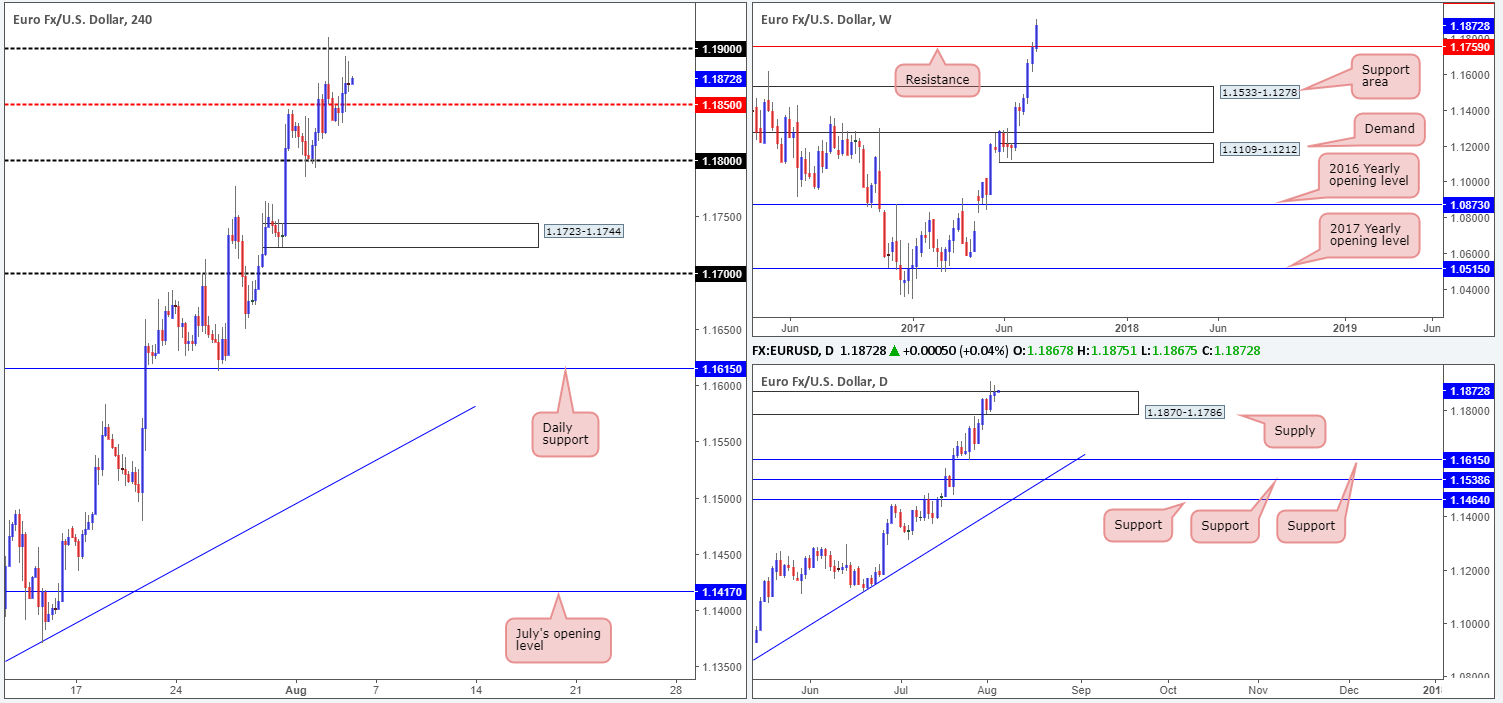
During the course of yesterday’s segment, the single currency traded the first half of the London session sub 1.1850. Following a close above this number, however, H4 price retested the line as support and rose to a high of 1.1893 on the day.
Weekly bulls continue to show promise above weekly resistance at 1.1759. Should the major conclude the week closing beyond this line, further buying could take shape up to a weekly resistance planted at 1.2044. Turning our attention to the daily chart, supply at 1.1870-1.1786, although it is still intact, remains vulnerable to the upside. This is not only because of where weekly price is trading and the strong uptrend the EUR is currently entrenched within, but also due to the back-to-back daily spikes seen through the top edge of the daily zone.
Our suggestions: While it is clear that this market remains in a robust position at this time, we are reluctant to consider buying until the noted daily supply has been consumed (by consumed we mean a daily close printed above the area). In addition to this, it would be imprudent of our desk to buy this market when we’re still short the GBP/USD!
Data points to consider: US Job’s report at 1.30pm GMT+1.
Levels to watch/live orders:
- Buys: Flat (stop loss: N/A).
- Sells: Flat (stop loss: N/A).
GBP/USD:
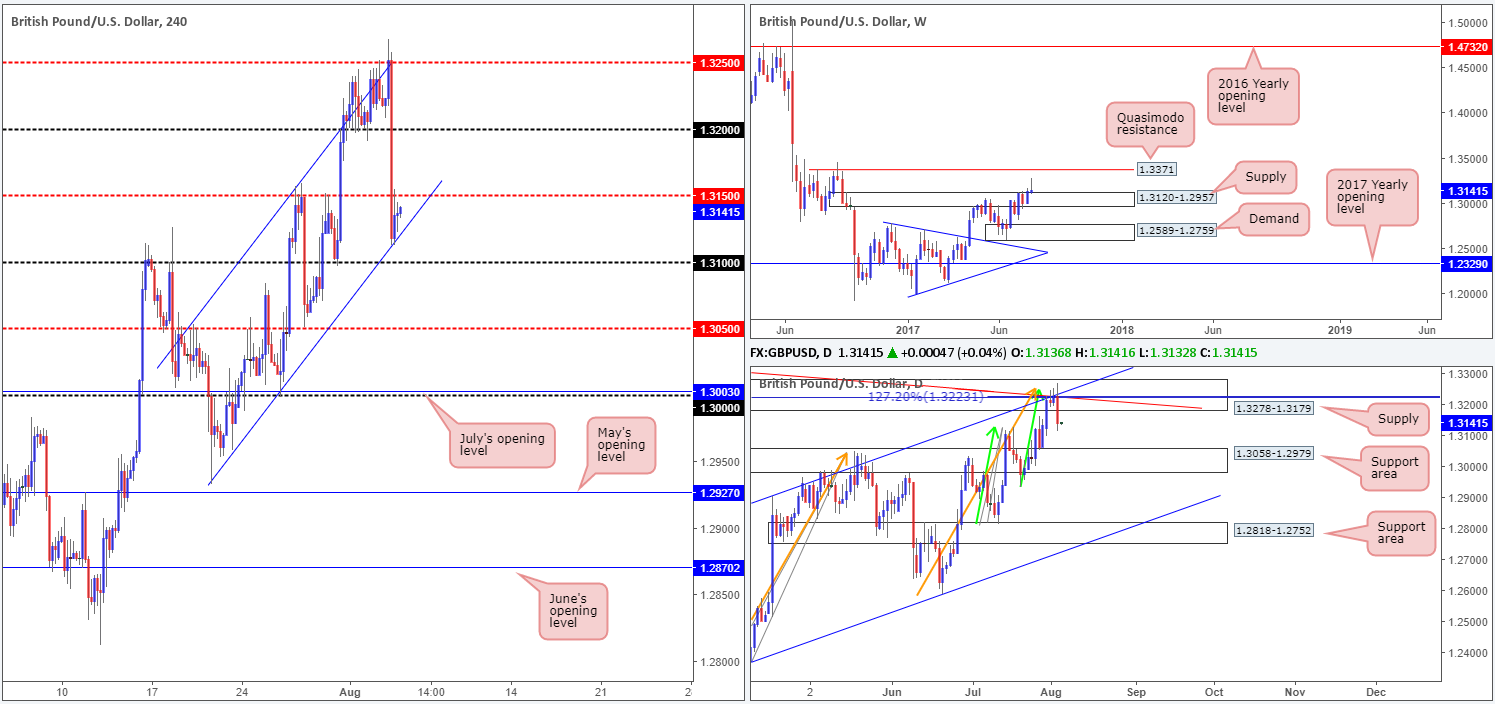
The BoE kept its monetary policy unchanged on Thursday, consequently sending the pair sharply lower. As can be seen from the H4 chart, price bottomed just ahead of the 1.31 handle, buoyed by a channel support line etched from the low 1.2932. As we write, the balance between bids/offers appear to be even between the current channel support and the nearby mid-level resistance at 1.3150.
For those who follow our reports on a regular basis, you may recall that our desk recently took a short position from 1.3209, with conservative stops planted at 1.3280. Our reasoning behind executing a short position from here was strong: daily supply at 1.3278-1.3179, a daily trendline resistance taken from the high 1.3477, a daily channel resistance drawn from the high 1.2903 and two converging daily AB=CD (green/orange arrows) 127.2 Fib extensions at 1.3222/1.3223 (taken from the lows 1.2811/1.2365). Also, for you RSI fans, there was daily divergence in motion, as well. In light of the recent move lower, we have moved the stop-loss order to breakeven.
Our suggestions: In an ideal world, we’re looking for the unit to continue pressing lower today, breaking through the H4 channel support line and also the nearby 1.31 handle. Assuming that this comes to fruition, the 1.3050 region will be in sight – a level we’ll be looking to take partial profits at given its relationship with the daily support area at 1.3058-1.2979 (the next downside target on the daily scale).
Data points to consider: US Job’s report at 1.30pm GMT+1.
Levels to watch/live orders:
- Buys: Flat (stop loss: N/A).
- Sells: 1.3209 ([live] stop loss: breakeven).
AUD/USD:
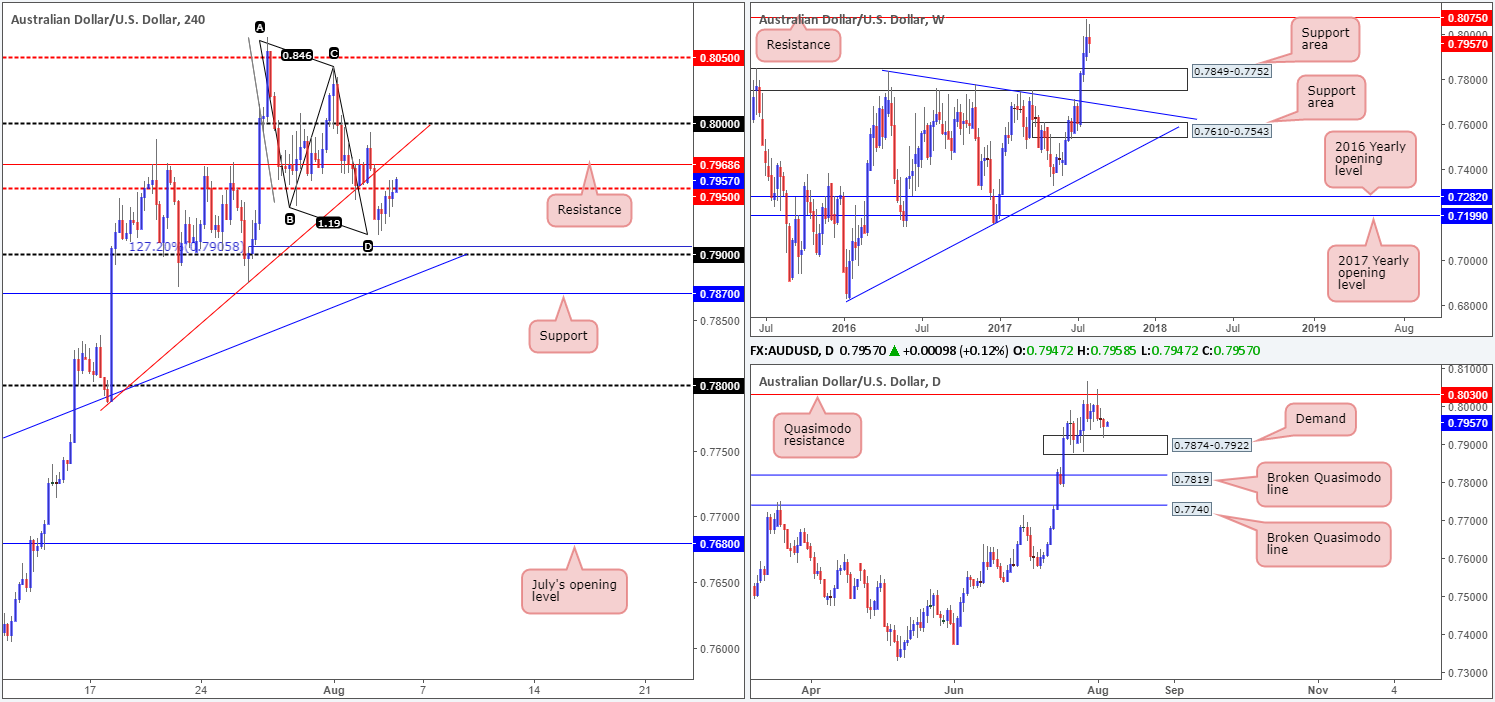
In recent trading, the H4 candles completed an AB=CD measured move at 0.7916, taken from high 0.8065. Leaving the 0.79 handle and its nearby H4 127.2% Fib ext. at 0.7905 unchallenged, the unit inched its way higher yesterday, with price now seen testing the waters beyond the mid-level resistance at 0.7950.
What gives the H4 measured move extra credibility is the daily demand seen marked at 0.7874-0.7922. This could, if the bulls continue to support the pair, lift price back up to the daily Quasimodo resistance at 0.8030. Still, before this can come to realization, the nearby H4 resistance at 0.7968 will need to be cleared.
Our suggestions: Technically speaking, there is not really much to hang our hat on at the moment, as far as trading opportunities. Buying may appear to be a good idea on the daily chart, but with H4 resistance lurking just ahead, we’re unwilling to commit. For that reason, our desk will remain on the sidelines for the time being and look to reassess structure following the US job’s report.
Data points to consider: RBA Monetary policy statement and Australian Retail sales figures at 2.30am. US Job’s report at 1.30pm GMT+1.
Levels to watch/live orders:
- Buys: Flat (stop loss: N/A).
- Sells: Flat (stop loss: N/A).
USD/JPY:
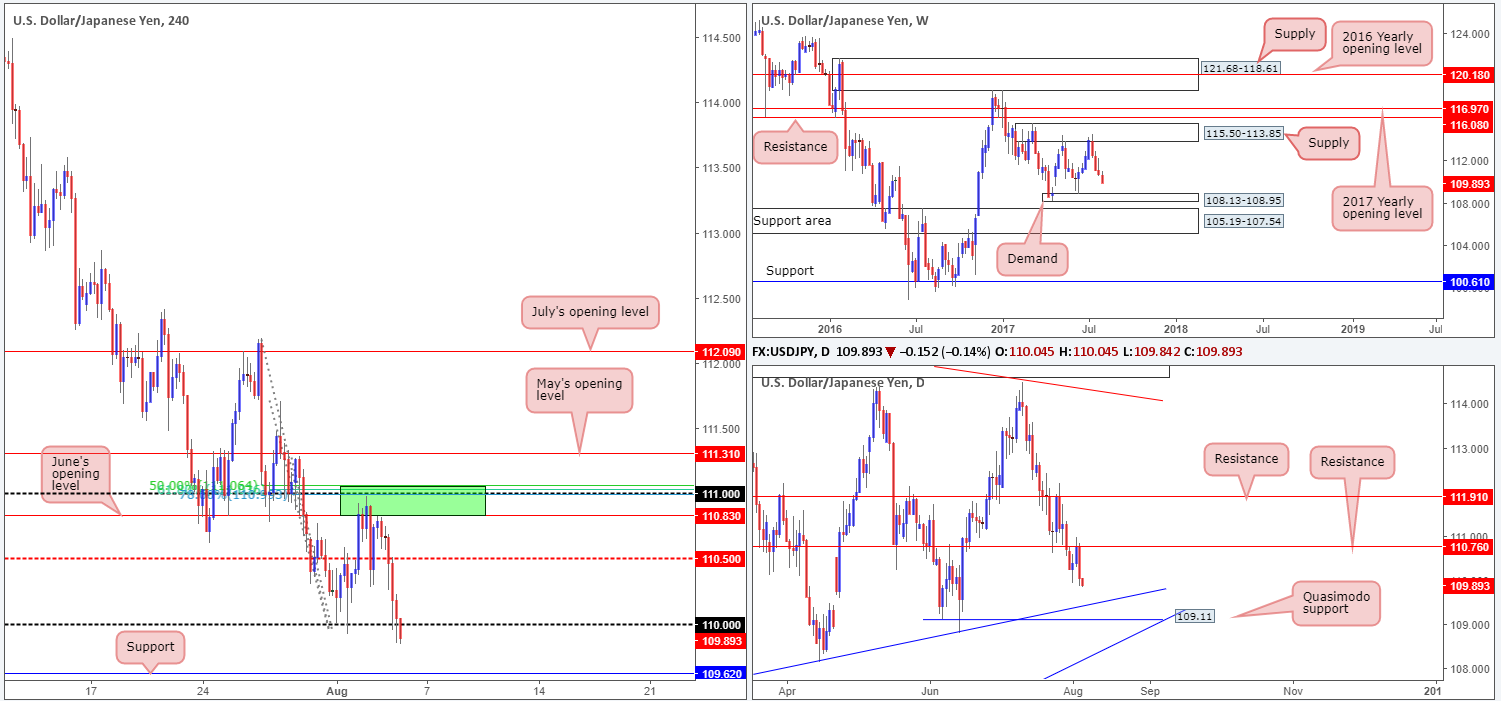
Following a second near-retest of the H4 sell zone marked in green at 111.07/110.83, the USD/JPY plummeted south on Thursday. Comprised of a H4 Fibonacci resistance cluster (50.0%/61.8%/78.6% taken from the highs 112.19/111.71/111.28), June’s opening level at 110.83 and a psychological band at 111, this zone was an area of interest to our team. Unfortunately, we were unable to pin down a lower-timeframe entry signal!
As we write, H4 price is trading sub 110 which could lead to the unit challenging support logged in at 109.62. From the weekly timeframe, the market looks as though it could continue to press lower until we reach the small demand base seen at 108.13-108.95. Zooming in and looking at the daily picture, we can see that price recently responded to resistance at 110.76 and now looks poised to test a Quasimodo support at 109.11 (converges closely with a trendline support taken from the low 108.13).
Our suggestions: With the higher-timeframe picture suggesting that further selling could be on the cards, a close below 110 on the H4 chart likely suggests that we’re heading down to at least the H4 support mentioned above at 109.62. We would not trade this market short, however, until H4 action retests 110 as resistance and prints a lower-timeframe sell signal thereafter (see the top of this report).Ideally, we want the stop to be no more than 15 pips, so as to aid risk/reward down to the 109.62 region.
Data points to consider: US Job’s report at 1.30pm GMT+1.

Levels to watch/live orders:
- Buys: Flat (stop loss: N/A).
- Sells: Watch for H4 price to close below 110 and then look to trade any retest seen thereafter ([waiting for a lower-timeframe entry to form following the retest is advised] stop loss: dependent on where one confirms the level).
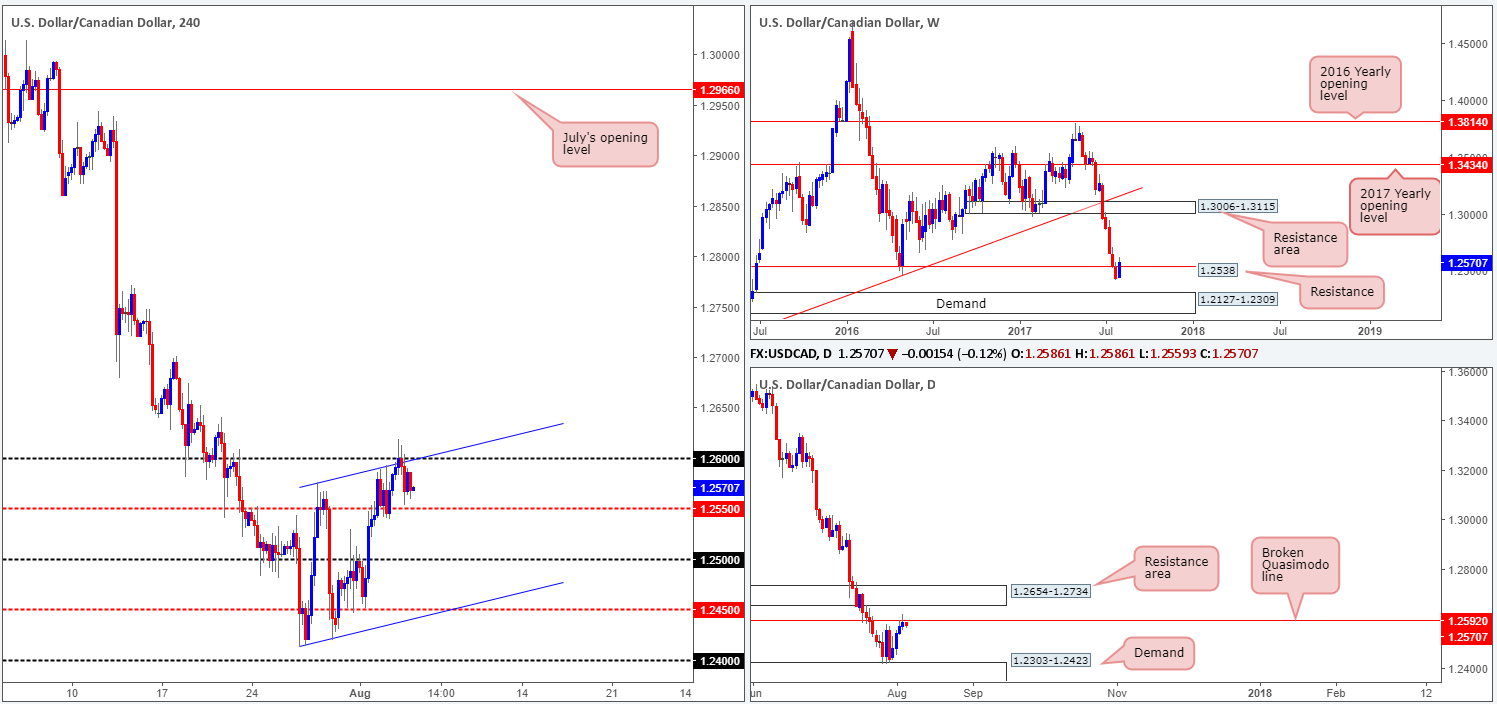
USD/CAD:
The USD/CAD failed to sustain gains beyond the 1.26 handle and its converging H4 channel resistance (extended from the high 1.2576) on Thursday, resulting in the market closing mid-range between 1.26 and the H4 mid-level support pegged at 1.2550. Of particular interest here is the daily broken Quasimodo line at 1.2592, as it is positioned just beneath 1.26. Also noteworthy is the weekly resistance line coming in a little lower on the curve at 1.2538. This – coupled with the trend on this pair pointing to the downside – we believe the bears likely have the upper hand at this time.
Our suggestions: Watch for H4 price to close beneath the mid-level support at 1.2550 today. This – followed up with a retest and a H4 bearish candle – preferably a full, or near-full-bodied candle, would, in our opinion, be enough evidence to sell. Should the trade come to fruition, the ultimate take-profit target would, for us, be the neighboring H4 channel support etched from the low 1.2413, which happens to converge closely with the top edge of a daily demand base at 1.2303-1.2423 (the next downside target on that scale).
Data points to consider: US/Canadian Job’s report at 1.30pm GMT+1.
Levels to watch/live orders:
- Buys: Flat (Stop loss: N/A).
- Sells: Watch for H4 price to close below 1.2550 and then look to trade any retest seen thereafter ([waiting for a H4 bearish candle to form [preferably a full-bodied candle] following the retest is advised] stop loss: ideally beyond the candle’s wick).
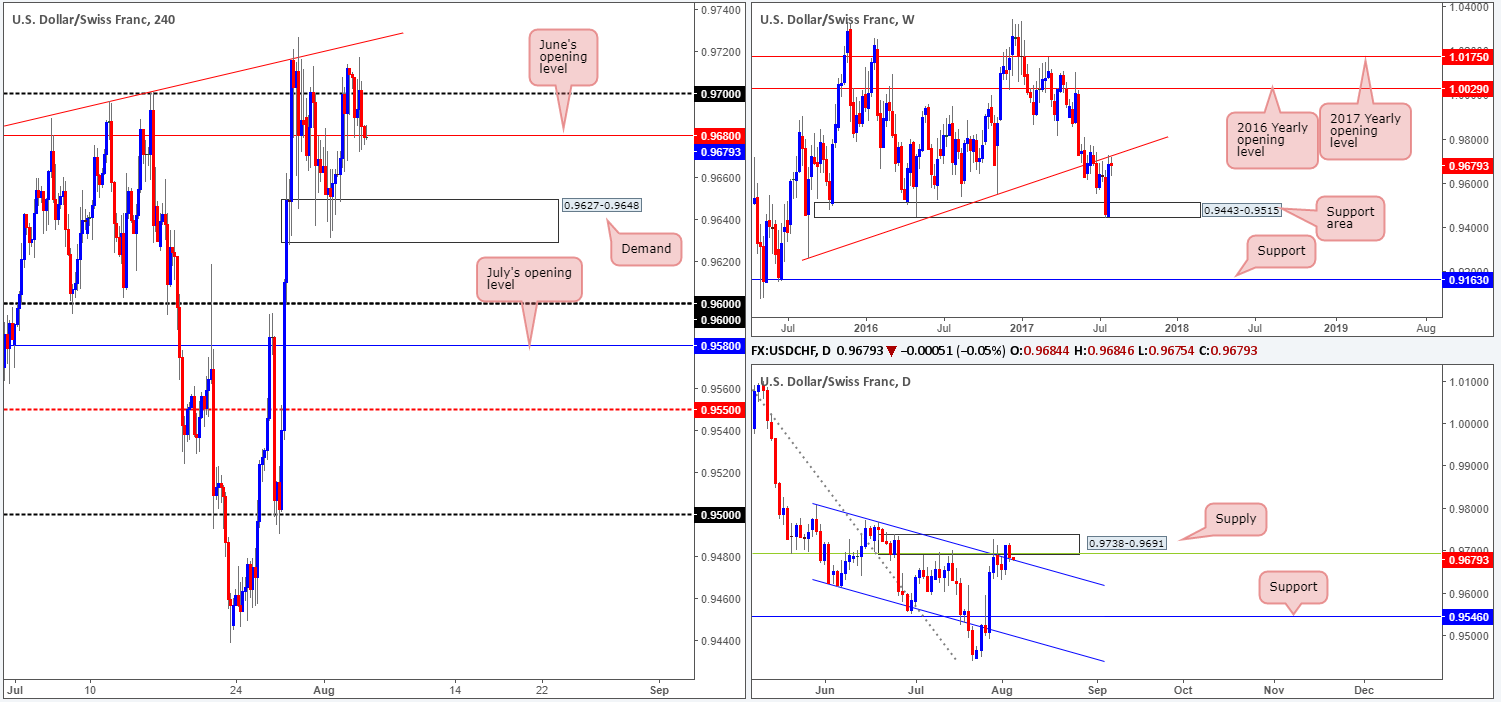
USD/CHF:
Working our way down from the top this morning, weekly flow remains kissing the underside of a major weekly trendline resistance extended from the low 0.9257. In the event that the bears punch lower from here, the next downside target is likely to be the weekly support area logged at 0.9443-0.9515. Down on the daily picture, we can see that price continues to be capped by a supply zone at 0.9738-0.9691, which converges with a channel resistance extended from the high 0.9808 and a 38.2% Fib resistance at 0.9693 taken from the high 1.0099. Of late, however, the bulls closed above the said channel resistance, and are in the process of retesting the line as support.
Across on the H4 chart, June’s opening level at 0.9680 is currently seen in the mix. A violation of this line would likely place the demand area at 0.9627-0.9648 in the spotlight.
Our suggestions: With the recent (daily) close above the aforementioned daily channel resistance, this could suggest that the current daily supply may be weakening. Although the downside is still favored at the moment, it is a difficult market to sell. Not only because of the current daily channel support, but also due to June’s opening level at 0.9680 and the nearby H4 demand base at 0.9627-0.9648. For that reason, we’ll remain on the sidelines and wait for further developments post today’s US job’s report.
Data points to consider: US Job’s report at 1.30pm GMT+1.
Levels to watch/live orders:
- Buys: Flat (stop loss: N/A).
- Sells: Flat (stop loss: N/A).
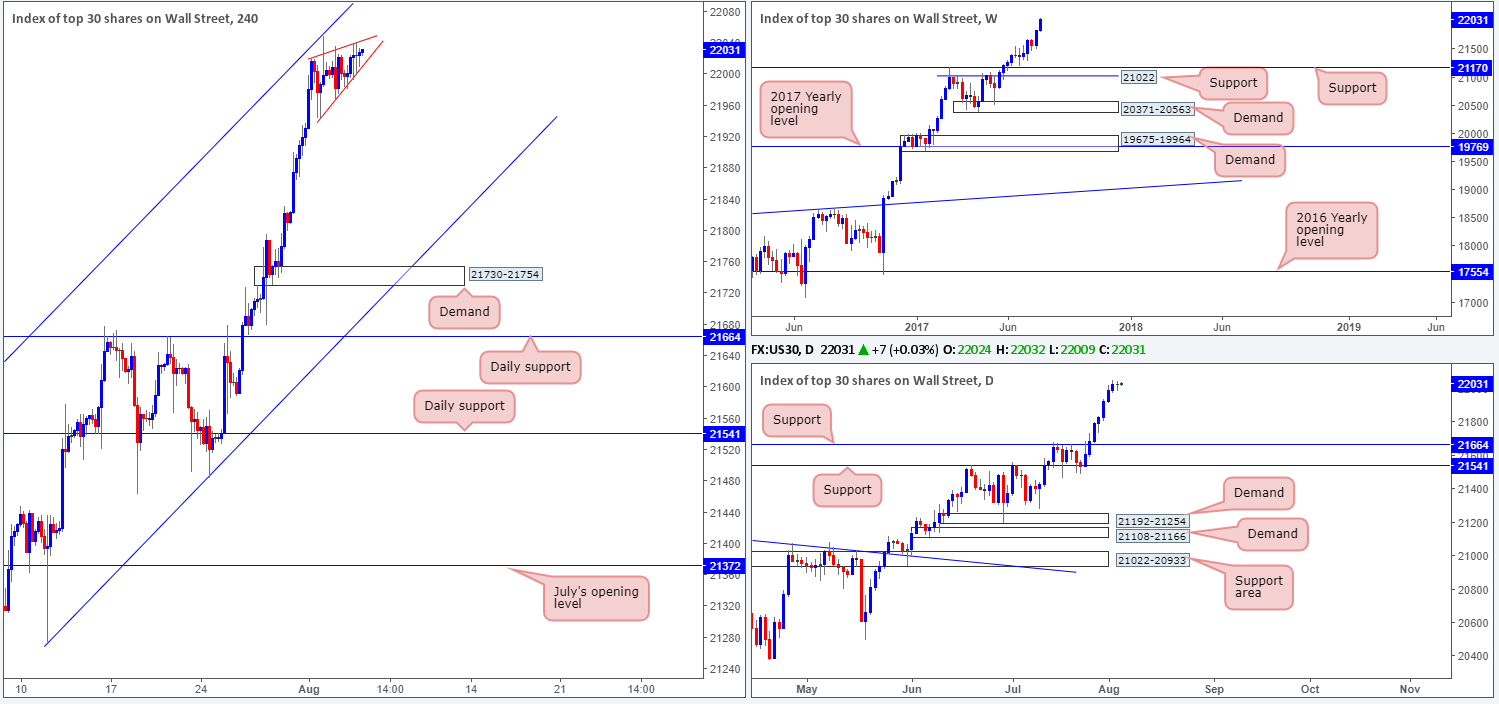
DOW 30:
Of late, the US equity market entered into a phase of rising compression between two converging H4 trendlines (21942/22019). This came after price shook hands with a H4 channel resistance extended from the high 21493. Could this be the bears making an appearance? While this is a possibility, one has to remain conscious of the surrounding landscape. Both weekly and daily action shows absolutely no resistance on the horizon given that the index is trading at record highs at the moment. The flip side to this, however, is the closest support on the bigger picture does not come into play until daily support at 21664, so should the market selloff, there’s not much in the way to stop it!
Our suggestions: Although there is a chance that this market may head south, we would not feel comfortable selling the recent move north seeing as it is shaped by seven strong consecutive daily bull candles!
Data points to consider: US Job’s report at 1.30pm GMT+1.
Levels to watch/live orders:
- Buys: Flat (stop loss: N/A).
- Sells: Flat (stop loss: N/A).
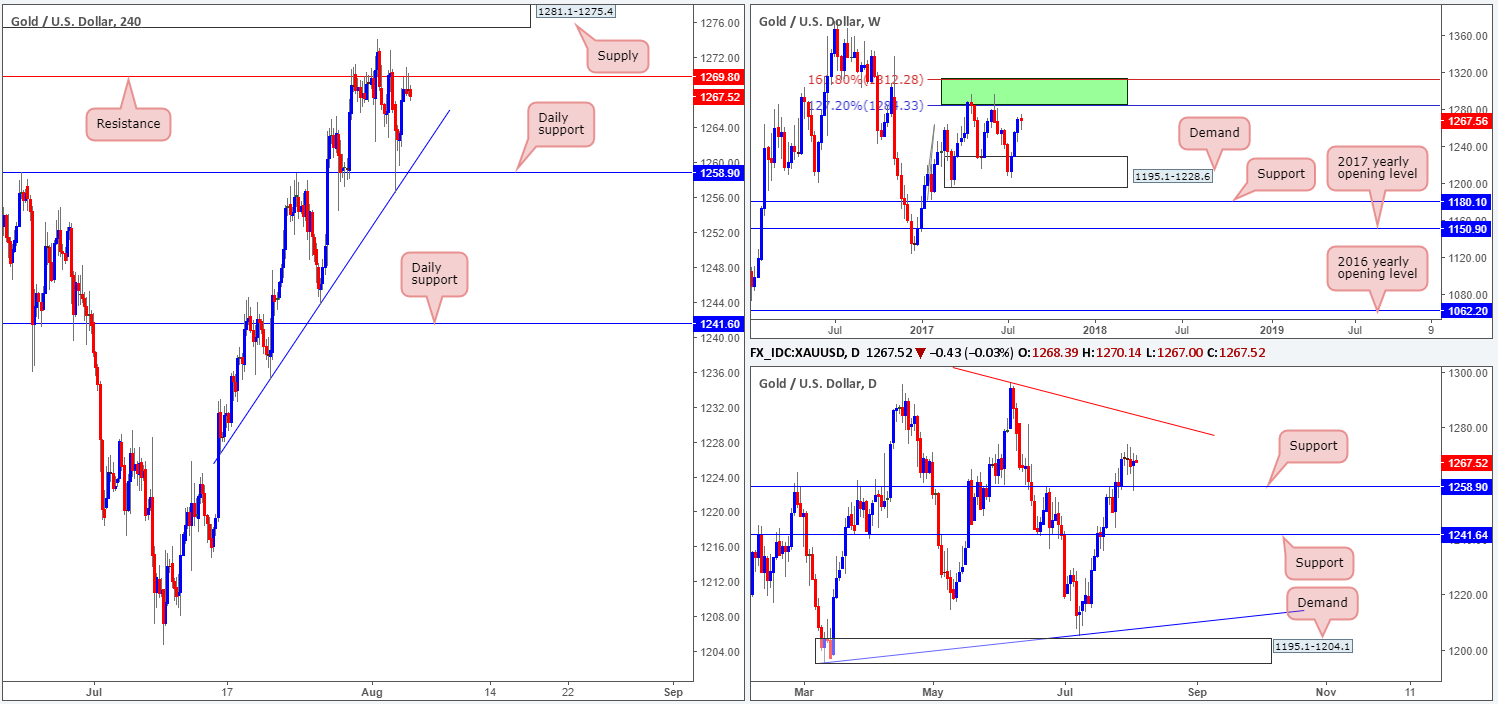
GOLD:
In recent trading, the yellow metal challenged the daily support level at 1258.9 that happened to blend nicely with a H4 trendline support taken from the low 1235.1. The move from here, as you can see, lifted bullion back up to the H4 resistance pegged at 1269.8, which for now is doing a good job of holding the unit lower.
According to the daily timeframe, the bounce from the noted support could lead to a move being seen up to a daily trendline resistance extended from the high 1337.3. What’s also notable here is the daily trendline intersects beautifully with a weekly area comprised of two Fibonacci extensions 161.8/127.2% at 1312.2/1284.3 taken from the low 1188.1 (green zone – the next upside target on the weekly scale).
Our suggestions: With both the weekly and daily timeframes showing room for the bulls to stretch their legs, we would be very cautious selling the current H4 resistance. Buying on the other hand, although you’d be trading in-line with weekly and daily flow, would entail buying into H4 supply seen beyond the current H4 resistance at 1281.1-1275.4. Therefore, our strategy for the time being is to lay low and assess structure following the US job’s report scheduled to be released later on today.
Levels to watch/live orders:
- Buys: Flat (stop loss: N/A).
- Sells: Flat (stop loss: N/A).


