
A note on lower timeframe confirming price action…
Waiting for lower timeframe confirmation is our main tool to confirm strength within higher timeframe zones, and has really been the key to our trading success. It takes a little time to understand the subtle nuances, however, as each trade is never the same, but once you master the rhythm so to speak, you will be saved from countless unnecessary losing trades. The following is a list of what we look for:
- A break/retest of supply or demand dependent on which way you’re trading.
- A trendline break/retest.
- Buying/selling tails/wicks – essentially we look for a cluster of very obvious spikes off of lower timeframe support and resistance levels within the higher timeframe zone.
- Candlestick patterns. We tend to only stick with pin bars and engulfing bars as these have proven to be the most effective.
We search for lower timeframe confirmation between the M15 the H1 timeframes, since most of our higher-timeframe areas begin with the H4. Stops are usually placed 5-10 pips beyond confirming structures.
EUR/USD:
For those who read our previous report (see link below) you may recall us mentioning to watch for short entries around the H4 Harmonic bearish Gartley pattern (PRZ – yellow box [1.1216/1.1191]). What we also mentioned, nonetheless, was to expect a fakeout beyond the PRZ, since the USDX (U.S. Dollar index) showed a major-league H4 support lurking below current price (which at the time stood at 95.42) at 95.20.
As we can see by looking at both of the above said charts, this played out exactly as expected! The USDX hit 95.20 and by extension forced the EUR to fakeout higher. Well done to anyone who jumped aboard this train before it departed south.
Pushing forward, we see the shared currency has also connected with daily supply at 1.1215-1.1264, and as we have mentioned in past reports, the weekly chart continues to reflect a bearish stance from weekly supply at 1.1533-1.1278. Therefore, with the next downside target on the daily chart not in view until daily demand at 1.1057-1.1108, we feel the H4 demand seen marked with a green circle at 1.1114-1.1125 will be faked (ignored) as price will target the 1.11 number/H4 demand at 1.1057-1.1096.
Our suggestions: For traders already short from the above mentioned H4 Harmonic pattern, we see no reason to look for the exit door yet! We would, however, recommend moving stops to breakeven and taking at least 50% off the table since let’s not forget the mighty NFP is just around the corner.
As far as we can see, other than the short trade (that has already moved in favor), neither a long nor short seems attractive at this time.
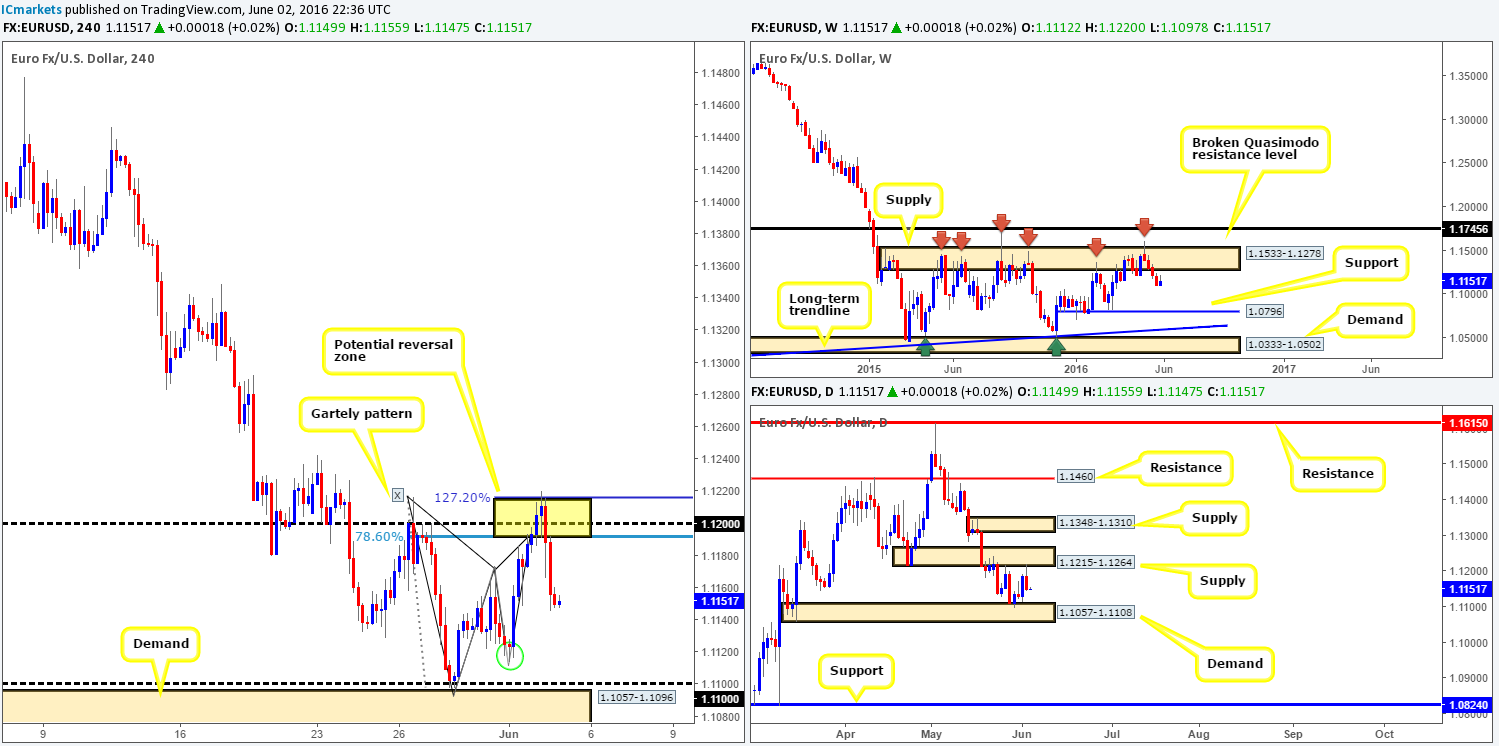
Levels to watch/live orders:
- Buys: Flat (Stop loss: N/A).
- Sells: Flat (Stop loss: N/A).
GBP/USD:
Despite the bounce seen from the 1.44 handle yesterday, downside risk continues to plague this pair. This comes not only from price trading from a weekly broken Quasimodo barrier (BQM) at 1.4633, but also due to sentiment turning sour over the past few days regarding the upcoming British referendum.
In yesterday’s report, we noted to watch for price to break through 1.44 and connect with the H4 Quasimodo support at 1.4374 to enter long. Although this H4 setup is housed within a daily demand area at 1.4297-1.4393, we’re now very wary of this setup. Not only because of what we’ve noted on the weekly chart above, but also due to the U.S. employment report due later on today.
Our suggestions: Of course one can still look to take trades at this H4 Quasimodo support, but we would highly recommend not doing so during NFP. Furthermore, be wary of entering from here with a pending buy order. A fakeout through this line is something to bear in mind since the bigger players may want deeper prices within the current daily demand that converges with daily channel support taken from the low 1.3835.
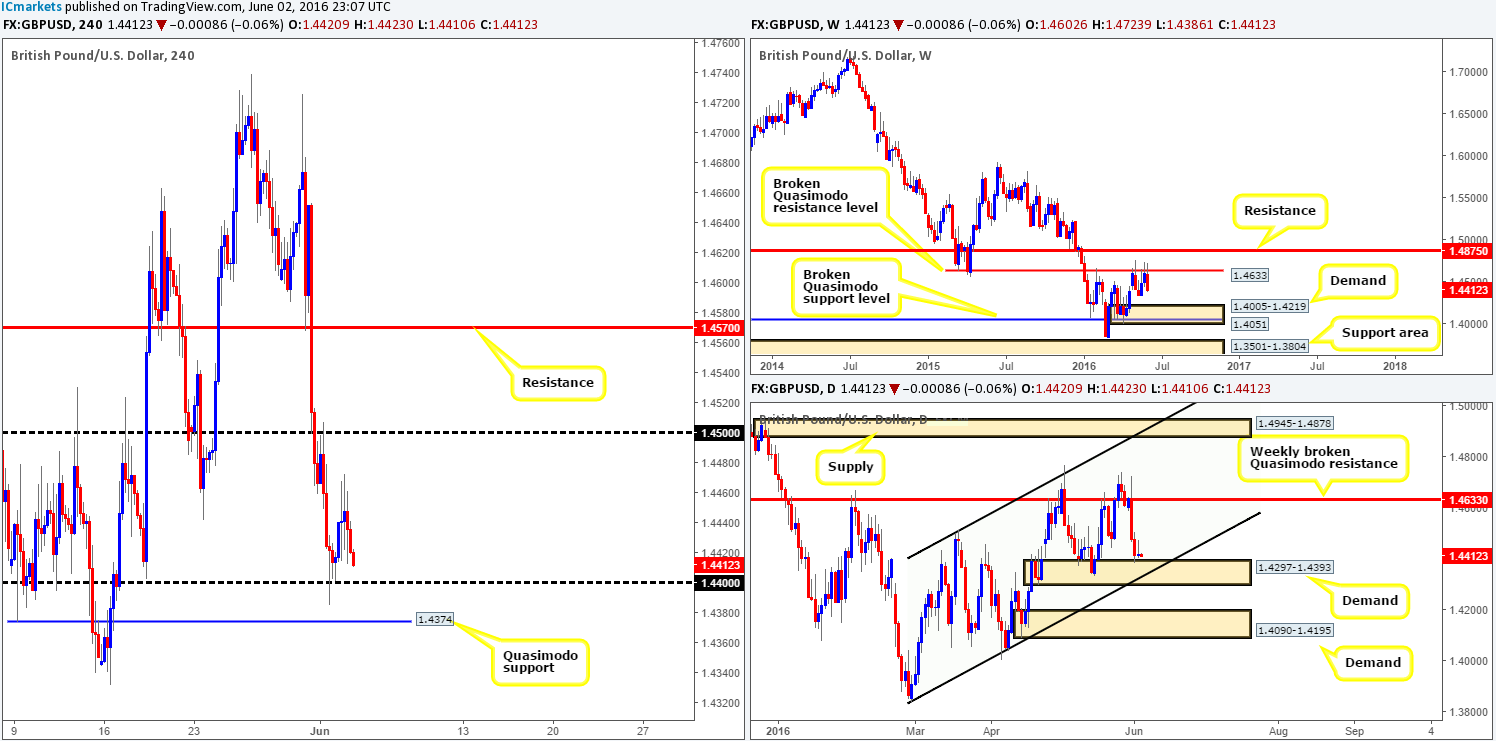
Levels to watch/live orders:
- Buys: 1.4374 region [Tentative – confirmation required] (Stop loss: dependent on where one confirms this area).
- Sells: Flat (Stop loss: N/A).
AUD/USD:
(Slight change in structure)
During the course of yesterday’s sessions the commodity currency continued to drive lower, down from Wednesday’s peak at 0.7299. Mid-way through the London session, however, the Aussie clocked a new low of 0.7201, connecting with H4 channel support (0.7148) and just missing the 0.72 handle.
Now, given that weekly bulls appear to be having a little trouble pushing higher from weekly demand at 0.7108-0.7186, and daily price is currently trading from daily supply at 0.7366-0.7287, where do we go from here? Well, to our way of seeing things price could head in either direction!
Our suggestions: Although the aforementioned weekly demand appears to be struggling, it has yet to be consumed so it is certainly not an area we can ignore. Therefore, should this market close above H4 resistance at 0.7241 (potentially suggesting strength from weekly bulls), there’s very little H4 resistance seen until the 0.73 handle. For this to become a tradable setup for us, nevertheless, price would need to retest this line as support and chalk up a lower timeframe buy signal. Of course, do keep in mind that by entering long from here you’re effectively buying into daily supply, but trading in-line with weekly flow.
On the flip side, if price closes below the 0.72 handle, the next downside targets on the H4 fall in at the H4 trendline support (0.6863) and the H4 Quasimodo support coming in at 0.7145 (sits just above daily demand at 0.7108-0.7140 – the next downside target on this timeframe). As such, a break below and retest of 0.72 (alongside a lower timeframe sell setup) would be a valid trade signal to our team. By shorting from here you would potentially be selling against weekly buyers, but trading in-line with daily flow (please see the top of this report for ideas on how to trade lower timeframe confirming setups).
On a final note, technicals usually fly out of the window once the NFP takes the stage so please remain vigilant during this time!
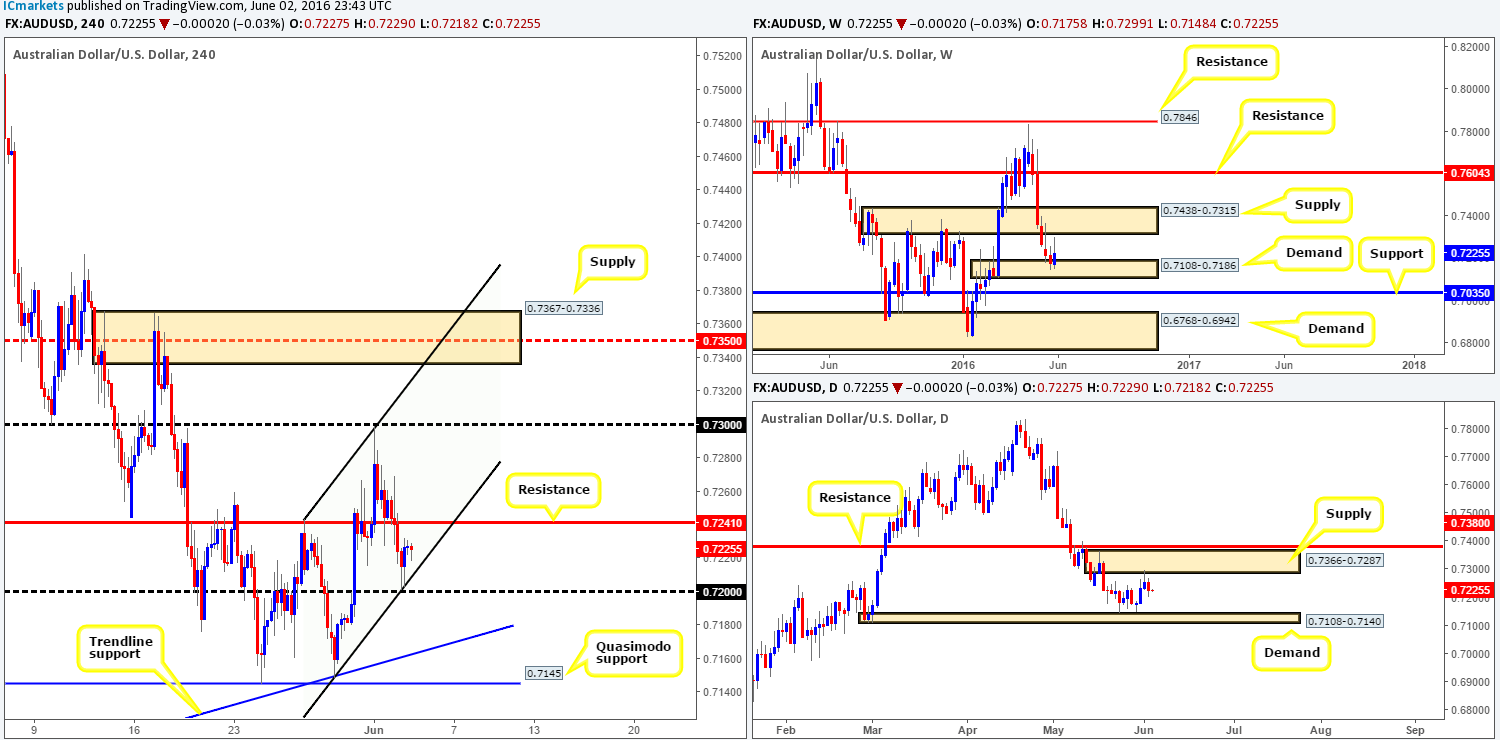
Levels to watch/live orders:
- Buys: Watch for price to consume 0.7241 and then look to trade any retest seen thereafter (lower timeframe confirmation required).
- Sells: Watch for price to consume 0.72 and then look to trade any retest seen thereafter (lower timeframe confirmation required).
USD/JPY:
Additional Yen buying was seen going into yesterday’s sessions, consequently forcing the USD/JPY pair below the 109 handle. It was only once price struck the H4 Quasimodo support at 108.52 amid the U.S. open did we see this market begin to reverse tracks.
Technically, this is a rather tricky pair to analyze at the moment. On the one hand we have weekly sellers stamping this market lower, after coming within touching distance of connecting with weekly supply at 113.80-111.59. Meanwhile, on the other hand, we see daily action lurking just above daily demand penciled in at 107.60-108.35.
Our suggestions: Given the higher-timeframe picture, we do not see any high-probability setups emerging today.
However, for those who are interested 109 could be a nice barrier to keep an eye on. A break above and confirmed retest of this line is a valid long in our book, targeting at least the H4 mid-way resistance 109.50. Along the same vein, should the bears defend 109 and form a lower timeframe entry to short, this would, in our opinion, be a valid trade, targeting at least the aforementioned H4 Quasimodo support (please see the top of this report for ideas on how to trade lower timeframe confirming setups).
In addition to this, expect volatility to hit the markets later on today as it is once again NFP time, so remain vigilant and do not take any unnecessary risks!
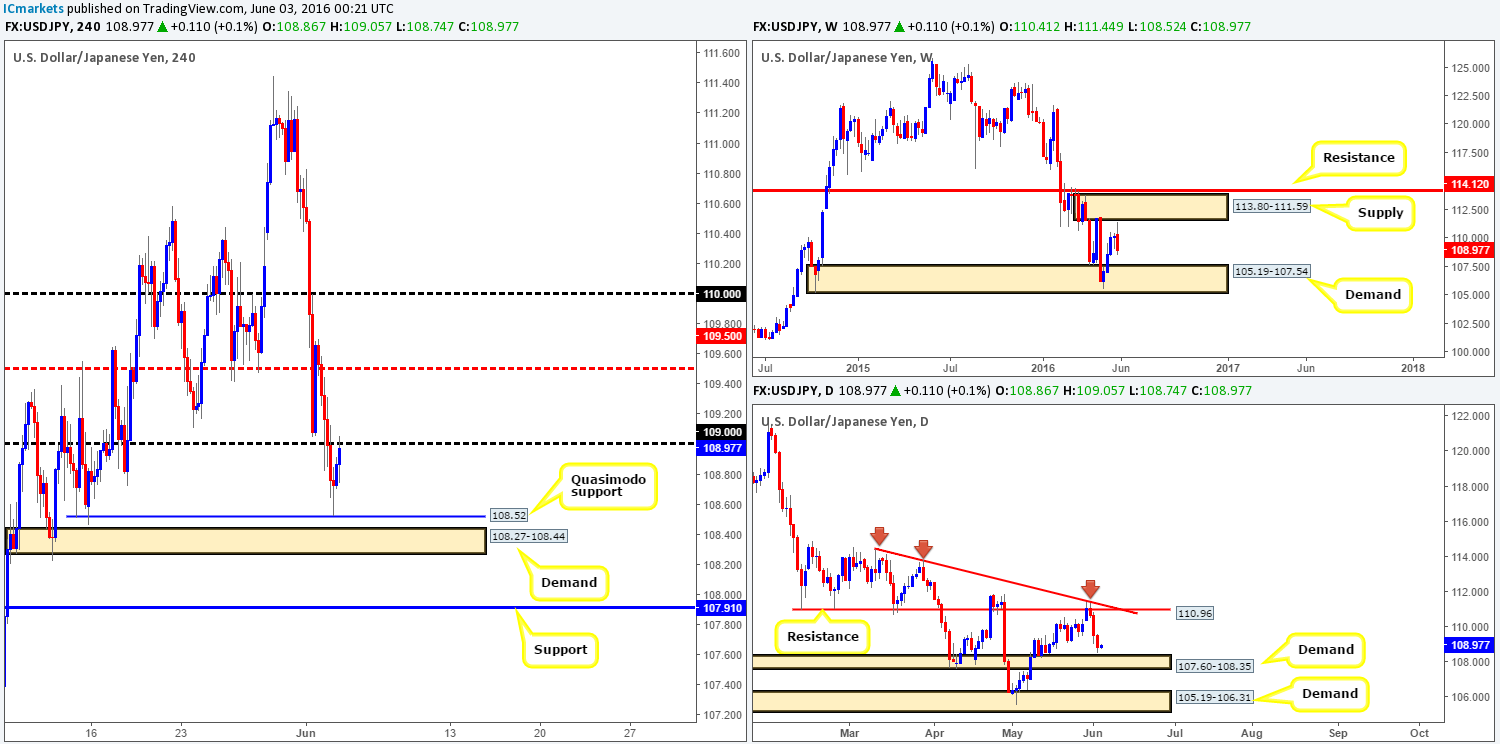
Levels to watch/live orders:
- Buys: Watch for price to consume 109 and then look to trade any retest seen thereafter (lower timeframe confirmation required).
- Sells: 109 region [Tentative – confirmation required] (Stop loss: dependent on where one confirms this area).
USD/CAD:
In recent trading, the Loonie aggressively whipsawed through a H4 trendline resistance taken from the high 1.3188 and beautifully connected with H4 supply at 1.3180-1.3143, before plunging lower. Looking at the H4 chart solely from a technical perspective, we feel that this pair is headed lower today. There is, as far as we can see, very little active H4 demand seen below current prices right now. Check out the H4 tails seen within the green arc, these candle extremes likely took out remaining bids before advancing higher, hence coming to the conclusion that there’s little stopping this market from dropping lower.
In addition to the above, we can see that buyers and sellers are currently battling for position around the lower limits of daily supply at 1.3218-1.3086 right now, thus adding weight to a possible move south.
Our suggestions: Watch for shorting opportunities around the current H4 trendline resistance, targeting the 1.2970/1.3000 area, which in and of itself is also a buy zone (yellow zone) to keep an eyeball on today (daily support at 1.2970, the large psychological boundary 1.30 as well as a H4 trendline support extended from the low 1.2771).
Personally, we would not consider entering at either of the above said levels without lower timeframe confirmation, as it usually allows one to avoid any nasty fakeouts that take place. In closing, do trade carefully today guys as today’s NFP will likely cause some havoc in the market place.
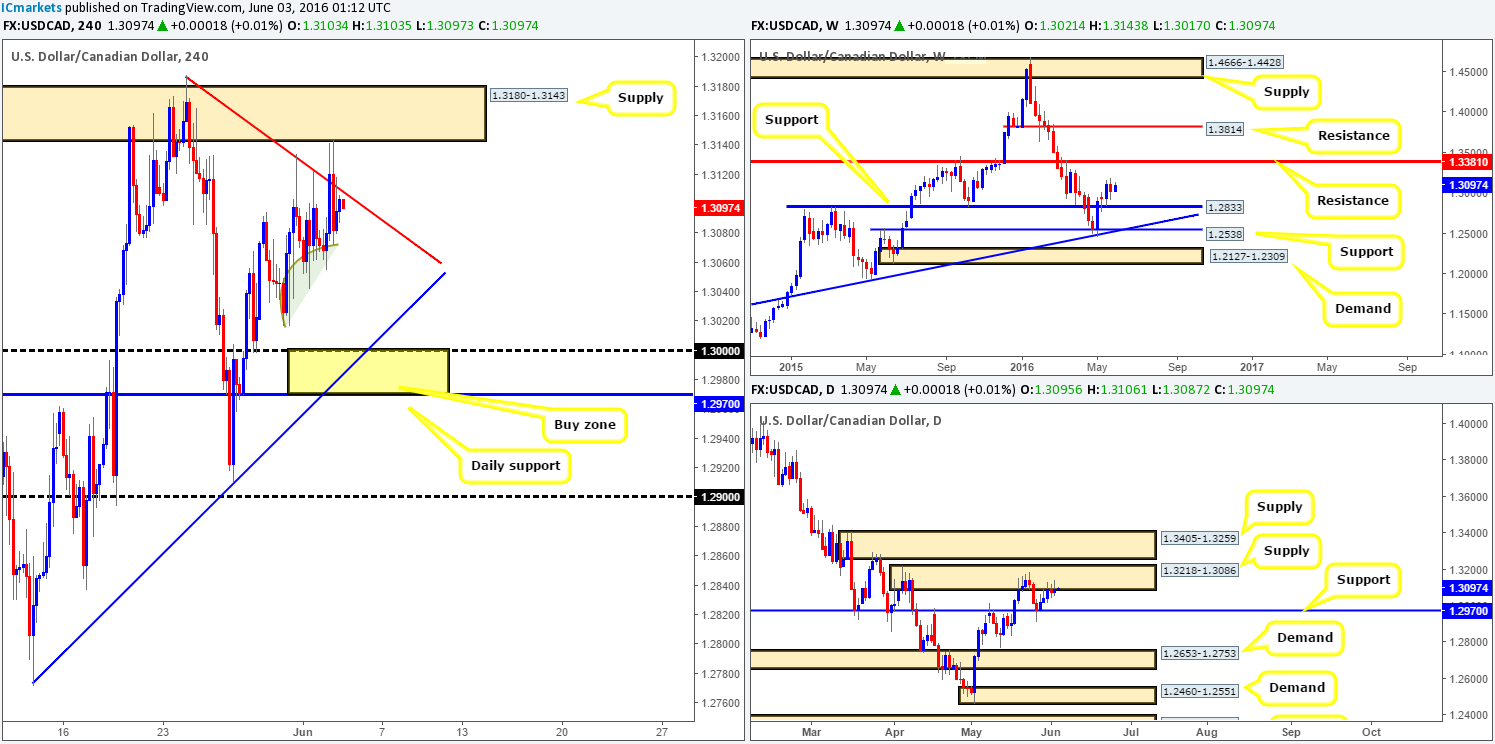
Levels to watch/live orders:
- Buys: 1.2970-1.3000 [Tentative – confirmation required] (Stop loss: dependent on where one confirms this area).
- Sells: Watch the H4 trendline resistance taken from the high 1.3188 for possible shorting opportunities today (lower timeframe confirmation is required here to avoid any nasty fakeouts that could take place – stops will be placed 5-10 pips beyond confirming structures [please see the top of this report to see the confirming setups we use]).
USD/CHF:
Looking at the weekly chart this morning, we can still see that the Swissy pair is flirting with the underside of weekly supply coming in at 1.0092-0.9928. As we have mentioned in previous reports, due to the size of this area there is a chance that price may still yet push higher before sellers make any noteworthy appearance. Down on the daily chart, demand at 0.9913-0.9869, despite suffering a breach yesterday, is still holding firm. With this being the case, if the buyers can continue to defend this demand, there is a possibility that we may see this pair head towards the daily Quasimodo resistance line at 1.0037 (positioned within weekly supply). Jumping across to the H4 chart, demand at 0.9862-0.9884 also suffered a slight breach (see green arrow) yesterday, before advancing to highs of 0.9910 on the day.
Our suggestions: With the pair now looking relatively comfortable above the 0.99 handle, this could encourage further buying in this market up to at least the H4 mid-way resistance 0.9950. Although a move from this number is supported by the aforementioned daily demand, we really do not feel comfortable buying within the current weekly supply even with lower timeframe confirmation!
The only places we would be comfortable trading this market is at the following:
- Shorting the break/retest (with lower timeframe confirmation – see the top of this report for ideas) of the current H4 demand, targeting 0.9800/0.9821 (0.98 handle, H4 broken Quasimodo support line at 0.9809 and daily support at 0.9821).
- Between the aforementioned daily Quasimodo resistance and parity (1.0000). This would be an awesome sell zone to consider shorting at market from, since it sits nicely within the above said weekly supply base.
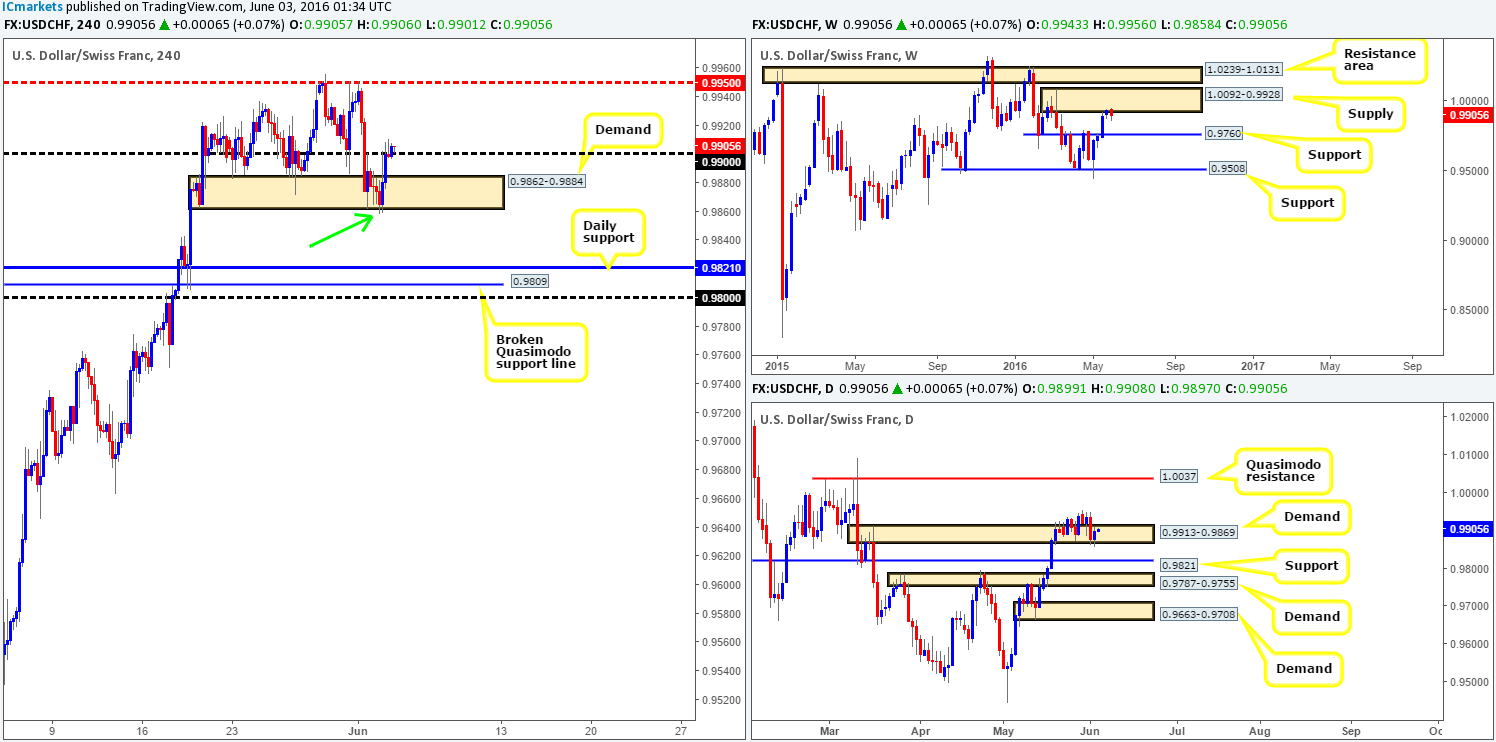
Levels to watch/live orders:
- Buys: Flat (Stop loss: N/A).
- Sells: Watch for price to consume 0.9862-0.9884 and then look to trade any retest seen thereafter (lower timeframe confirmation required). 1.0037/1.0000 [An area to consider shorting from at market] (Stop loss: Safest place would be above the weekly supply area at 1.0095).
DOW 30:
U.S. stocks rocketed higher going into yesterday’s American session, following a to-the-pip touch off a H4 trendline support taken from the low 17327. With the H4 supply at 17907-17872 now in sight, bolstered by a H4 resistance level at 17920, how do things stand on the higher-timeframe picture? Well, we can see that weekly buyers remain trading from a weekly support area at 17446-17606, but as of now the strength of the bulls here is uncertain. Meanwhile, daily action is seen trading within touching distance of a resistance level drawn from 17894.
Our suggestions: Given how reliable the current daily resistance level has proved to be in the past, our team believes that that H4 supply zone at 17907-17872, which encapsulates the daily line, is likely to hold prices should the DOW reach this high. Therefore, if this market come into contact with this H4 zone before the NFP shenanigans begin, we’ll look to short this zone (preferably with lower timeframe confirmation – see the top of this report for ideas) with the hope we can get our stop to breakeven before the employment data is released. It will be interesting to see how this pans out.
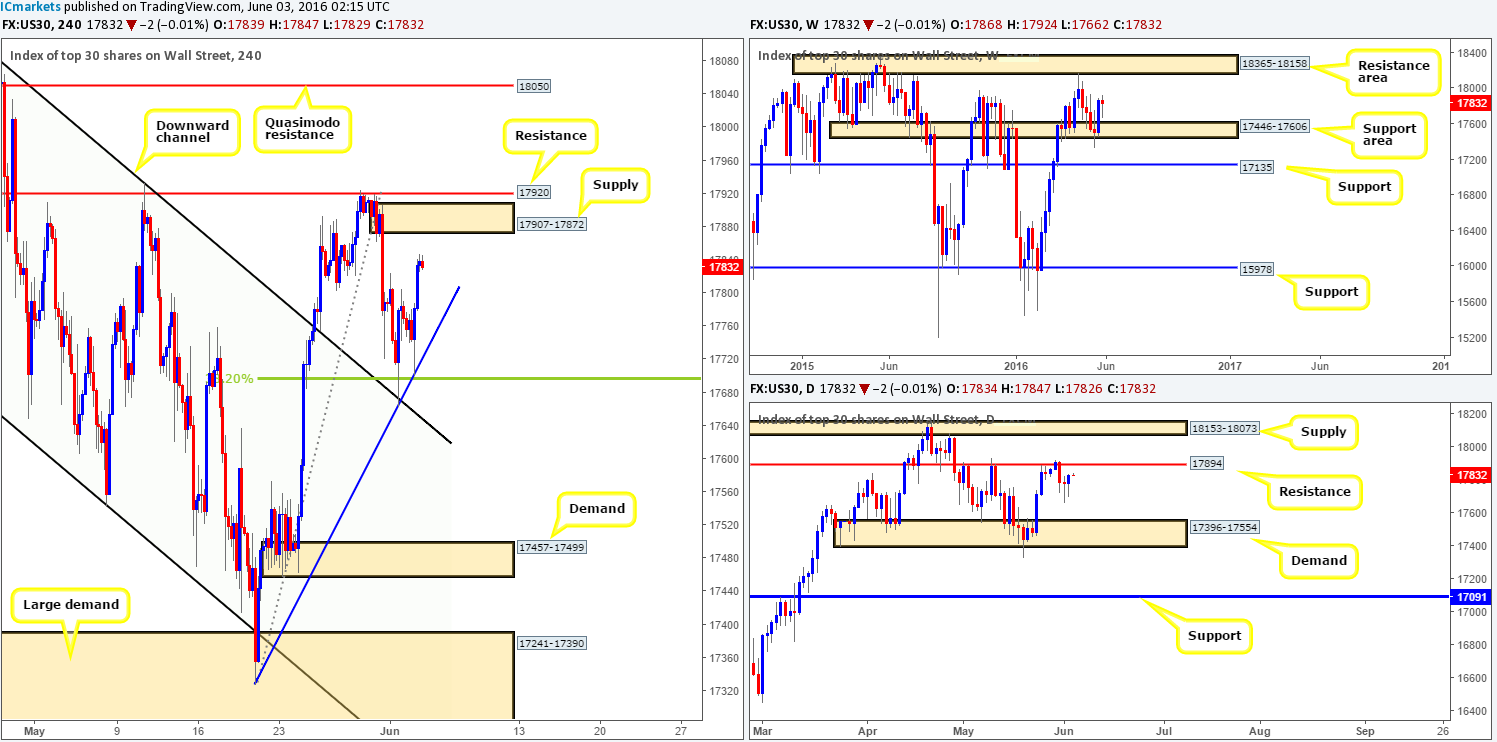
Levels to watch/live orders:
- Buys: Flat (Stop loss: N/A).
- Sells: 17907-17872 [Tentative – confirmation required] (Stop loss: dependent on where one confirms this area).
Gold:
As we mentioned in previous writings, we have not been too fond of gold for a while now. Weekly action remains loitering at the top-side of a weekly demand area at 1205.6-1181.2, and has been for the entire week now. However, this demand, which was prior supply, has served the yellow metal well over the past few months so don’t make the mistake of discounting it on the basis of this week’s rather mellow action. Sliding down into the daily chart, the metal is seen trading mid-range between a daily supply zone at 1223.7-1233.3 and a daily support line at 1191.4, so do keep a tab on these barriers.
With the H4 chart showing price also now lodged between a H4 demand at 1204.7-1207.2 and a H4 supply at 1216.4-1222.0, this market will likely remain range bound ahead of the upcoming U.S. employment report.
Areas we have our eye on currently are the H4 supply above at 1231.1-1234.4 which is lodged within the extremes of the daily supply base coming in at 1223.7-1233.3. This is a nice area to look for shorting opportunities, but remain aware of the weekly picture and the fact that price may fake above this said H4 supply to connect with a neighboring H4 supply above at 1237.5-1243.9. The only other area that has taken our fancy over the past few days is H4 demand at 1181.6-1191.1. Reason being is this zone sits just below daily support at 1191.4, and is also located within the depths of the above said weekly demand. Therefore, once/if price reaches this low our team will look at buying this market (news dependent of course).
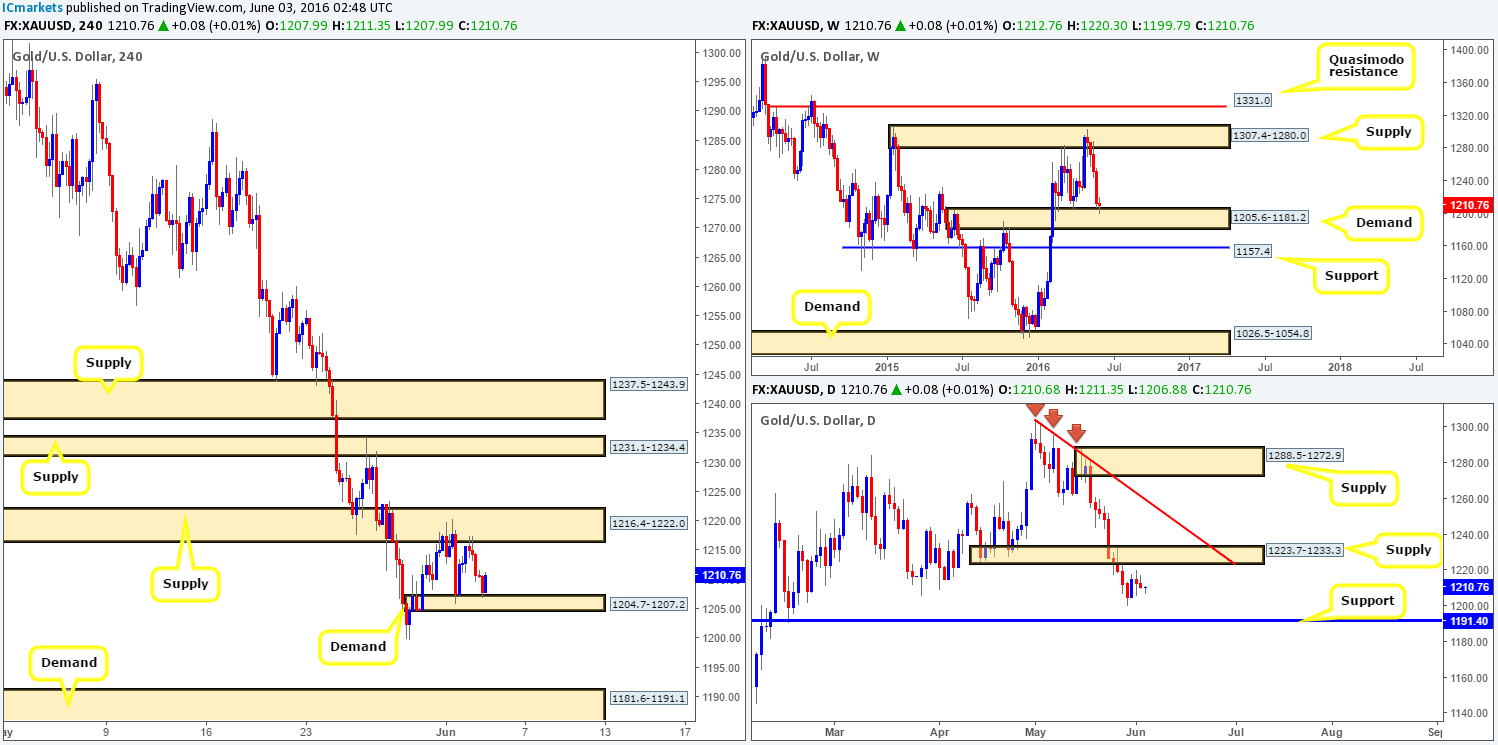
Levels to watch/live orders:
- Buys: 1181.6-1191.1 [Entering from here at market is a possibility] (Stop loss: 1180.3).
- Sells: 1231.1-1234.4 [Tentative – confirmation required] (Stop loss: dependent on where one confirms this area).


