
A note on lower timeframe confirming price action…
Waiting for lower timeframe confirmation is our main tool to confirm strength within higher timeframe zones, and has really been the key to our trading success. It takes a little time to understand the subtle nuances, however, as each trade is never the same, but once you master the rhythm so to speak, you will be saved from countless unnecessary losing trades. The following is a list of what we look for:
- A break/retest of supply or demand dependent on which way you’re trading.
- A trendline break/retest.
- Buying/selling tails/wicks – essentially we look for a cluster of very obvious spikes off of lower timeframe support and resistance levels within the higher timeframe zone.
- Candlestick patterns. We tend to only stick with pin bars and engulfing bars as these have proven to be the most effective.
We search for lower timeframe confirmation between the M15 the H1 timeframes, since most of our higher-timeframe areas begin with the H4. Stops are usually placed 5-10 pips beyond confirming structures.
EUR/USD:
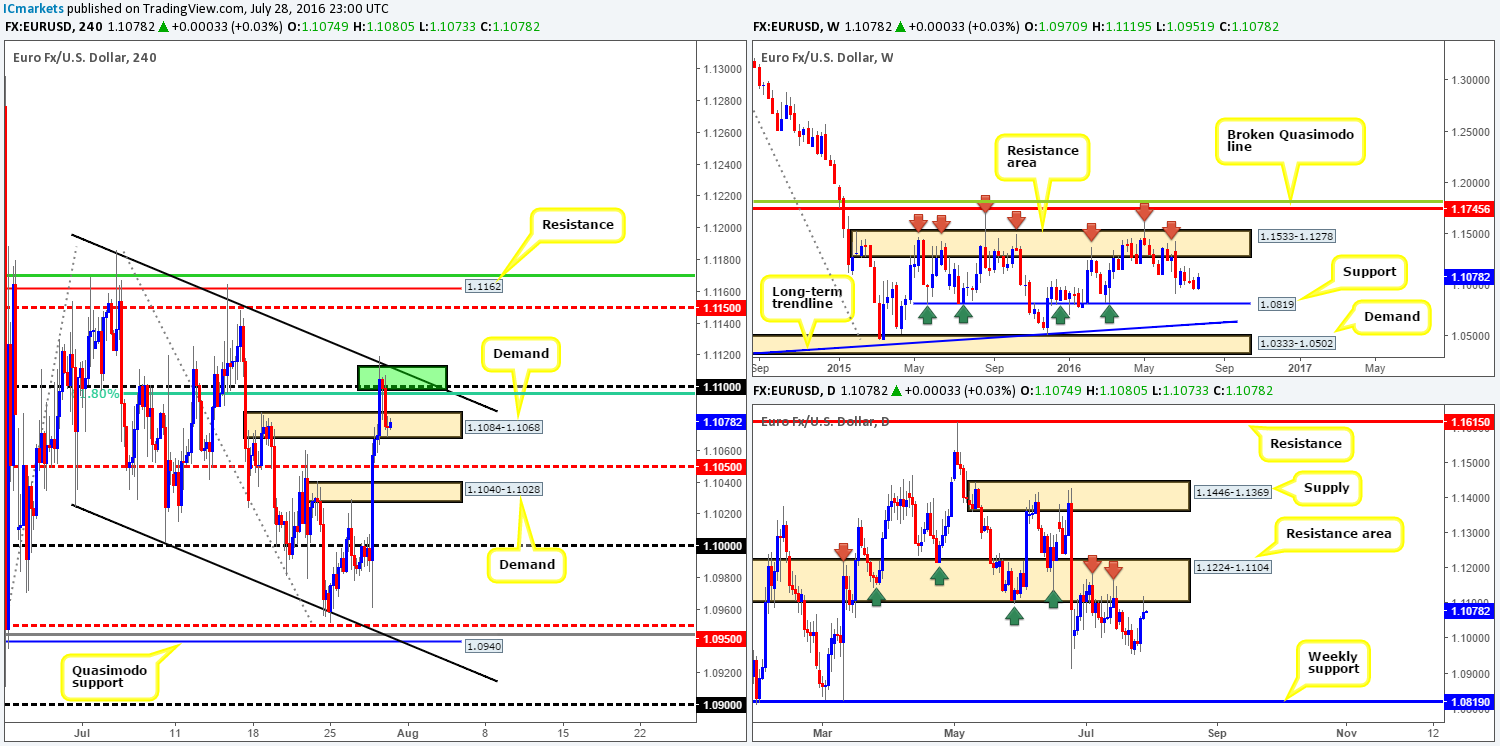
Yesterday we highlighted the 1.11 handle as being a considerable resistance zone to keep an eye ball on. This area offered a H4 61.8% Fib resistance at 1.1095, an upper H4 channel resistance line extended from the high 1.1186 and also merged nicely with the underside of a daily resistance area at 1.1224-1.1104! As can be seen from the H4 chart, the single currency advanced north in the early hours of European trading and attacked this zone. Price began topping out from here going into the London session, but did not register any noteworthy movement until the US session kicked in, consequently bringing this unit down into the jaws of a H4 demand at 1.1084-1.1068 by the close. Well done to any of our readers who managed to jump in on this one!
In view of price rebounding from the lower edge of the aforementioned daily resistance area, and with the weekly chart showing room for further downside to a weekly support at 1.0819, we remain in favor of further selling. However, selling beyond the current H4 demand is tricky! Not only is there a H4 mid-way support line at 1.1050 lurking just below, but a few pips beneath this also sits a H4 demand at 1.1040-1.1028.
Our suggestions: Seeing as there’s little space beyond the current H4 demand base, our team will remain on the sidelines today. Although higher-timeframe structures indicate selling may be the path to take, sometimes, as in this case, the H4 does not agree! When this happens, it’s best not to try and force a trade.
Levels to watch/live orders:
- Buys: Flat (Stop loss: N/A).
- Sells: Flat (Stop loss: N/A).
GBP/USD:
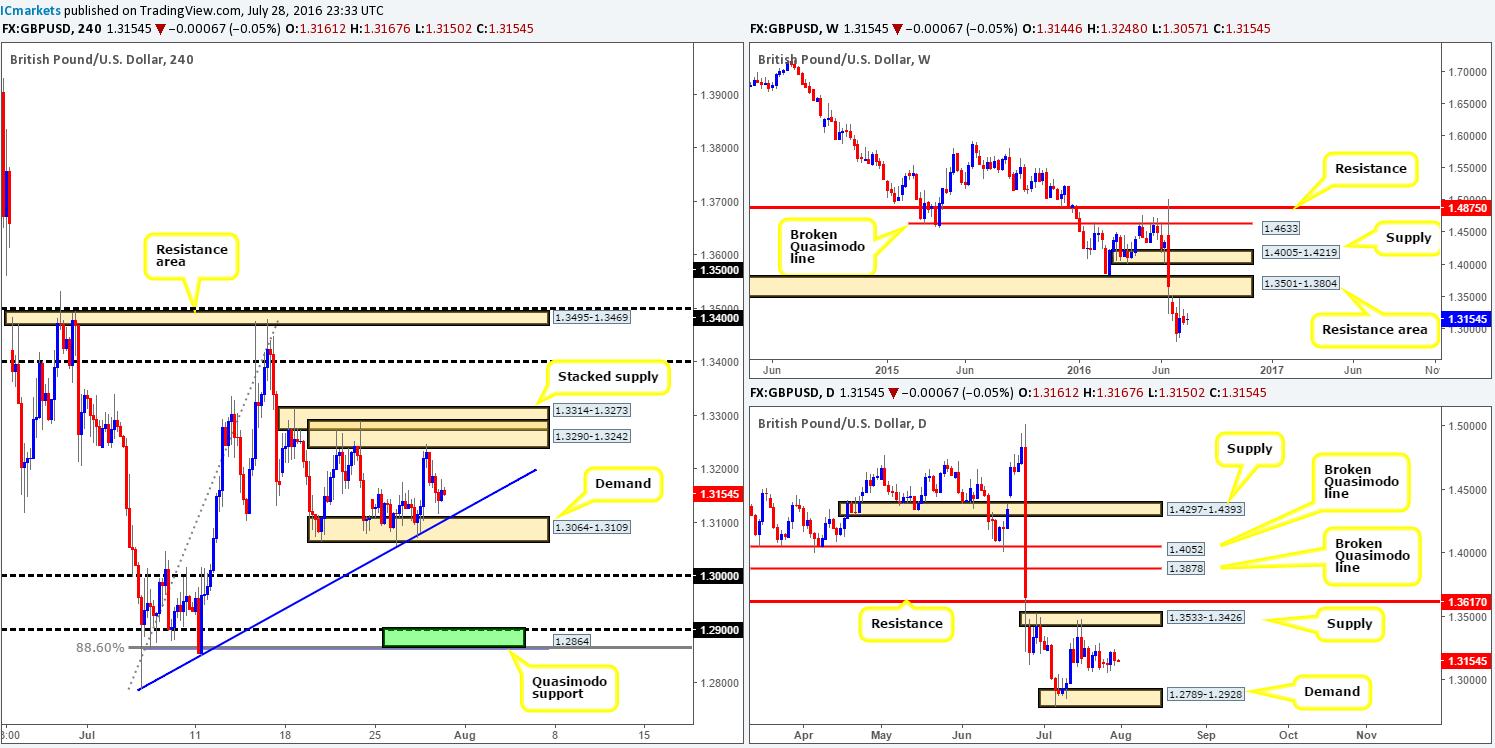
The GBP/USD, as you can see, settled around the 1.3160 mark, following a modest sell off from the underside of a H4 supply zone drawn in at 1.3290-1.3242. With H4 action now effectively capped between this supply, and a nearby H4 demand zone at 1.3064-1.3109 (merges with a H4 trendline taken from the low 1.2789), what’s the vibe like on the higher-timeframe picture?
Well, it’s clear that the predominant trend remains south. What’s more, weekly support, as far as we can see, does not come into view until around the 1.20 region. We had to re-visit 1986 to find this! This – coupled with daily movement trading mid-range between a daily supply zone at 1.3533-1.3426 and a daily demand barrier at 1.2789-1.2928, does not really give us much to work with!
Our suggestions: In that the overall direction for this pair is south, trading long from the current H4 demand area is not something we’d be interested in. However, even with a break below the current H4 demand zone, although it does confirm bearish intention, it only clears the path south down to the key figure 1.30 – a sixty-pip profit objective. Granted, one could, if price closes below this H4 area and follows up with a retest and a confirming lower timeframe sell signal (see the top of this report), look to sell here, if of course your risk/reward is still favorable.
Levels to watch/live orders:
- Buys: Flat (Stop loss: N/A).
- Sells: Watch for price to close below the H4 demand at 1.3064-1.3109 and look to trade any retest seen thereafter (lower timeframe confirmation required).
AUD/USD:
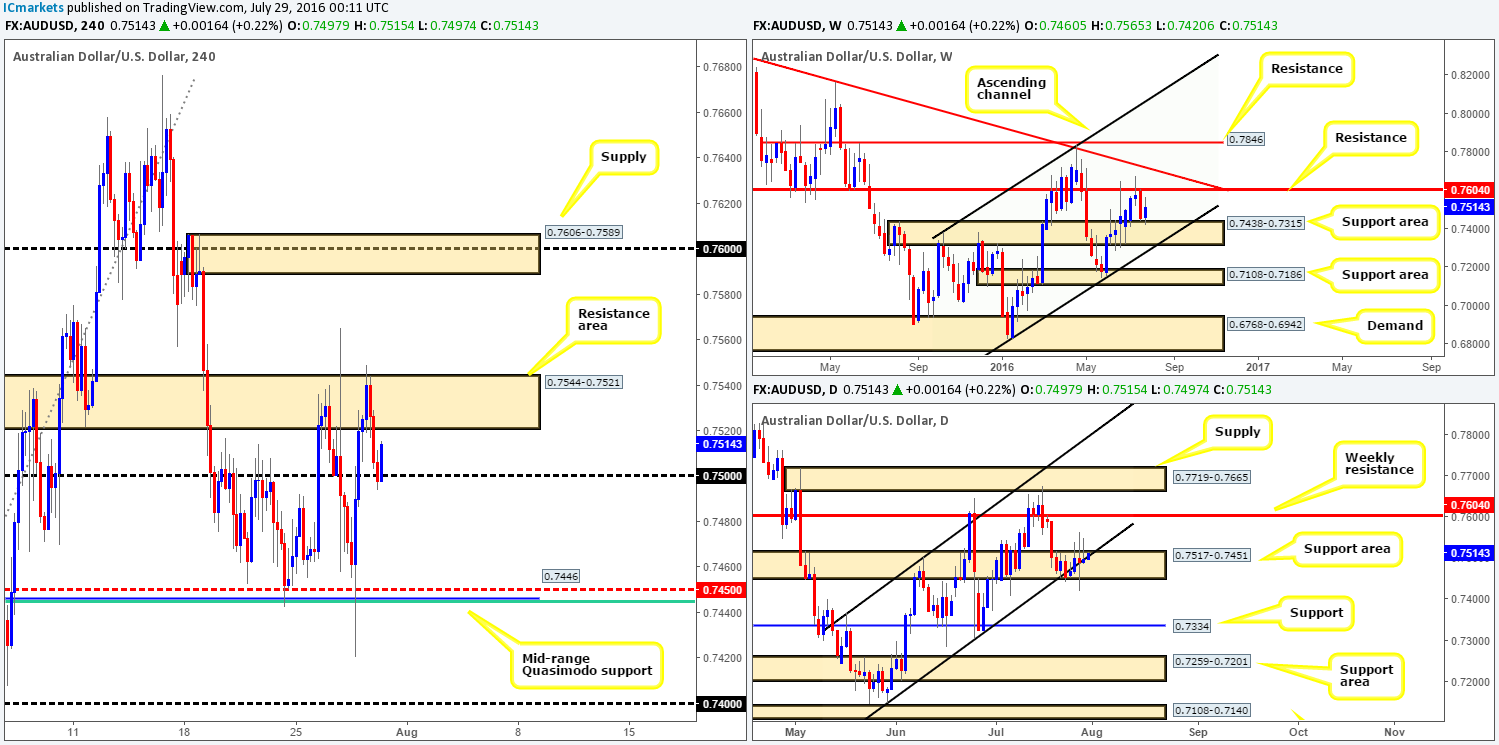
Although the current weekly candle is holding above a weekly support area at 0.7438-0.7315, bullish momentum appears to be slowing down. Alongside this, we can see that daily action has yet to register any noteworthy buying from the daily support area at 0.7517-0.7451. In fact, judging by the three back-to-back selling wicks recently printed, the bears look to have a slight edge in this market right now.
Stepping across to the H4 chart, the commodity-linked currency once again was offered around the H4 resistance area at 0.7544-0.7521 yesterday, bringing the candles down to the 0.75 handle going into the close. In the event that the buyers continue to defend this line, we may see price eventually close above the aforementioned H4 resistance area, thereby opening up the runway north up to H4 supply at 0.7606-0.7589 (envelopes the weekly resistance level at 0.7604 – the next upside target on the weekly timeframe).
Our suggestions: A close above the aforementioned H4 resistance area would, in our opinion, confirm bullish intention from the higher-timeframe structures. Therefore, a close higher followed by a successful retest, traders could look to enter long with their stops placed below the traded area. To our way of seeing things, there’s only one target to be had on this trade: the H4 supply zone mentioned above at 0.7606-0.7589!
Levels to watch/live orders:
- Buys: Watch for price to close above the H4 resistance area at 0.7544-0.7521 and look to trade any retest seen thereafter (Stop loss: 0.7515).
- Sells: Flat (Stop loss: N/A).
USDJPY:
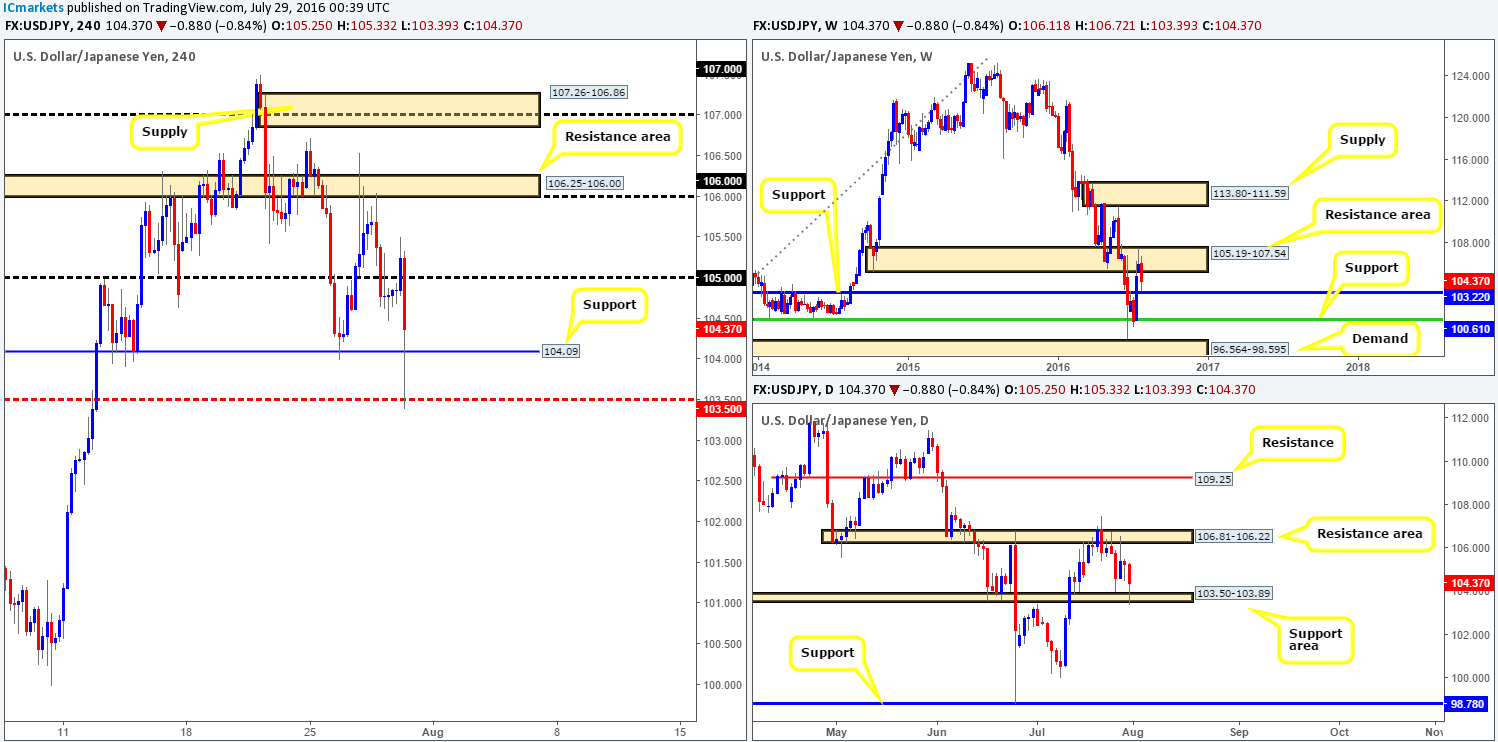
Pressured from weekly offers within the weekly resistance area at 105.19-107.54, the pair was recently forced down to within touching distance of a weekly support level penciled in at 103.22. In a similar fashion, daily action has also recently touched base with a small support area drawn from 103.50-103.89, which as you can see, is so far holding firm.
Technically, we feel that the buyers are likely going to continue pushing this market higher given the higher-timeframe picture, potentially breaking back above the 105 handle. However, with the BoJ monetary policy statement due to be release within the next few minutes, this outlook could potentially change!
Our suggestions: From a technical standpoint, we’d recommend taking a back seat in this market for now, as increased volatility is expected. However, once the dust settles, keep an eye on 105. A close above and retest of this number followed by a lower timeframe buy signal (see the top of this report) is sufficient enough to condone a buy trade up to the H4 resistance area at 106.25-106.00.
Levels to watch/live orders:
- Buys: Watch for price to close above the 105 handle and look to trade any retest seen thereafter (lower timeframe confirmation required).
- Sells: Flat (Stop loss: N/A).
USD/CAD:
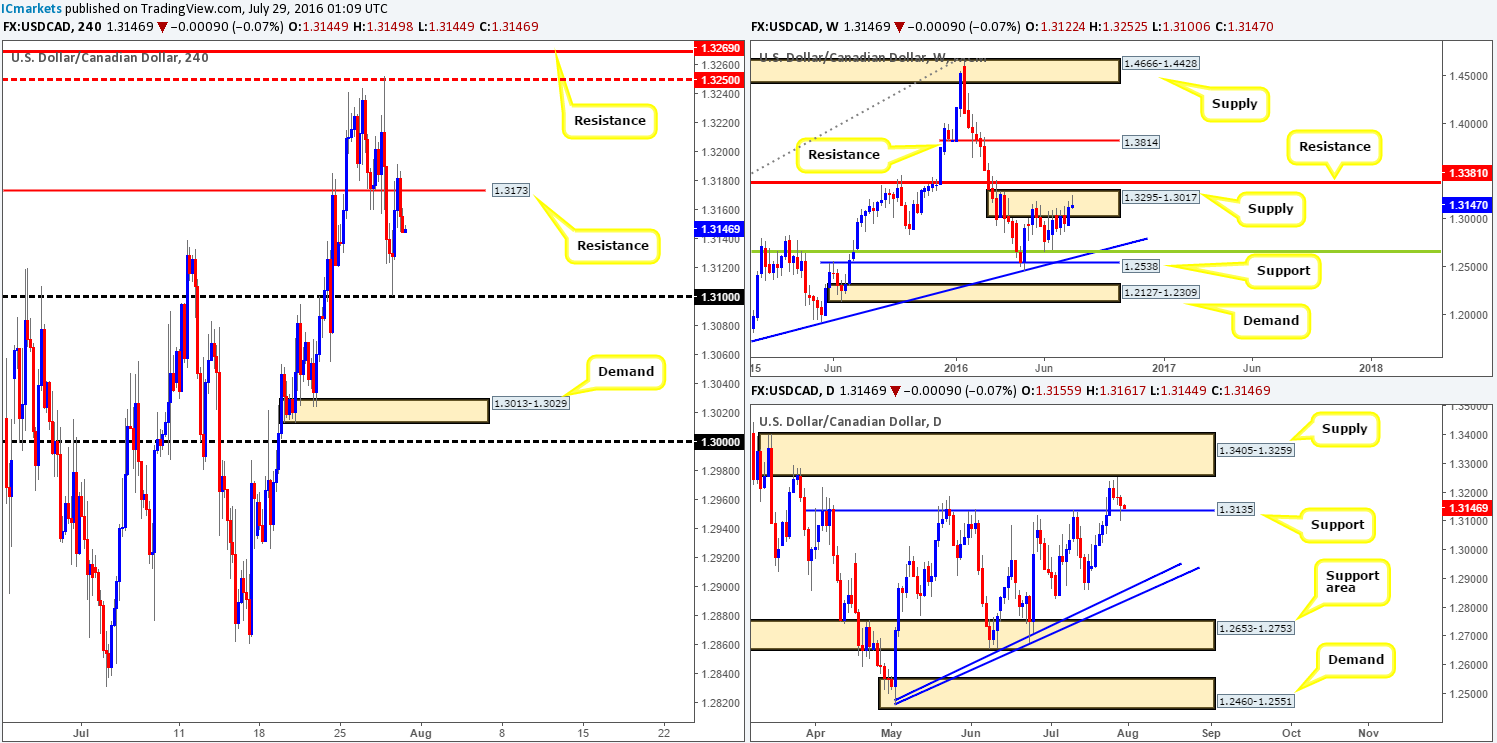
During the course of yesterday’s sessions, the USD/CAD found a strong pocket of bids around the 1.31 handle, consequently lifting the pair up to a H4 resistance level drawn from 1.3173. The 1.31 level, as you can probably see, was bolstered by a strong-looking daily support line coming in at 1.3135! However, seeing as how weekly action remains firmly within the confines of a weekly supply zone at 1.3295-1.3017, buying on the basis of this daily support is a risky play in our book!
Our suggestions: With H4 price looking as though it will retest the 1.31 level today, we may, given the position of price on the weekly chart (see above), see 1.31 give way today. Should this come to fruition, a retest followed by a lower timeframe sell signal (see the top of this report) would be required for us to trade below this number. In regard to take-profit targets from here, the areas we have in mind are as follows: the H4 demand base at 1.3013-1.3029, and the key figure 1.30.
Levels to watch/live orders:
- Buys: Flat (Stop loss: N/A).
- Sells: Watch for price to close below the 1.31 handle and look to trade any retest seen thereafter (lower timeframe confirmation required).
USD/CHF:
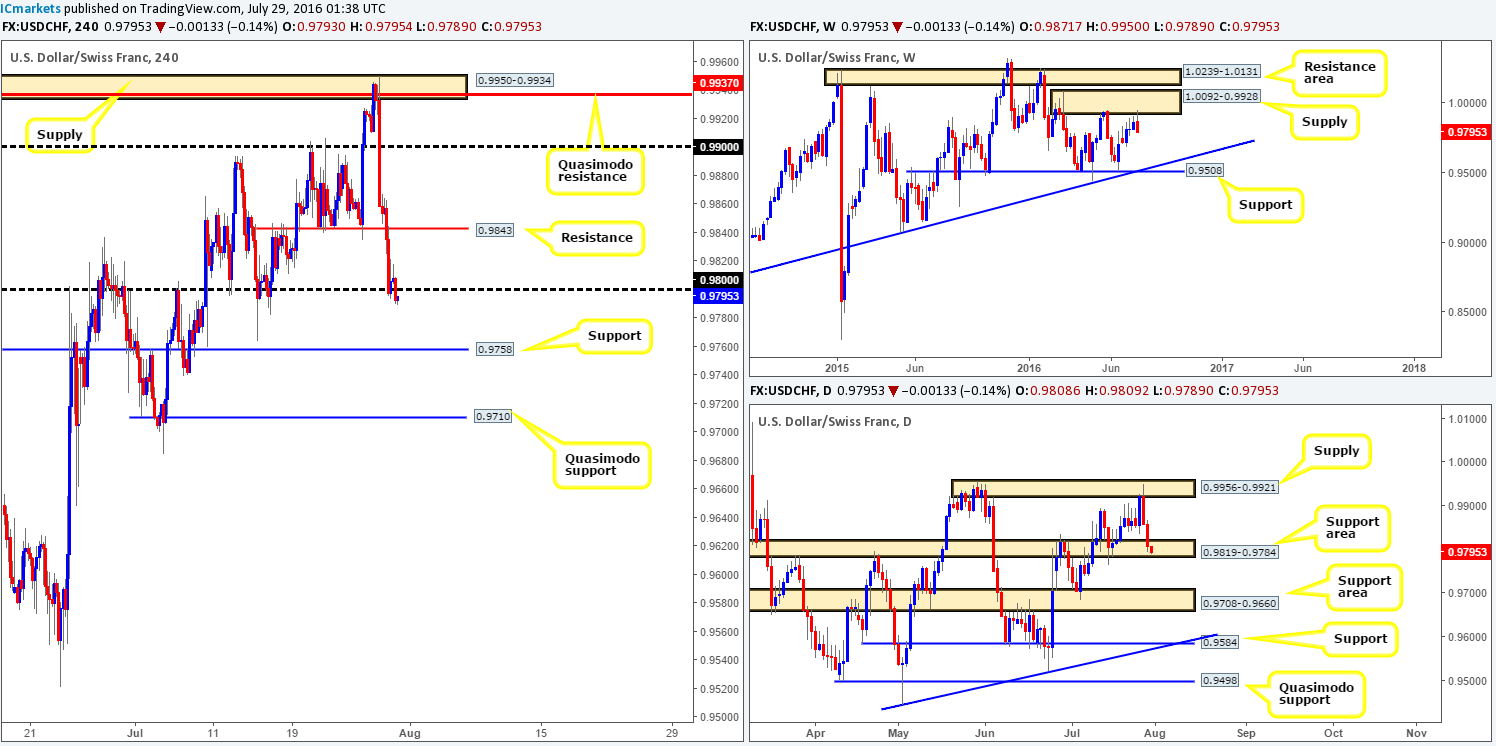
Since weekly price tagged the underside of a weekly supply zone at 1.0092-0.9928, the sellers have been in the driving seat! Already engulfing two prior weekly candles, the pair, at least from the weekly timeframe, could potentially continue driving lower to test the weekly trendline support extended from the low 0.8703. Moving down to the daily chart, however, the Swissy is seen trading within the lower edge of a daily support area seen at 0.9819-0.9784. If this area gives way today, the river south would likely be ripple free down to 0.9708-0.9660 – another daily support area.
Looking across to the H4 chart, the 0.98 handle was recently breached with downside looking clear to at least the H4 support level at 0.9758, followed by a H4 Quasimodo support line at 0.9710 (the top edge of the daily support area at 0.9708-0.9660). Apart from daily action trading from within demand at the moment, H4 and weekly structure, as far as we can see, suggest looking to short from the underside of 0.98.
Our suggestions: Watch for price to retest 0.98 today. We would not recommend playing this level blindly (setting a pending order), instead we’d advise being patient and waiting for lower timeframe confirmation (see the top of this report) before risking capital. This will not only help in avoiding a fakeout above 0.98, but it will also help avoid a loss should the daily buyers make an appearance within the above said daily demand barrier.
Levels to watch/live orders:
- Buys: Flat (Stop loss: N/A).
- Sells: 0.98 region [Tentative – confirmation required] (Stop loss: dependent on where one confirms this area).
DOW 30:
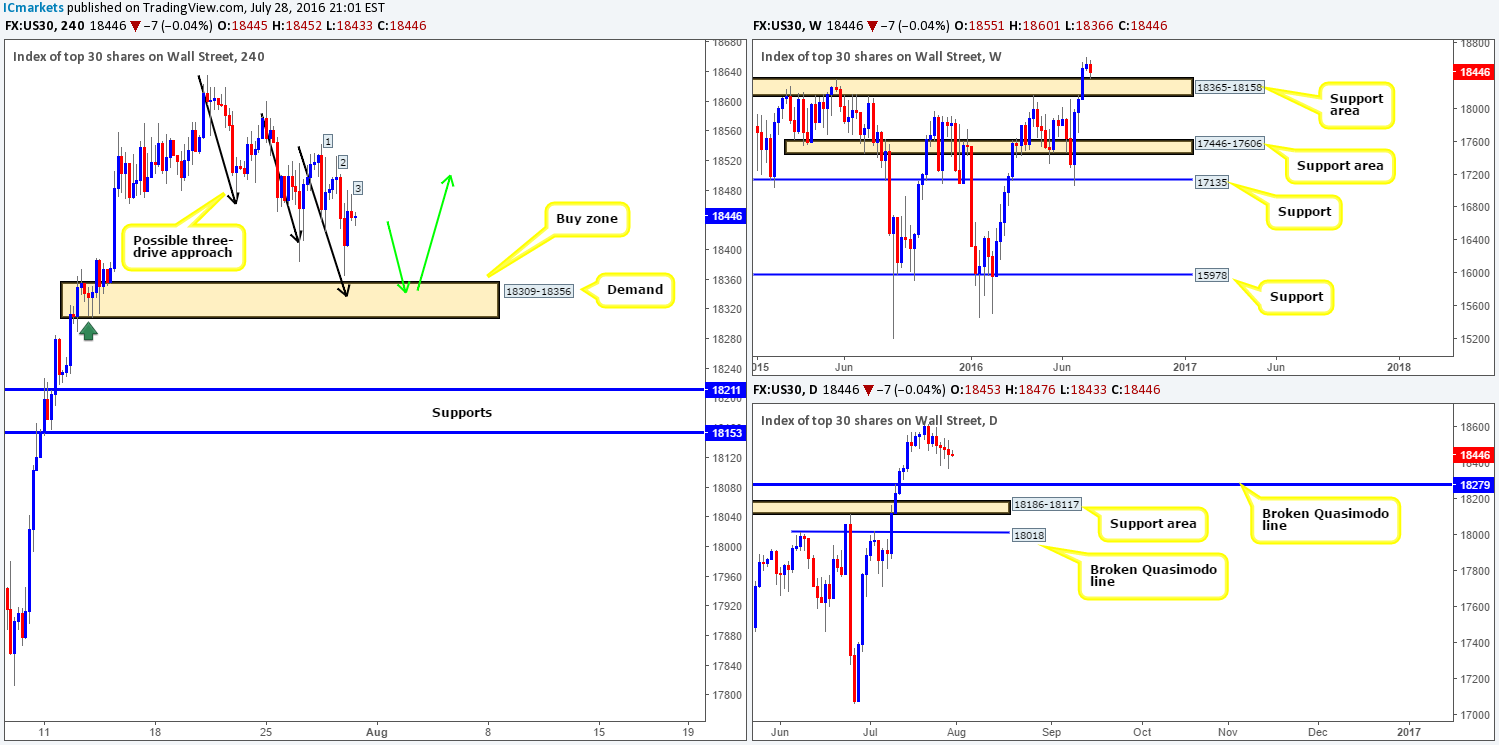
Since the beginning of the week, US stocks have been grinding lower. This has, as you can see from the H4 chart, helped form a possible H4 three-drive approach en route to a H4 demand zone coming in at 18309-18356 (see black arrows). On top of this, in recent trading price also seems to be chalking up a ‘mini’ H4 three-drive approach (see 1, 2 and 3).
Now, given that this H4 demand base is housed within a weekly support area drawn from 18365-18158, and sits just above a broken daily Quasimodo level at 18279, a reversal from this area is expected. Another thing to consider is the H4 tails seen marked with a green arrow on the H4 chart, which to us represent buying interest around this neighborhood, thus there is a strong possibility that there are unfilled orders still residing here.
Our suggestions: Despite the confluence seen around this H4 demand area, our team would still require a lower timeframe buy entry to form prior to risking capital, due to the possibility that price may fake beyond the aforementioned H4 demand into the broken daily Quasimodo line. What we mean by lower timeframe confirmation is simply either an engulf of supply followed by a subsequent retest, a trendline break/retest or simply a collection of well-defined buying tails around the higher timeframe zone. Stops are usually placed 5-10 pips beyond the confirming structure.
Levels to watch/live orders:
- Buys: 18309-18356 [Tentative – confirmation required] (Stop loss: dependent on where one confirms this area).
- Sells: Flat (Stop loss: N/A).
GOLD:
Following Wednesday’s strong advance, the yellow metal is now seen capped between a H4 supply zone seen at 1347.0-1342.4 that merges with a H4 trendline swap extended from the low 1320.4, and a H4 demand area at 1337.7-1332.8. Beyond the current supply base, there’s an overhead H4 supply area coming in at 1357.5-1353.1, while below the immediate demand area, there’s room for gold to drop down towards H4 demand seen at 1315.6-1319.6.
In light of weekly price recently coming within touching distance of hitting a weekly support area at 1307.4-1280.0, and daily action showing room to appreciate up to a daily resistance line at 1354.6, where does one go from here?
Our suggestions: With higher timeframe structure suggesting further upside is possible, a break above the current H4 supply may take place today. With that, our team will pass on selling from this area. For traders looking to buy above the H4 supply, you may want to note of the nearby H4 supply area mentioned above at 1357.5-1353.1, which envelopes the daily resistance line at 1354.6. Therefore, entering long beyond the H4 supply zone does not leave one with much room to play with in regards to risk/reward. That being the case, if one is able to secure a long position on the retest of the broken H4 supply, along with a tight enough stop, it is a trade worth taking if risk/reward is favorable!

Levels to watch/live orders:
- Buys: Watch for price to close above the H4 supply at 1347.0-1342.4 and look to trade any retest seen thereafter (lower timeframe confirmation required).
- Sells: Flat (Stop loss: N/A).


